Comparative Prediction Performance with
Support Vector Machine and Random Forest
Classification Techniques
Ashfaq Ahmed K
College of Computers and Information Technology Taif University, Taif, KSA
Sultan Aljahdali
College of Computers and Information Technology Taif University, Taif, KSA
Syed Naimatullah Hussain
College of Computers and Information Technology Taif University, Taif, KSA
ABSTRACT
Machine learning with classification can effectively be applied for many applications, especially those with complex measurements. Therefore classification technique can be used for prediction of diseases like cancer, liver disorders and heart disease etc which involve complex measurements. This is part of growing demand and much interesting towards predictive diagnosis. It has also been established that classification and learning methods can be used effectively to improve the accuracy of prediction of a diseases and its recurrence. In the present work machine learning techniques namely Support Vector Machine [SVM] and Random Forest [RF] are used to learn, classify and compare cancer, liver and heart disease data with varying kernels and kernel parameters. Results with Support Vector Machines and Random Forest are compared for different data sets. The results with different kernels are tuned with proper parameters selection. Results are better analyzed to establish better learning techniques for predictions.
General Terms
Machine learning, support vector machine, random forest, kernels, linear, non linear, radial basis function and sigmoid.
Keywords
Support Vector Machine, Random Forest, Kernels, Radial Basis Function, Sigmoid.
1.
INTRODUCTION
Disease diagnosis and prediction involves multiple physicians from different specializations in case of cancer, liver disorders and heart disease. This requires multiple biomedical markers and multiple clinical factors like the age, general health of the patient, its location, type of disease, the grade and size of the disorder. For reasonable prediction information like cell based, patient based and population based all must be carefully considered by the attending medical practitioner. It is challenging even for the most skilled technician to do. Both physicians and patients need to face same challenges when it comes to the matter of disease prevention and disease prediction. Family history, age, diet, weight, habits like smoking, heavy drinking, and exposure ultra violet radiations, radon, asbestos plays a major role in predicting an individual’s risk for developing the said diseases. Sometimes these conventional clinical, behavioral parameters and environment may not be sufficient to make better predictions. In most of the critical cases to predict the disease we need some specific molecular details about either the infected part or the patient’s genetic status. With the speedy development of the proteomic, genomic and imaging technologies, this molecular scale information about patients is now can be readily acquired.
Medical science industry has huge amount of data, but unfortunately most of this data is not mined effectively to find out hidden information in data. Advanced data mining techniques can be used to discover hidden pattern in data. Models developed from these techniques will be useful for medical practitioners to take effective decision. Data mining classification techniques like Ripper classifier, Decision Tree, Artificial neural networks (ANNs), and Support Vector Machine (SVM) are analyzed on disease dataset. Performance of these techniques can be compared through sensitivity, specificity, accuracy, error rate, True Positive Rate and False Positive Rate. Many attempts have been made predict a disease with techniques like decision trees, expert systems, neural networks and genetic algorithms etc. However, little significant work has been performed to compare the techniques with optimized parameters for each technique used.
In [1] different novel algorithms are presented for cancer disease prediction. The paper establishes that the concept of support vector is good for better predictions.
In [2] a comparative study on classification methods namely Ripper, Decision Tree, Artificial neural networks and Support Vector Machine are analyzed on cardiovascular disease dataset.
In [3] micro array cancer data sets are used for predicting the cancer disease with random forest and support vector machine. It establishes that these techniques yield better results with smaller number of genes.
In [4] support vector machine are used to predict the different levels of cancer growth. It proposes the optimum size for training sets.
In [5] it is establishes that a number of factors have been shown to increase the risk of developing heart disease. Some of these family history, high levels of LDL bad cholesterol, Family history of cardiovascular disease, High levels of LDL (bad) cholesterol, Low level of HDL (good) cholesterol, Hypertension, High fat diet, Lack of regular exercise, Obesity.
2.
MACHINE LEARNING
The idea of empirical data modeling is applicable to many engineering applications. Empirical data modeling uses an induction process to build up a model of the system, from which it can deduce responses of the system which are to be tested or observed. The observational available data obtained is finite and taken as a sample. This sampling is non-uniform and due to the high dimensional nature of the problem data, the input space will be in a sparse distribution. As a result the problem more often is wrongly presented.
Machine Learning is a concept under Artificial Intelligence and it is concerned with the development of techniques, methods and algorithms which enable the system to learn from the available data. This means the development of algorithms which enable the machine to learn from available data and perform tasks and activities of modeling with sample data and testing the new data. Machine learning works closely with statistics in many different ways. There are different techniques and methodologies developed for machine learning tasks [9]. Neural network approaches are much in use but do have limitations with generalization, producing models that normally get over fit with the data. This is a result of the optimization algorithms used for statistical method and parameter selection to select the best model possible. Other learning techniques like decision trees, ripper classification, expert systems and AI were used to predict. This problem of prediction and prognosis can be better solved with machine learning and classification support vector machine technique which implements classification.
3.
LEARNING TECHNIQUES USED
3.1
Support Vector Machine
Support Vector Machine is one of the established machine learning techniques. Support Vector Machine was first introduced, by Boser, Guyon, and Vapnik in COLT-92 in 1992. Support vector machines are used for classification and regression are with a set of related supervised learning methods [6]. These machines belong to a generalized family of linear classifiers. Support Vector Machine is mostly used classification and regression prediction tool, that implements machine learning concepts to maximize predictive accuracy, which avoids over fit to the data. A better learning technique must always avoid over fit of the data.
The initial form of support vector machine is to maximize the distance separating the elements of two different classes. When the classes to which the elements belong to are known a priori, the problem is called classification. The set of data used to calculate the boundary limit between the classes is called the training set, while the data set used to test the efficacy of the method, is called validation set.
Support Vector machines are systems that use hypothesis space of a linear function in a bigger dimensional feature space. These systems are trained with a learning algorithm with optimization theory that uses a learning bias taken from the theory of statistical learning. Support vector machine was famous with other parallel learning techniques but now it is playing a major role in machine learning research. This technique also being used in many other critical domains like image processing, patterns recognition and medical diagnosis tec. SVM becomes more important while using pixel maps as input, the accuracy of SVM is comparable with other well known modeling techniques like neural networks with extended features in a handwriting recognition task [7]. SVM is also being used for many applications, such as face
analysis, hand writing analysis, engineering, business, management and many more areas. SVMs are also being used for pattern classification and regression based applications in different domains.
The Support Vector Machines SVM have been developed by Vapnik [8] and are yielding good results due to many challenging features and better empirical performance. SVM basically uses the Structural Risk Minimization (SRM) principle; this is superior [9] to traditional Empirical Risk Minimization (ERM) principle, being used by conventional neural networks. ERM technique tries to minimize the error on the training data but SRM tries to minimize an upper bound on the expected risk with maximizing separating planes. This difference makes SVM to work with a better ability to generalize the training data and make predictions. This is always the goal of statistical learning. SVMs were developed basically to solve the classification problem, but currently they are also being used to solve regression problems [10].
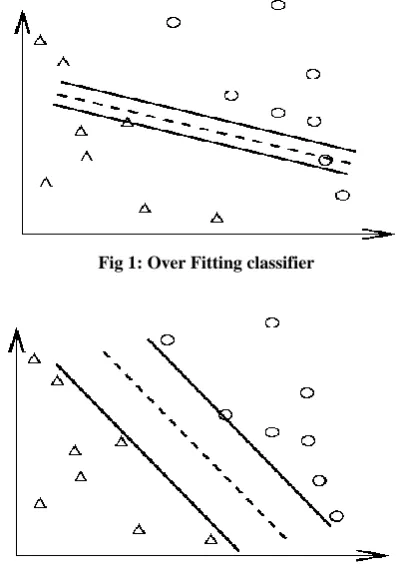
[image:2.595.325.524.318.609.2]Fig. 1 shows an over fitting classifier with data overlapping with training data. Fig. 2 shows a better classifier with almost no overlapping
Fig 1: Over Fitting classifier
Fig 2: Better Fitting classifier
3.2
Random Forest
good even with greater noise with the training data. The internal working of this technique make better internal estimates monitor error, strength, and correlation. These are then used to show the response to increasing the number of features used in the splitting the data. Internal estimates can also be used to find variable importance. Random forest also provide regression functionality with training and testing datasets.
3.3
Datasets
[image:3.595.310.542.81.212.2]A duke breast cancer data set is chosen for experiments. Training data set with few records is as shown in the following Table 1.
Table 1. Training Data Cancer Disease
Class Attribute Values
Attribute 1 Attribute 2 Attribute 3
1 -0.362 -0.314 -0.177
1 -0.459 -0.719 -1.005
1 0.103 -0.296 -0.165
-1 -0.11 -0.147 -0.402
[image:3.595.53.285.225.350.2]Testing data set with few records is as shown in the following Table 2.
Table 2. Testing Data Cancer Disease
Class Attribute Values
Attribute 1 Attribute 2 Attribute 3
1 -0.1665 0.052 -1.07
1 -0.5123 -0.326 -0.091
1 -0.2134 0.415 -0.361
-1 -0.724 -0.359 -0.847
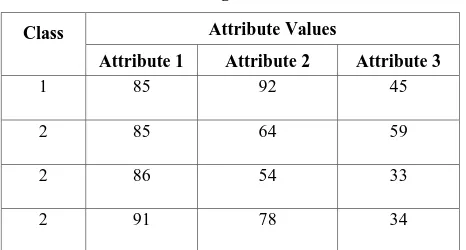
A liver disorder data set is chosen for experiments. Training data set with few records is as shown in the following Table 3.
Table 3. Training Data Liver Disease
Class Attribute Values
Attribute 1 Attribute 2 Attribute 3
1 85 92 45
2 85 64 59
2 86 54 33
2 91 78 34
[image:3.595.310.543.257.390.2] [image:3.595.50.278.403.532.2]Testing data set with four records is as shown in the following Table 4.
Table 4. Testing Data Liver Disease
Class Attribute Values
Attribute 1 Attribute 2 Attribute 3
1 0.052 0.2 -0.456
2 0.052 -0.286 -0.271
2 0.105 -0.46 -0.615
2 0.368 -0.0434 -0.602
[image:3.595.310.542.441.568.2]A heart data set is chosen for experiments. Training data set with few records is as shown in the following Table 5.
Table 5. Training Data Heart Disease
Class Attribute Values
Attribute 1 Attribute 2 Attribute 3
1 70 1 4
-1 67 0 3
1 57 1 2
-1 64 1 4
Testing data set with four records is as shown in the following Table 6.
Table 6. Testing Data Heart Disease
Class Attribute Values
Attribute 1 Attribute 2 Attribute 3
1 0.7 1 1
-1 0.58 -1 0.333
1 0.166 1 -0.333
-1 0.458 1 -0.358
4.
EXPERIMENTAL SETUP - RESULTS
A breast cancer, liver disorders and heart disease data sets are chosen for experiments. Data set is classified with support vector machine and Random Forest. The results are analyzed with a comparison of prediction performances with both the techniques. The results with different parameters are tuned and parameters selections for optimal classification results are chosen.
4.1
Setup
[image:3.595.48.281.581.706.2]different kernel functions like Linear, Polynomial, RBF and Sigmoid functions. Different training models are created using different kernel functions like Linear, Polynomial, RBF and Sigmoid.
Implementation is also done with RF tool on Mat lab with Microsoft VC++ compiler installed over it. Same breast cancer, liver disorders and heart disease data sets are used to carry out experiments with both the techniques.
4.2
Results
[image:4.595.52.280.232.396.2]The results obtained with both the techniques with breast cancer, liver disorders and heart disease data sets are tabulated shown in Table 7.
Table 7. Prediction Performances
Classification Technique
Kernel Function
Disease Dataset with Accuracy (%)
Liver Cancer Heart
SVM
Linear 57.97 75 55.55 Polynomial 57.97 0 55.55 Radial
Basis 57.97 75 55.55
Sigmoid 57.97 25 56.66 Random
Forest 57.97 75 55.55
4.3
Discussions
Results obtained for cancer and liver disease data sets with SVM and Random Forest using different kernel functions like linear, polynomial, radial basis and sigmoid are tabulated. It is noticed that there is a varying accuracy of classification with different probabilistic estimate with different kernel function.
Results are observed to be much better with Radial basis function with SVM and with certain set of parameters and these are comparable with Random Forest technique.
5.
CONCLUSION AND FUTURE WORK
It is concluded that varying results are observed with svm classification technique with different kernel functions. Each kernel function yields different results with its own parameters. Tuning kernel parameters leads better accuracy possible with that kernel. With data sets like cancer, liver disorder and heart disease random forest technique is also yielding results comparable with parameter tuned svm results. The results can be better analyzed with confusion matrix. This work can further be extended with other new kernel functions and other classification techniques.
6.
ACKNOWLEDGMENTS
Our thanks to the experts who have contributed towards development of the concepts and feed back on this paper. The authors would also like to thank the anonymous reviewers for their extensive and helpful feedback.
7.
REFERENCES
[1] Chen AH. Exploring novel algorithms for the prediction of cancer classification. Software Engineering and Data Mining(SEDM), 2010 2nd International Conference on
Software Engineering and Data Mining, June 2010 pages: 378-383, Tzu-chi Univ., Hualien, Taiwan. [2] Milan Kumari, Sunila Godara,K, Aoki Kinoshita,
Comparative Study of Data Mining Classification Methods in Cardiovascular Disease Prediction;IJCST volume:2; Pages:304-308.
[3] M.Klasssen. Learning Microarray Cancer Datasets by Random Forests and Support Vector Machine. Future Information Technology (FutureTech) 2010, 5th International Conference California University, Thousand Oaks, CA, USA, page(s): 1-6
[4] Furuta K, Aoki Kinoshita, K.F Wai-Ki ching,, Support Vector Machine Methods for the prediction of Cancer growth, 2010, 3rd international joint conference on computational science and optimization(CSO); volume:1; Pages:229-232
[5] Yanwei, X.; Wang, J.; Zhao, Z.; Gao, Y., “Combination datamining models with new medical data to predict outcome of coronary heart disease”. Proceedings International Conference on Convergence Information Technology 2007, pp. 868 – 872.
[6] Yao, Z.; Lei, L.; Yin, J., “R-C4.5 Decision tree model and its applications to health care dataset”. Proceedings of International Conference on Services Systems and Services Management 2005, pp. 1099-1103.
[7] Burke HB, Goodman PH, Rosen DB, et al. 1997. Artificial neural networks improve the accuracy of cancer survival prediction. Cancer, 79:857-62.
[8] Leenhouts HP. 1999. Radon-induced lung cancer in smokers and nonsmokers: risk implications using a two-mutation carcinogenesis model. Radiat Environ Biophys, 1999 38:57-71.
[9] E. Boser, I. Guyon, and V. Vapnik. A training algorithm for optimal margin classifiers. In Proceedings of the Fifth Annual Workshop on Computational Learning Theory, pages 144{152. ACM Press, 1992.
[10]C. Chang and C.-J. Lin. LIBSVM: a library for support vector machines, 2001. Software available at http://www.csie.ntu.edu.tw/~cjlin/libsvm.
[11]Cortes and V. Vapnik. Support-vector network. Machine Learning, 20:273-297, 1995.
[12]E. Fan, K.-W. Chang, C.-J. Hsieh, X.-R. Wang, and C.-J. Lin. LIBLINEAR: A library for large linear classi_cation. Journal of Machine Learning Research,
9:1871 1874, 2008. URL
http://www.csie.ntu.edu.tw/~cjlin/papers/liblinear. pdf. [13] L. Gardy, C. Spencer, K. Wang, M. Ester, G. E.
Tusnady, I. Simon, S. Hua, K. deFays, C. Lambert, K. Nakai, and F. S. Brinkman. PSORT-B: improving protein subcellular localization prediction for gram-negative bacteria. Nucleic Acids Research, 31(13):3613-3617, 2003.
[14]S. Keerthi and C.-J. Lin. Asymptotic behaviors of support vector machines with Gaussian kernel. Neural Computation, 15(7):1667{1689, 2003}.
[16]Michie, D. J. Spiegelhalter, C. C. Taylor, and J. Campbell, editors. Machine learning, neural and statistical classi_cation. Ellis Horwood, Upper Saddle River, NJ, USA, 1994. ISBN 0-13-106360-X. Data available at http://archive.ics. uci.edu/ml/machine-learning-databases/statlog/.
[17]W. S. Sarle. Neural Network FAQ, 1997. URL ftp://ftp.sas.com/pub/neural/ FAQ.html. Periodic posting to the Usenet newsgroup comp.ai.neural-nets.
[18]Vapnik. The Nature of Statistical Learning Theory. Springer-Verlag, New York, NY, 1995.
[19]Breiman, Leo (2001). "Random F orests". Machine Learning 45 (1): 5–32. doi:10.1023/A:1010933404324. [20]Ho, Tin (1995). "Random Decision Forest". 3rd Int'l
Conf. on Document Analysis and Recognition. pp. 278– 282.
[21]Tavel, P. 2007 Modeling and Simulation Design. AK Peters Ltd.
[22]Sannella, M. J. 1994 Constraint Satisfaction and Debugging for Interactive User Interfaces. Doctoral Thesis. UMI Order Number: UMI Order No. GAX95-09398., University of Washington.
[23]Forman, G. 2003. An extensive empirical study of feature selection metrics for text classification. J. Mach. Learn. Res. 3 (Mar. 2003), 1289-1305.
[24]Brown, L. D., Hua, H., and Gao, C. 2003. A widget framework for augmented interaction in SCAPE. [25]Y.T. Yu, M.F. Lau, "A comparison of MC/DC,
MUMCUT and several other coverage criteria for logical decisions", Journal of Systems and Software, 2005, in press.