ISSN Online: 2162-6006 ISSN Print: 2162-5999
Flame Spread over Liquid Fuel on a Water
Layer-Basic Research on Tsunami Fire
Shingo Kuwana, Hidekazu Tamizu, Akihiko Ito, Hiroyuki Torikai
Department of Intelligent Machines and System Engineering, Hirosaki University, Hirosaki, Japan
Abstract
The purpose of this study is to reveal the flame spreading mechanism of tsu-nami fire. But the mechanism of tsutsu-nami fire is so complex that we couldn’t assess qualitatively. So the basic research on tsunami fire is needed. As a first step, we did flame spread experiment on only liquid fuel and liquid fuel/water layer under static liquid fuel. We measured flame spread rate. As a result, fuel thickness is in range of 5 - 15 mm, and flame spread rate over only liquid fuel is faster than liquid fuel/water layer’s at same fuel thickness. To reveal the gap of the flame spread rate at same liquid fuel thickness, we visualized current distribution by PIV and thermal boundary layer by shadowgraph method. By these results, we revealed that the thermal characteristic length is longer and the current characteristic depth of liquid fuel/water is deeper than that of liq-uid only fuel.
Keywords
Tsunami Fire, Flame Spread, Liquid Fuel, Liquid Fuel/Water Layer
1. Introduction
In the Great East Japan Earthquake of 2011, the Tohoku region was seriously damaged by fires which were caused by the tsunami (tsunami fires). The cause of the tsunami fires was basically electrical short circuits of some electricity such as from batteries, or car crashes of cars and so on. Liquid fuels that had leaked from cars, oil tanks and so on ignited. In addition, the ignited liquid fuels flowed on seawater and spread in unexpected directions. This was the mechanism of tsu-nami fires. According to some predictions, further earthquakes will occur. This means that tsunami fires will also be caused. To reduce the damage of tsunami fires, tsunami shelters and hazard maps are required. Many studies of flame spread over liquid fuel have been performed [1]-[13]. But there are few studies of flame spread over liquid fuel on a water layer like tsunami fires. So basic
re-How to cite this paper: Kuwana, S., Ta-mizu, H., Ito, A. and Torikai, H. (2017) Flame Spread over Liquid Fuel on a Water Layer-Basic Research on Tsunami Fire. Open Journal of Safety Science and Technology, 7, 11-21.
https://doi.org/10.4236/ojsst.2017.71002 Received: January 11, 2017
Accepted: February 13, 2017 Published: February 16, 2017 Copyright © 2017 by authors and Scientific Research Publishing Inc. This work is licensed under the Creative Commons Attribution International License (CC BY 4.0).
http://creativecommons.org/licenses/by/4.0/
search on flame spread over a fuel/water layer is needed to reveal the mechanism of tsunami fires. In this study, as the first step in studying tsunami fires, we measured flame spread rate over static liquid fuel on solid board and liquid fuel on water and compared the results. To consider the results of measurement of flame spread rate, we visualized the current distribution by the PIV method and the thermal boundary layer by the shadowgraph method. From the experimental results, we compared and considered the influence of the current distribution and thermal boundary layer on flame spread rate over liquid fuel on board or on water.
2. Experimental Apparatus and Methods
2.1. Measurement of Flame Spread Rate
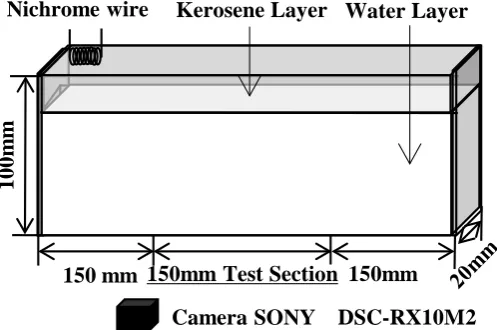
[image:2.595.250.499.551.716.2]The fuel container for measurement of flame spread rate and visualization expe-riments, we used a heat-resistant glass casting fuel container. For the freeboard, we poured liquid fuel of a certain quantity and filled with water (fuel/water lay-ers) or brass solid plate and heat-resistant glass plate (fuel only layer). We used nycrome wire for ignition. We used n-decane and kerosene as a liquid fuel.
Figure 1 shows the experimental apparatus to measure flame spread rate. Fuel thicknesses and initial temperatures are parameters. The flame spreading phe-nomena was recorded by video camera (SONY DSC-RX10M2 30fps) which was attached right over the experimental apparatus and measured the blue flame leading edge on captured images. Then we calculated the average flame spread rate 𝑣𝑣̅ by least-squares method. We did the experiment three times at the same condition and defined flame spread rate vave by calculation of three times the
average.
2.2. Flow Visualization Methods
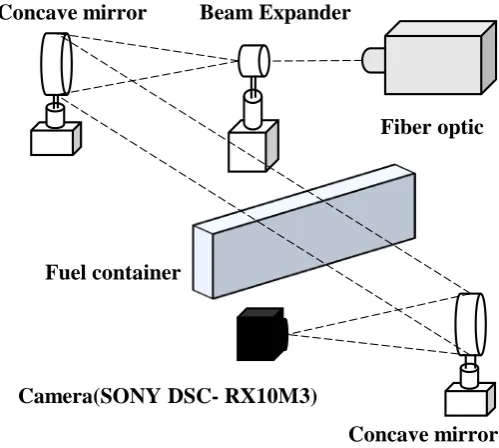
Figure 2 shows the experimental apparatus for flow visualization to observe the current distribution. We measured it by laser sheet. The laser was a LD excita-tion Nd: YAG/YVO4 solid laser (Kato Koken CO, LTD PIV Laser G450 450 m
Figure 1. Experimental apparatus for measuring flame spread rate.
150 mm 150mm Test Section 150mm
100m
m
Nichrome wire
Water Layer
Camera SONY
DSC-RX10M2
W/532 nm, sheet thickness is 2 mm) and was attached right over the experi-mental apparatus irradiated to width center of the fuel container. We used TiO2
particles (average diameter is about 35 nm) as a tracer. We filmed the current distribution by camera (SONY DSC-RX10M2 60fps) and fitted it just beside the experimental apparatus. Figure 3 shows how to analyze the current distribution. To analysis the experimental video, we used PIV and current characteristic depth
f
h , the depth from the fuel surface to the point that convection velocity is smaller than 1 mm/s in water (fuel/water layers) or same value as the fuel thickness (fuel only layer). Fuel thicknesses and initial temperatures are parameters. We deter-mined hf the time average for condition.
[image:3.595.238.487.348.510.2]2.3. Measurement of Thermal Boundary Layer
[image:3.595.236.513.548.713.2]Figure 4 shows the experimental apparatus for the shadowgraph method to vi-sualize the temperature field. We used a light fiber lamp as the light source. The light beam from the light source went through a beam expander and became a parallel light beam using a concave mirror. The parallel light beam went through the fuel container, reflected by the concave mirror and the image was recorded
Figure 2. Experimental apparatus for flow visualization.
Figure 3. The method to determine h .f
Camera SONY
DSC-RX10M2
(450 mW / 532 nm)
Nd YAG / YVO4
Laser
h
fLiquid fuel
Water
Figure 4. Experimental apparatus for shadowgraph.
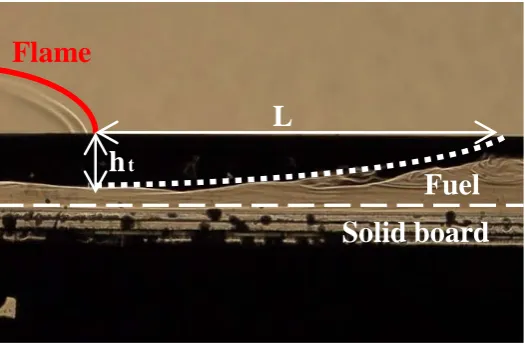
by camera (SONY DSC-RX10M3) directly at the same time. Figure 5 shows how to measure the thermal characteristic length L and depth ht. L is the length
from the flame leading edge to the front of the thermal boundary layer. The ht
is the depth from the fuel surface to the deepest thermal boundary layer edge just under the flame. Fuel thicknesses and initial temperatures are parameters. Flame leading edge position depends on the time because of pulsation. So we deter-mined ht and L averaged in certain time for the conditions.
3. Theoretical Analyses
3.1. Non-Dimensional Flame Spread Rate
We used the following equations referred to in the literature [13]. Then, we de-fined quenching distanceδ, diffusion coefficient D and flame spread rate vave,
ave D
v V
V D
δ
= (1)
The quenching distance δ is almost constant (0.8 mm) independent of fuel
[13]. VD is the diffusion rate. On the other hand, the diffusion coefficient of
fuel is calculated by Equation (2) [14], 2
0
101325 flame
f T
D D
T P
=
(2)
P is ambient pressure, Tflame is the temperature of the flame leading edge 1100 K [13]. Tf is the flashpoint in open cup [15]. D0 is the diffusion coeffi-cient at 300 K, 1atm [16], calculated by Equation (2) and we used it at 273 K. The flame spread rate vave was obtained by experiments. If the value of
Equa-tion (1) is more than 1, liquid fuel is in super-flash condiEqua-tion. If the value is less than 1, liquid fuel is in sub flash condition.
Fuel container
Concave mirror
Beam Expander
Fiber optic
Camera(SONY DSC- RX10M3)
Figure 5. The method to measure L and ht.
3.2. The Non-Dimensional Number
To organize pulsating flame spread rate, we defined the non-dimensional num-bers below [13].
2 2 2 3 2
5 2 4 t t T h g T Gr h L
γ β ρ µ σ
∆
=
(3)
2 2 2 4 t T t h T Ma h L γ ρσ µ ∆ =
(4)
Pr ν
α
= (5)
f t h
h
γ ≡ (6)
2 2
2 2 2 2
4 1 1 C C t t T T
h Gr G
h C C h
L MaPr
β ρ
α
σ ν
= = (7)
where Gr is Grashof number, Ma is Marangoni number, Pr is Prandtl number, β
is the coefficient of cubic expansion, μ is the viscosity, a is thermal diffusivity, v
is kinematic viscosity, ρ is density, σT is the temperature derivative of surface
tension coefficient [17] and
∆
T
is the gap between initial fuel temperature andflashpoint. Then, the Gr number is related to ht, and the Ma number is related
to L. The experimental data is expressed as,
By submitting Equation (7) into Equation (3) (4), we can obtain the following Equation (8).
1 1 2 2 2 2 1 2 1 1 1 2 4 Pr C C C C T C Gr Ma T µ α
γ ρσ ν
+ +
+ ⋅ ⋅
=
⋅ ⋅ (8)
1
C and C2 are fitted to the experimental data each fuel/water layers and fuel
only layer: 5
1 5.27 10 , 2 0 19. 5
C = × − C = , for fuel/water layers,
4
1 1.37 10 , 2 209
C = × − C = , for fuel only layer. Equation (3) includes hf and ht so it is valid for scaling analysis of flame spreading phenomena. Scaling analysis of pulsating flame spread rate using Equations (1) and (3) was performed only for alcohol fuel. In this study, we tried to estimate whether these equations can
h
tL
Flame
Fuel
be used for n-decane and kerosene. Some properties of n-decane and kerosene are referred from the literature [15] [16] [17] [18].
[image:6.595.257.491.345.503.2]4. Experimental Results and Examination
4.1. Flame Spread Rate
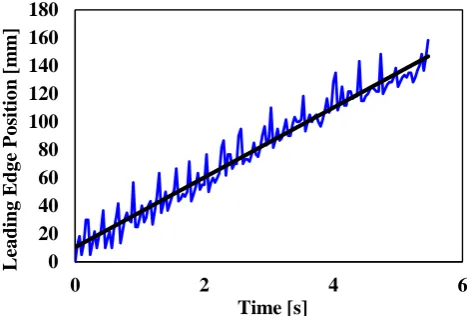
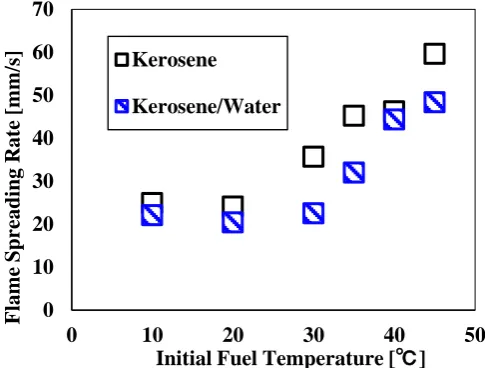
Figure 6 shows the flame leading edge position versus time in the test section. As can be seen, the flame spreading phenomena is pulsation [13]. The black line shows approximate line calculated by least-squares method. Figure 7 shows ex-perimental results of flame spread rate over liquid fuel on the fuel/water layer and fuel only layer versus fuel thickness. In the range of 5 - 15 mm of fuel thick-ness, flame spread rate on the fuel/water layer is slower than that on fuel only layer of n-decane and kerosene. And both flame spread rate and fuel thickness increase in this range. But when fuel thickness is more than 20 mm, flame spread rate is almost same between the fuel/water layer and the fuel only layer. Figure 8
shows experimental results of flame spread versus initial temperature. In the all conditions, fuel/water layer is slower than that on fuel only layer. To reveal these results, we performed visualization of current and thermal distributions.
[image:6.595.253.495.541.715.2]Figure 6. The relationship between flame leading edge and time.
Figure 7. Experimental result of measuring flame spread rate.
0 20 40 60 80 100 120 140 160 180
0 2 4 6
L
ead
in
g
E
d
ge
P
os
it
ion
[
m
m
]
Time [s]
0 10 20 30 40 50 60 70
0 5 10 15 20 25
F
la
m
e
S
p
rea
d
in
g
R
a
te [
m
m
/s]
Fuel Thickness [mm] Kerosene Kerosene/Water decane
Figure 8. Experimental result of measuring flame spread rate.
4.2. Visualization of Current Distribution
Figure 3 shows a capture photo of the current distribution in the fuel/water layer. Table 1 shows experimental results of hf . The hf in the fuel/water layer is thicker than in the fuel only layer due to flow of water layer. And convection velocity in fuel/water layer is slower than the fuel only layer.
[image:7.595.206.539.498.596.2]4.3. Visualization of Thermal Boundary Layer
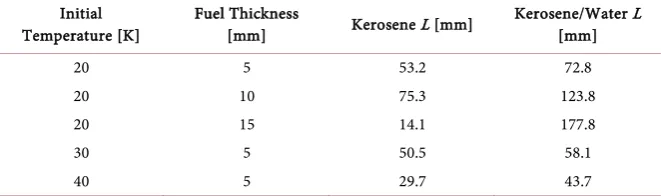
Figure 5 shows a capture photo of the thermal boundary layer in only layer. Ta-ble 2 and Table 3 show the experimental results of temperature characteristic depth ht. Table 4 and Table 5 show characteristic length L. Although ht is
almost the same, L on the fuel/water layer is longer than the fuel only layer.
Table 1. Experimental result of measuring h f for kerosene.
Initial
Temperature[K] Thickness [mm] Fuel
Kerosene
f h [mm]
Kerosene/Water
f h [mm]
20 5 5 10.7
20 10 10 12 20 15 15 16
30 5 5 7.6
[image:7.595.207.541.634.734.2]40 5 5 5
Table 2. Experimental result of measuring ht for kerosene.
Initial
Temperature [K] Thickness [mm] Fuel
Kerosene
t h [mm]
Kerosene/Water
t h [mm]
20 5 3.4 3.4 20 10 5.2 5.8 20 15 8.3 3.8 30 5 3.8 3.9 40 5 2.5 2.8
0
10
20
30
40
50
60
70
0
10
20
30
40
50
F
la
m
e
S
p
rea
d
in
g
R
a
te [
m
m
/s]
Initial Fuel Temperature [
℃
]
Kerosene
Table 3. Experimental result of measuring h f for n-decane.
Initial Temperature
[K] Thickness [mm] Fuel N-decane t
h
[mm]
N-decane/Water
t h [mm]
[image:8.595.208.539.186.284.2]40 5 3.4 3.5 40 10 6.3 6.5
Table 4. Experimental result of measuring L for kerosene.
Initial
[image:8.595.207.539.316.373.2]Temperature [K] Fuel Thickness [mm] Kerosene L [mm] Kerosene/Water L [mm] 20 5 53.2 72.8 20 10 75.3 123.8 20 15 14.1 177.8 30 5 50.5 58.1 40 5 29.7 43.7
Table 5. Experimental result of measuring L for n-decane.
Initial
Temperature [K] Thickness [mm] Fuel N-decane L [mm] N-decane/Water L [mm] 40 5 43.2 84.7 40 10 57.8 80.3
4.4. Consideration of Experimental Results
Figure 9(a) and Figure 9(b) show the current and thermal distribution models in the liquid fuel layer referred from experimental results. The vectors show the current model using the experimental results. The broken lines show a simple model for the thermal boundary layer using the results.
One reason for the gap of flame spread rate in range of 5 ~ 15 mm is that vor-tex scale is larger and convection velocity is slower than in the fuel only layer. The reason why the flame spread rate over liquid fuel on fuel/water layer is slower than with the fuel only layer is thought to depend on the vortex scale. Al-though L in the fuel/water layer is longer than the fuel only layer, convection velocity is slower and vortex scale is larger than with the fuel only layer. That is why the region of more than flashpoint of the fuel/water layer is smaller than fuel only layer due to the water layer. So it seems that the flame spread rate on the fuel/water layer is slower than with the fuel only layer. Also, the flame spread phenomena with fuel thickness more than 15 mm does not change according to the flame spread rate measurement results.
4.5. Scaling Analysis
(a) (b)
Figure 9. (a) Current and thermal distribution model in fuel/water layer; (b) Current
and thermal distribution model in fuel layer in fuel only layer.
Figure 10. Experimental result of measuring flame spread rate.
5. Conclusions
Based on measurements of flame spread rate and visualization of current and thermal boundary layers of the fuel/water layer and fuel only layer as basic re-search on tsunami fires, we arrived at the following conclusions.
1) The flame spread rate in a fuel thickness range of 5 - 15 mm on a fuel/water layer is slower than on a fuel only layer. And the flame spread rate is almost the same in the case of fuel thickness 3 mm and more than 20 mm.
2) By visualizing the current distribution, the current characteristic depth in the fuel/water layer is deeper than the fuel only layer. On the other hand, the convection velocity of the fuel/water layer is slower than the fuel only layer at fuel thickness of 10 mm.
3) Using thermal visualization, although the temperature characteristic depth
Solid board
Fuel
: Thermal boundary layer
: Flow vector
Water
Fuel
: Thermal boundary layer
: Flow vector
0.1
1
1E-10
1E-09
1E-08
2 layer thin
fuel only thin
2 layer deep
[image:9.595.219.510.300.512.2]t
h is almost the same, the temperature characteristic length of the fuel/water layer is longer than that of the fuel only layer.
4) By scaling analysis using our experimental data, the same tendency as al-cohol fuel is obtained because the plots have constant upward gradient. Fuel/ water layers condition is classified deep pools.
Acknowledgements
This work is supported by Grants-in-Aid for Scientific Research (KAKENHI), No. 15H03924.
References
[1] Burgoyne, J.H., Roberts, A.F. and Quinton, P.G. (1968) The Spread of Flame Across a Liquid Surface. I. The Induction Period. Proceedings of the Royal Society A, 308, 39-53. https://doi.org/10.1098/rspa.1968.0206
[2] Ross, H.D. (1994) Ignition of and Flame Spread over Laboratory-Scale Pools of Pure Liquid Fuels. Progress in Energy and Combustion Science, 20, 17-63.
https://doi.org/10.1016/0360-1285(94)90005-1
[3] Grassman, I. and Dryer, F. (1981) Flame Spreading across Liquid Fuels.Fire Safety Journal, 3, 123-138.
[4] Glassman, I., Hansel, J. and Eklund, T. (1969) Hydrodynamic Effects in the Flame Spreading, Ignitability and Steady Burning of Liquid Fuels. Combustion and Flame, 13, 99-101. https://doi.org/10.1016/0010-2180(69)90037-6
[5] Garcia-Ybarra, P.L., Antoranz, J.C., Sankovitch, V. and Castillo, J.L. (1994) Experi-mental Evidence of Self-Excited Relaxation Oscillations Leading to Homoclinic Be-havior in Spreading Flames. Physical Review E, 49, 5225-5229.
https://doi.org/10.1103/PhysRevE.49.5225
[6] Millar, F.J., and Ross, H.D. (1992) An Enhanced Flame Radiation Burner. Proceed-ings of the Combustion Institute, 24, 1075-1083.
https://doi.org/10.1016/S0082-0784(06)80127-X
[7] Akita, K. (1972) Some Problems of Flame Spread along a Liquid Surface. Proceed-ings of the Combustion Institute, 14, 1075-1083.
https://doi.org/10.1016/S0082-0784(73)80097-9
[8] Ito, A., Masuda, D. and Saito, K. (1991) A Study of Flame Spread over Alcohols Us-ing Holographic Interferometry. Combustion and Flame, 83, 375-389.
https://doi.org/10.1016/0010-2180(91)90084-O
[9] Hirano, T., Suzuki, T., Mashiko, I. and Tanabe, N. (1980) Gas Movements in Front of Flames Propagating Across Methanol. Combustion Science Technology, 22, 83-
91. https://doi.org/10.1080/00102208008952373
[10] Mackinven, R., Hansel, F. and Glassman, I. (1970)Influence of Laboratory Parame-ters on Flame Spread Across Liquid Fuels. Combustion Science Technology, 1, 293- 306. https://doi.org/10.1080/00102206908952209
[11] Konishi, T., Ito, A., Kudou, Y. and Saito, K. (2002) The Role of a Flame-Induced Liquid Surface Wave on Pulsating Flame Spread. Proceedings of the Combustion Institute, 29, 267-272. https://doi.org/10.1016/S1540-7489(02)80036-0
[12] Matsumoto, Y. and Saito, T. (1981) Flame Propagation over Liquid Fuel at Sub- Flash Temperature. Bulletin of JSEM, 24, 160-167.
https://doi.org/10.1299/jsme1958.24.160
Pulsating Flame Spread over Liquids. International Journal of Chemical Engineer-ing, 2008, Article ID: 178292. https://doi.org/10.1155/2008/178292
[14] Heet Transfer Engineering Materials. Revised Edition 4, The Japan Society of Me-chanical Engineers.
[15] (2013) Material Safety Data Sheet. Sankyo Rikagaku Co., Ltd.
[16] Tang, M.J., et al. (2015) Supplement of Atmos. Chemical Physics, 15, 5585-5598. [17] Kuhlmann, H.C., Lappa, M., Melnikov, D., Mukin, R., Muldoon, F.H., Pushkin, D.,
Shevtsova, V. and Ueno, I. (2014) The Jeremi-Project on Thermocapillary Convec-tion in Liquid Bridges. Part A: Overview of Particle AccumulaConvec-tion Structures. Fluid Dynamics and Materials Processing, 10, 1-36.
[18] Dymond, J.H. and Oye, H.A. (1993) Viscosity of Selected Liquid n-Alkanes.
http://www.nist.gov/srd/upload/jpcrd468.pdf
Submit or recommend next manuscript to SCIRP and we will provide best service for you:
Accepting pre-submission inquiries through Email, Facebook, LinkedIn, Twitter, etc. A wide selection of journals (inclusive of 9 subjects, more than 200 journals)
Providing 24-hour high-quality service User-friendly online submission system Fair and swift peer-review system
Efficient typesetting and proofreading procedure
Display of the result of downloads and visits, as well as the number of cited articles Maximum dissemination of your research work