1
Contents
Foreword 3
Mission Statement and Organisational Structure
4
Articles
Weather Review 2007 - Ireland
5
Summary 2007 - Ireland
10
Weather Review 2007 - Global
11
ICHEC / Met Éireann Colloboration
17
Passing of Noted Irish Meteorologists
18
Strategic Management
19
- Delivering Met Éireann’s High-Level Goals
Appendices
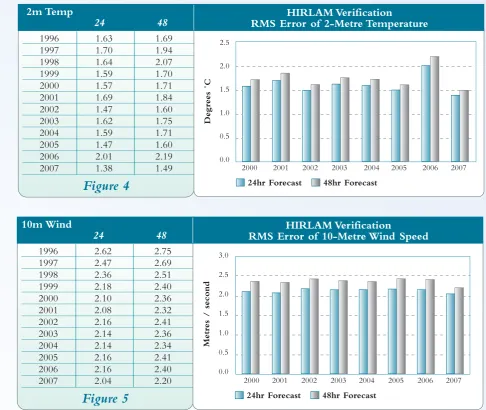
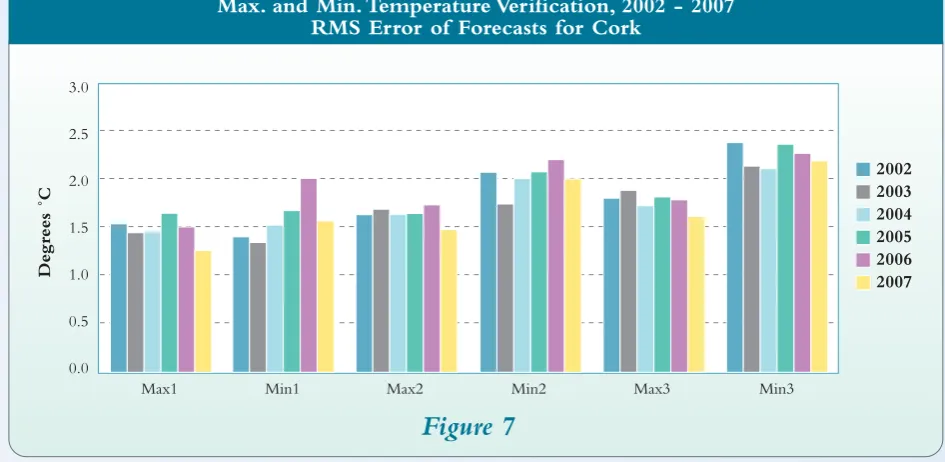
1 Forecast Accuracy
31
2 Publications
35
3 Met Éireann Finances
36
Corporate Information 37
Glossary 38
3 “Contributing to
Government Objectives” is part of the mission of any public service body, Met Éireann included. In practice, the operational nature of Met Éireann’s role tends to make our
connection with the Government’s current agenda somewhat
indistinct, but there are times when a more direct link can be apparent. Such an opportunity arose in 2007 when the new National Climate Change Strategy was developed and approved by the Government.The submission made by Met Éireann to this exercise was reflected in clear terms in the Strategy, including commitments to the continuation of the climate modelling activity of the Service, as well as to the maintenance of climate observations.The latter was a welcome acknowledgement of the crucial role played by the gathering of directly measured climate data in the study of climate change.
The C4I Climate Prediction Project came to the end of its four year term at the end of 2007, and its contribution to the understanding of climate change in Ireland has been increasingly
appreciated. In developing its skills in climate modelling, building upon its core skill of numerical weather prediction, Met Éireann has made a significant contribution to national capacity in the field of climate change studies.
As is always the case, technical innovation was a prominent feature of Met Éireann’s activities during the year. Following an intensive reviewing of tenders, a new Forecaster Workstation was ordered, based on software from IBLSoft.This system, when introduced into operational use in our two forecast offices, promises to be an enhanced tool for the forecasters and to pave the way towards greater efficiency in forecast
production. In relation to our observing station network, steady progress was made towards the automation of stations, by the setting up of additional facilities in some locations and by the installation of a new Automatic Weather Station at Gurteen Agricultural College.
A significant development for Met Éireann was the agreement signed with the Irish Centre for High-End Computing (ICHEC) for the
operational running of our short-range numerical weather prediction model, HIRLAM.This offers
a cost-effective way for Met Éireann to access a high performance system for this core task and to enable us to introduce more sophisticated models in the future.
For many people, 2007 will be remembered for the pattern of weather experienced during the year, the exceptionally warm and dry April, for example, and the wet and unsettled summer. It will be scant consolation to our citizens to learn that unsettled weather can have the effect of boosting Met Éireann revenues, resulting in record high commercial revenue in 2007!
International activity is always a feature of Met Éireann’s activities, and 2007 was marked by a number of international meetings that were held in Ireland. In July, for example, a meeting of the Met Alliance group, of which Met Éireann is a member, was held in Dublin to debate the future arrangements for meteorology in Europe under the Single European Sky directive.With developments such as combined airspace blocks under consideration in Europe, there are many uncertainties facing the meteorological service providers and Met Éireann is keen to plan for such developments insofar as possible.
A meeting of the Council of EUMETSAT was held in Ireland, in Cork in June.This was the first time that a meeting of the council one of the major European meteorological organisations was held in Ireland. EUMETSAT, the European Organisation for the Exploitation of
Meteorological Satellites, plays a crucial role in operational meteorology and it was an honour for Met Éireann to host a very successful meeting of this body in Ireland.
My thanks to all Met Éireann staff whose energy, knowledge and skill have made 2007 another successful year for us.
Declan Murphy Director
4
Mission Statement
“Our Mission is to monitor, analyse and predict Ireland’s weather and climate,
and to provide a range of high quality meteorological and related information
to our customers.”
Organisational Structure of Met Éireann (December 2007)
Director Declan Murphy
Assistant Director Operations and Administration
Séamus Ó Laoghóg
Assistant Director Scientific and Technical Support
Tom Sheridan
Aviation Services Dave Murphy
Climatology and Observations Liam Keegan
General Forecasting Michael Walsh
Information Technology Paul Halton
Administration and Training Liam Campbell
Research and Applications Ray McGrath
Commercial Joseph Bourke
Instrumentation and Environmental Monitoring
5
JANUARY 2007
Mild, wet and windy for most of month; becoming cooler and drier
Low pressure dominated Ireland’s weather during the first three weeks of the month, as some deep depressions passing to the northwest of the country brought very unsettled conditions. Gales were recorded on many days during this period, giving some damaging gusts, while the
predominantly southwesterly airstream kept temperatures well above normal for January.There was a change during the final third of the month to calmer but colder weather, as an anticyclone to the west of Ireland brought clearer conditions in a mainly northwesterly flow.
Mean air temperatures for the month as a whole were well above normal everywhere and were close to two degrees higher than normal at most stations. Despite being much warmer than normal, however, there were no long-term records of mean temperature broken this month, following a very mild January in both 2002 and 2005. Like the previous month, there was no air frost recorded at most coastal stations, while at the majority of inland stations there was a total of between 1 and 4 air frosts, compared with between 7 and 11 in an average January.
There was a wide variation in rainfall totals over the country, with heaviest falls recorded in northern and western areas. Percentage of normal rainfall values for the month varied between 49% at Rosslare and 145% at Malin Head; while it was the wettest January since 1995 at Malin Head, it was the driest since 2000 at Valentia Observatory. More than 20 wetdays (days with 1mm or more rainfall) were measured at stations in the north and west, with some rainfall in this area on each day during the period 1st to 23rd.
Sunshine totals were highest over the eastern half of the country. Many stations had their sunniest day of the month on the 25th, when values of around 8 hours were measured in places; Birr’s value of 7.7 hours on this day was its highest daily sunshine on record for January.
FEBRUARY 2007
Mild and mostly sunny; wet in south Despite a week of cold weather early in the month, February was mild overall with mean air temperatures over one degree above normal generally, continuing the pattern of warmer than normal weather during the winter months.
At most stations it was the warmest February since 2002. Air frost was widely recorded in the period 2nd to 7th, but was infrequent during the remainder of the month.There were between 8 and 11 air frosts during the month at inland stations, around normal for February, but no air frost was recorded at either Rosslare or Valentia Observatory.
February rainfall totals were above normal over the south of the country, but it was a relatively dry month in the north. Although little rain was recorded before the 7th of the month, the total number of wetdays (days with 1mm or more rainfall) was above normal everywhere; most stations had between 14 and 16 wetdays during the month compared with the normal range for February of 11 to 15, while 20 wetdays were recorded at Valentia Observatory. Much of the precipitation which fell in the period 7th to 10th was wintry, with widespread falls of sleet or snow on the 7th and 8th, followed by hail or snow showers.
Sunshine totals for the month were above normal except in parts of the southwest. Most stations had their sunniest days during the first week.
MARCH 2007
Mild for most of month but with frequent ground frost; sunny with rainfall near normal
The weather during most of March was mild, but there were also short colder spells with wintry showers of hail and snow. Clear conditions on many days brought sunshine totals for the month above normal, but also allowed frequent ground frost to develop, particularly at inland stations. Mean monthly air temperatures were above normal everywhere, especially in the west, but while mean maximum temperatures for the month were around a degree higher than normal everywhere, mean minimum values were below normal in the east and midlands.There was a total of between 19 and 26 ground frosts at most inland stations compared with between 12 and 14 in an average March; Kilkenny’s total of 26 ground frosts during the month was its highest for March since the station opened in 1957, while the mean minimum temperature there of 1.9°C was its lowest for March since 1987.
6
the month, with many stations recording their wettest day on either the 5th or 11th.There were between 11 and 19 wetdays during the month over most of the country (days with 1mm or more rainfall), close to normal for March, but only 8 wetdays were recorded at Rosslare.
It was a sunny month everywhere, with sunshine totals between 15% and 45% higher than normal generally.The period between the 24th and 31st was particularly sunny, especially over the western half of the country. Shannon Airport’s value of 11 hours on the 29th was the highest daily sunshine for March at the station since 1970.
APRIL 2007
Warmest and sunniest April on record; dry for most of month
High pressure centred near or over the country during almost all of April gave an exceptionally sunny, warm and dry month everywhere. Mean monthly air temperatures varied between 10°C and 11.5°C and were around three degrees higher than normal generally; this range of temperatures is more typical of that for an average May.
It was the warmest April on record almost everywhere, including the long-term stations of Birr, Malin Head and Dublin (Phoenix Park), where records began more than a century ago. The mean temperature at Phoenix Park of 11.2°C was a full degree higher than its previous highest mean April value of 10.2°C, recorded in both 1987 and 1865. Despite the very high monthly values, however, minimum temperatures fell sharply on several nights under clear skies and there were between 12 and 18 ground frosts recorded at inland stations, around a third more than normal for April.
Monthly rainfall totals were well below normal except in the northwest. Following mostly dry weather during the last week of March, some stations recorded no measureable rainfall until the 22nd of this month. It was the driest April on record at both Shannon Airport and Casement Aerodrome, while at many other stations it was the driest for between 10 and 27 years.There were only between 2 and 6 wetdays measured (days with 1mm or more rainfall), with almost all of the month’s rainfall recorded between the 21st and 25th. Soil moisture deficits increased
significantly during the month; the very dry conditions led to outbreaks of gorse fires in many parts of the country.
For the second successive April, sunshine totals were exceptionally high. It was the sunniest April
on record almost everywhere, with monthly totals around 50% higher than normal generally.
MAY 2007
Warm and sunny everywhere; drier than normal over most of the country
The exceptionally dry, warm and sunny weather of April continued into the early part of this month, but conditions became more unsettled after the first week. Rainfall totals for the month were below normal generally, however, while in common with the previous months of spring, it was sunnier and warmer than normal at all stations.
Mean air temperatures for May were around half a degree above normal in parts of the midlands, but were closer to two degrees higher than normal in the southeast. It was the warmest May for
between 6 and 9 years in many places. Daytime temperatures rose above 20°C in midland and western areas between the 1st and 4th, while the month’s warmest weather was recorded on the 17th, when maxima of over 25°C were measured in the south; Rosslare recorded 22.3°C on this day, the highest May value at the station since it opened in 1956. In contrast, Birr recorded an unusually late air frost on the 29th of the month, while there were between 9 and 13 ground frosts observed at inland stations, twice the average number for May.
Rainfall totals were between 60% and 90% of normal over most of Leinster and Munster, but totals were above normal in parts of the north and west.There were no very high daily falls, but over 50mm of rain was measured at Malin Head in the 5-day period from the 16th to the 20th. Between 10 and 17 wetdays were recorded during the month (days with 1mm or more rainfall), slightly fewer than normal for May.
Sunshine totals were high at all stations and it was the sunniest May generally for 6 or 7 years. Over ten hours of daily sunshine were widely recorded in the periods 1st to 4th, 19th to 21st and 27th to 29th.
JUNE 2007
Very wet in east and south; warmest and sunniest in west
7 wettest June since records began there in 1957,
with more than three times its average total recorded. Heavy daily falls, some in association with thunder, led to localised flooding on a number of days. Kilkenny’s fall of 31mm on the 15th was its highest on record for June, while Dublin (Phoenix Park)’s daily fall of 53mm on the 22nd included a 90-minute fall of 26mm during a thunderstorm. Mullingar recorded a 60-minute fall of 29mm on the 13th; such an event would be expected only once every 50 years. There were 10 wetdays during the month at Malin Head (days with 1mm or more rainfall), but the majority of stations recorded between 13 and 19 wetdays, compared with the normal range for June of between 11 and 14.
Mean monthly air temperatures varied between 13°C and 15°C and were around a degree higher than normal generally.The first half of the month was warm, especially in the west, but
temperatures were near or below normal throughout most of the second half. Daytime temperatures rose above 20°C each day in many midland and western areas during the period 5th to 12th; Belmullet’s mean temperature for the month of 14.6°C was its highest for June since records began there in 1956. In contrast, cold nights near the end of the month allowed ground frost to develop at Mullingar.
Sunshine totals were very variable across the country, with highest totals measured in the north and west; while it was the sunniest June at Malin Head since 1996, it was the dullest at several other stations for between 5 and 10 years.
JULY 2007
Another very wet month in east and south; mostly cool but sunny
After the very wet weather of most of June in the east and south of the country, rainfall totals for July were again exceptionally high in the same areas. Like the previous month, high pressure remained well to the south of the country, allowing an uninterrupted succession of
depressions with their associated frontal systems to move over Ireland until near the end of the month.These produced spells of rain or showers each day, with some locally heavy falls causing flooding, while there were severe thunderstorms and reports of tornadoes on a number of days. At least 1mm or rain was measured on each day at one or more stations in the period between June 11th and July 29th- a total of 49 days.
Summer rainfall totals so far (June and July) are more than 250% of normal over parts of Leinster;
Dublin (Phoenix Park) two-monthly total of 297mm is the highest for this period in its 170-year-old record.Totals for this month were more than three times the July normal in parts of Dublin and it was the wettest July for between 19 and 47 years in many places.There were between 14 and 25 wetdays recorded (days with 1mm or more rainfall) compared with the normal range for July of between 9 and 14. Mean air
temperatures overall were near or a little below normal generally and it was the first month since March 2006 that temperatures were not above the 1961-90 normals at all stations.
There was little variation in temperatures during the month; they were near or below normal throughout almost all of July, with daily maxima only very rarely rising above 20°C.
Despite the frequent spells of rain, sunshine totals were above normal everywhere and it was a very sunny month in coastal counties of the west and north. Malin Head’s total of 212 hours was its highest for July since 1955.The sunniest weather of the month was during the last three days.
AUGUST 2007
Like the preceding two summer months, rainfall totals for August were above normal over the eastern half of the country, with highest values relative to normal at stations in Leinster.The pattern of Atlantic frontal systems crossing the country, which dominated most of this summer’s weather, was broken during the final third of the month, however, when a large anticyclone became established west of Ireland, resulting in mostly dry conditions. It was the wettest August for between 6 and 10 years at a number of stations, but the number of raindays recorded during the month (days with 0.2mm or more rainfall) was in the normal range for August of between 13 and 20. Heavy falls associated with thunderstorms resulted in flooding in some places around mid-month.
8
with most stations measuring their highest daily values on either the 7th or 22nd.
SEPTEMBER 2007
Drier than normal everywhere; mainly warm and sunny
After the very wet weather of the summer months, rainfall totals for September were below normal everywhere. High pressure was the dominant influence throughout the first half of the month and again during the final week, bringing predominantly dry weather with lighter than normal winds. Rainfall totals were just over half of normal in many places, but at no station were they as low as the exceptionally dry September of 2002. Most of the month’s rainfall was recorded between the 16th and 24th, with some heavy falls in places on the 16th and 21st. The number of wetdays during the month (days with 1mm or more rainfall) varied between 6 and 12 in most places, around half of the normal number for September.
Although mean air temperatures for the month were above normal everywhere, by around half a degree generally, it was still the coolest September for between 5 and 13 years at most stations. As shown by the charts of daily temperatures on page 2, the first half of the month was warm, but both daytime and nightime values fell sharply during the second half, especially during the final week. Unusually for September, there was widespread ground frost on the 18th and in the period 26th to 27th; air and ground temperatures of -1.1°C and -6.6°C respectively at Birr on the 27th were the lowest on record for September at the station.
Sunshine totals were near normal in the east, but they were higher than normal generally, especially in the southwest; it was the sunniest September for between 5 and 11 years at a number of stations. Both Mullingar and Shannon Airport had their sunniest September day in over 50 years of record on the 7th.
OCTOBER 2007
Driest October in over 30 years in places; warm and mostly sunny
High pressure was the dominant influence over Ireland’s weather during October, giving mainly dry conditions with light winds.These winds were generally southerly in direction, bringing warm air over the country for much of the time. Short spells of wet weather gave heaviest falls in western and southwestern areas, but rainfall totals for the month were below normal everywhere. Less than half of the normal October rainfall was
recorded over the eastern half of the country and it was the driest October for between 35 and 38 years at a number of stations.The number of wetdays recorded during the month (days with 1mm or more rainfall) was also below normal everywhere: most stations had between 5 and 9 wetdays, but between 12 and 14 wetdays were measured at Atlantic coastal stations.
Mean air temperatures for the month were between one and two degrees higher than normal over most of the country.
Mean values of between 11°C and 13°C for October were similar to those of some recent years, but at Belmullet the mean air temperature of 13.1°C was the highest for October since records began there in 1956. Air frost was confined to the period 24th/25th, but most coastal stations recorded neither air nor ground frost during the month.
Sunshine totals were above normal almost everywhere, but it was a relatively dull month over south Munster.The sunniest period of the month was between the 4th and 6th; Rosslare’s value of 10.5 hours of sunshine on the 4th was its highest such value for October since the station opened in 1956.
NOVEMBER 2007
Very mild and dry; dull except in south
Like the previous two autumn months, most of November’s weather was dominated by areas of high pressure close to or over Ireland, giving mainly dry conditions with light winds.There were also short spells of wet and windy weather around mid-month and also during the last few days, while overall it was a cloudy month, especially in the north and east. Mean air temperatures for the month of between 8°C and 11°C were around two degrees higher than normal generally and close to three degrees above normal in places. It was the warmest November for between 5 and 13 years generally and the warmest on record at Belmullet, where observations commenced in 1956.The month began with exceptionally warm weather, and record high November maxima were recorded at both Kilkenny and Clones on the 1st.There were 2 or 3 air frosts recorded during the month at most inland stations, but none in coastal areas.
9 there were some heavy falls at other times.The
wettest days of the month were in the period 17th/18th.The number of wetdays (days with 1mm or more rainfall) during the month was well below normal for November; only between 9 and 12 wetdays were recorded generally, compared with the normal range of between 13 and 20.
Sunshine totals for the month were very variable across the country.While Cork Airport measured 12% more sunshine than normal, Malin Head’s total of only 15 hours represented just 33% of normal and was its lowest November total since sunshine measurements began there in 1915.
DECEMBER 2007
Mild, especially in the southwest; wetter but sunnier than normal generally
December began and ended with unsettled conditions, caused by depressions off the northwest coast, but high pressure near the country around the middle of the month brought mainly fair weather. Strong winds were recorded at most stations during the first week and again between the 26th and 29th, but the period around mid-month was relatively calm. Rainfall
totals were highest over the western half of the country, with heavy falls at times between the 1st and 9th, occasionally accompanied by thunder, and also between the 23rd and 28th. Little or no rain was measured at many stations between the 10th and 21st, however, and the total number of wetdays during the month (days with 1mm or more rainfall) was close to the normal range for December of between 13 and 20.
Most of the month was mild, especially the first week, but minimum temperatures fell close to or below normal between the 17th and 25th, bringing widespread ground frost.There was no air frost during the month in most coastal locations, while the total number of air frosts recorded at the majority of inland stations of between 4 and 6 was only around half of the normal number for December. An exception was Mullingar, where 10 air frosts were measured.
10
Summary of Weather in Ireland - 2007
County/ Station Co. Clare Shannon Airport Co. Cork Cork Airport Co. Donegal Malin Head Co. Dublin Dublin Airport Casement Aerodrome Co. Kerry Valentia Observatory Co. Kilkenny Kilkenny Co. Mayo Belmullet Knock Airport Co. Monaghan Clones Co. Offaly Birr Co. Westmeath Mullingar II Co. Wexford Rosslare Rainfall (mm) 921.5 1057.4 1071.6 761.0 811.3 1351.7 879.5 1140.6 1346.0 912.4 862.9 977.1 756.9 99 86 103 111 97 107 104 99 106 105 86 33.6 31.7 29.0 30.1 35.1 46.9 30.9 28.3 30.6 19.8 41.1 28.7 31.0 6 Dec 19 Feb 27 Oct 3 Jun 3 Jun 2 Jun 15 Jun 18 Nov 16 Sep 17 Nov 11 Aug 13 Jun 3 Jun 11.3 10.7 10.7 10.3 10.5 11.8 10.8 11.4 9.5 10.1 10.6 10.0 11.3 +1.2 +1.3 +1.4 +1.2 +1.4 +1.5 +1.5 +1.3 +1.3 +1.2 +1.2 25.0 23.5 20.5 22.8 23.2 23.3 25.2 25.1 23.5 25.9 25.6 24.0 22.3 -3.6 -1.5 -2.0 -4.8 -6.4 -0.5 -5.8 -2.5 -3.3 -6.5 -5.6 -6.2 0.4 4.02 4.47 4.02 4.27 3.98 3.98 4.19 4.15 3.65 3.71 3.75 3.99 4.91 100 86 103 101 111 97 107 104 99 106 106 85 14.8 14.8 15.6 14.6 15.2 15.4 14.7 15.2 15.6 14.0 14.8 15.1 15.2 7 Jun 30 Jul 6 Jun 9 Jun 29 May 4 Jun 7 Jun 4 Jun 4 Jun 1 May 7 Jun 29 May 6 Jun 207 200 235 189 190 233 189 253 260 217 209 213 153 2 3 11 5 5 1 -6 13 -13 7 2 23 24 1 33 5 10 25 31 40 0 18 5 28 6 9 18 -32 9 -6 2 3 9 10 3 -7 5 -31 83 16 25 17 18 -23 132 -61 67 145 71 72 70 35 127 70 39 33 27 102
Total % of
average Amount date(s)Most in a day Mean Total average% of Amount date(s)Most in a day different
from average
Extremes
highest lowest Rain Snow Air fr
ost
Hail Thunder Fog Gale gusts
Temperature (°C) Sunshine (Hours) No. of days with
Warmest year on record in places; sunnier
than normal everywhere and dry in south
Mean air temperatures for the year were more than one degree above normal for the 1961-90 period. This was despite a relatively cool summer, especially over the eastern half of the country. It was the warmest year on record at the long-term stations of Valentia Observatory and Malin Head, where comparable records began in 1892 and 1885 respectively. It was also the warmest year on record at Belmullet, Rosslare and Kilkenny, where records commenced in the mid-1950s, and the warmest since 1949 at Birr. April was the warmest on record at most stations, while the autumn months between September and November were also exceptionally warm. July was the only month when mean temperatures were below normal over most of the country. The highest temperatures were recorded relatively early in the year: during the period June 9th to 11th in many places and on May 17th near the south and southeast coasts. The lowest air and ground temperatures of the year at almost all stations were recorded during a spell of very cold weather between February 5th and 8th.11
Global Temperatures
The global annual temperature for combined land and ocean surfaces in 2007 was +0.55°C above the 20th century average, ranking 5th warmest in the period of record.The effect of continued presence of La Niña conditions on the December global surface temperature resulted in a slightly lower ranking for the year as a whole. Globally averaged land temperatures were 1.02°C while the ocean temperatures were 0.38°C above average, ranking as the warmest and ninth warmest, respectively.The land and ocean surface temperatures for the Northern and Southern Hemisphere ranked second and tenth warmest, respectively. As discussed in the Temperature Trends section below, seven of the eight warmest years on record have occurred since 2001, part of a rise in temperatures of more than 0.6°C since 1900.Within the past three decades, the rate of warming in global temperatures has been approximately three times greater than the century scale trend.
2007 began with a weak warm phase (El Niño) ENSO which had developed during late 2006, but immediately began its transition to a neutral phase during February 2007, persisting as a neutral phase until the boreal summer. During August, sea surface temperatures (SST) anomalies were cooler-than-average in the Niño 1+2 and 3 regions indicating the first signs of a developing cold event (La Niña). By October, La Niña conditions strengthened when SST anomalies continued to decrease in the Niño 3.4. By the end of December, moderate-strength La Niña conditions were present across the equatorial Pacific Ocean.This La Niña event is likely to
persist into early 2008, according to the latest information from NOAA’s Climate Prediction Center.
The 1901-2000 average combined land and ocean annual temperature is 13.9°C, the annually averaged land temperature for the same period is 8.5°C, and the long-term annually averaged sea surface temperature is 16.1°C.
Temperature Trends
During the past century, global surface temperatures have increased at a rate near 0.05°C/decade, but this trend has increased to a rate of approximately 0.15°C/decade during the past 25 to 30 years.There have been two sustained periods of warming, one beginning around 1910 and ending around 1945, and the most recent beginning about 1976.Temperatures during the latter period of warming have increased at a rate comparable to the rates of warming projected to occur during the next century with continued increases of
anthropogenic greenhouse gases.
Temperature measurements have also been made above the Earth’s surface over the past 50 to 60 years using balloon-borne instruments
(radiosondes) and for the past 29 years using satellites.These measurements support the analysis
Review of Global Weather 2007
Global Top 10 Warm Years Anomaly (°C) 2005 1998 2002 2003 2007 2006 2004 2001 1997 1995 0.60 0.58 0.56 0.56 0.55 0.54 0.53 0.49 0.46 0.40 January
-December Anomaly Rank
GLOBAL Land Ocean Land & Ocean NORTHERN HEMISPHERE Land Ocean Land & Ocean SOUTHERN HEMISPHERE Land Ocean Land & Ocean +1.02°C +0.38°C +0.55°C +1.19°C +0.42°C +0.71°C +0.50°C +0.35°C +0.37°C warmest 9th warmest 5th warmest warmest 7th warmest 2nd warmest 8th warmest 10th warmest 10th warmest 2005 (+0.97°C) 2003 (+0.48°C) 2005 (+0.60°C) 2005 (+1.03°C) 2005 (+0.54°C) 2005 (+0.72°C) 2005 (+0.82°C) 1998 (+0.50°C) 1998 (+0.53°C) Warmest
(or Next Warmest)
12
of trends and variability in the troposphere (surface to 10-16 km) and stratosphere (10-50 km above the earth’s surface).
The best source of upper air in-situ
measurements for studying global temperature trends above the surface is the Radiosonde Atmospheric Temperature Products for Assessing Climate (RATPAC) dataset.
Data collected and averaged between the 850-300 mb levels (approximately 5000 to 30,000 feet above the surface) indicate that 1958-2007 global temperature trends in the middle troposphere are similar to trends in surface temperature; 0.12°C/decade for surface and 0.15°C/decade for mid-troposphere. Since 1976, mid-troposphere temperatures have increased at a rate of 0.18°C/decade. For the
January-December 2007 period, global mid-troposphere temperatures were 0.45°C above the 1971-2000 mean and the 4th warmest.
Since 1979, NOAA’s polar orbiting satellite measurements have also been used to measure temperatures in the troposphere and stratosphere. Microwave Sounding Unit (MSU) data are analyzed for NOAA by the University of Alabama in Huntsville (UAH), Remote Sensing Systems (RSS, Santa Rosa, California) and the University of Washington (UW).These observations show that the global average temperature in the middle troposphere (the layer which is centered at an altitude of 2 to 6 miles, but which includes the lower stratosphere) has increased, though differing analysis techniques have yielded similar but different trends (see above right).
In all cases these trends are positive.The analysis performed by RSS reveals a trend of
0.12°C/decade while the UAH analysis reveals a much lower trend of 0.06°C/decade.When adjusted by University of Washington scientists to remove the stratospheric influences from the RSS and UAH mid-troposphere average, the trends increase to 0.18°C/decade and 0.13°C, respectively. (A journal article is available that describes the University of Washington
adjustments to remove the stratospheric influence from mid-troposphere averages.) Trends in these MSU time series are similar to the trend in global surface temperatures, which increased at a rate near 0.17°C/decade during the same 29-year period.
Global in Situ Anomalies and Trends
Surface and Mid-Troposphere (Jan-Dec)
Annual Temperature Anomalies: Middle Troposphere and Surface
Annual Temperature Anomalies: Middle Troposphere and Surface
RSS and UAH adjusted by U. Washington RATPAC Upper Air and Surface plot
MSU Upper Air and Surface Temperatures
13
While middle tropospheric temperatures reveal an increasing trend over the last three decades, stratospheric temperatures (14 to 22 km / 9 to 14 miles above the surface) have been below average since the warming effects from the 1991 Mt. Pinatubo eruption dissipated in 1993.The below average stratospheric temperatures are consistent with the depletion of ozone in the lower stratosphere and the effects of increasing greenhouse gas concentrations.The large temperature increase in 1982 was caused by the volcanic eruption of El Chichon, and the increase in 1991 was caused by the eruption of Mt. Pinatubo in the Philippines.
Regional Temperatures
Warmer-than-average temperatures occurred throughout the year in most land areas of the world, with the exception of cooler-than-average anomalies in the southern parts of South
America.The largest warmer-than-average
anomalies were present throughout high latitude regions of the Northern Hemisphere including much of North America, Europe, and Asia. Temperature anomalies in these regions ranged from 2-4°C above the 1961-1990 average.
The map, below left, is created using data from the Global Historical Climatology Network (GHCN), a network of more than 7,000 land surface observing stations.The map, above, is a product of a merged land surface and sea surface temperature anomaly analysis developed by Smith and Reynolds (2005).Temperature anomalies with respect to the 1961-1990 mean for land and ocean are analyzed separately and then merged to form the global analysis. Additional information on this product is available.
Notable temperature extremes in 2007 included a heat wave that affected a large portion of the United States throughout the month of August. The Central and Southeastern U.S. were particularly affected, with over 50 deaths attributed to soaring high temperatures.The anomalous warmth exacerbated drought conditions in the southeastern region and also contributed for 29 all-time record high maximum temperatures and 35 all-time record high
minimum temperatures.
Hot weather also enveloped much of the western and central parts of Russia as well as the
southeastern Europe during May and June-July, respectively. Moscow, Russia recorded its highest temperature in May since 1891 and this was the first time in 128 years that the Russian capital experienced sustained 30°C or higher
temperatures. Meanwhile in southeastern Europe, temperatures were well over 40°C in many areas prompting electricity demands to soar record
Annual Lower Stratospheric Temperature Anomolies
Globe, 1979-2007
Annual Global Stratospheric Temperatures
Temperature Anomolies Jan-Dec 2007 (with respect to a 1961-1990 base period
National Climatic Data Center/NESDIS/NOAA
Annual Land Surface Temperature Anomalies in degrees Celsius
Temperature Anomolies Jan-Dec 2007 (with respect to a 1961-1990 base period
National Climatic Data Center/NESDIS/NOAA
14
levels.The warm conditions contributed to over 130 fires and over 500 fatalities.
In South Africa, a cold front which affected much of the country led to 21 fatalities and 54 weather records during May 21-22. Most of the records were for lowest maximum and minimum daily temperatures. In Argentina, the last week of May experienced unseasonably cold temperatures which led to electricity and natural gas shortages. In April, a devastating cold wave affected much of the central Plains, Midwest, and the Southeast region of the contiguous U.S.Temperatures dipped well below freezing in many areas prompting nearly 1,240 broken daily minimum temperature records and producing significant crop damages.
Sea Ice Extent
According to the National Snow and Ice Data Center, the Northern Hemisphere sea ice extent, which is measured from passive microwave instruments onboard NOAA satellites, reached the least sea ice extent on record during the month of September with 4.28 million square kilometers (39 percent below the 1979-2000 mean).The anomalous warmth that covered much of the Northern Hemisphere during January-September 2007, contributed to the sea ice extent being well below the record set in 2005 by a remarkable 23%. For further information on Northern Hemisphere snow and ice conditions, please see the NSIDC News page, provided by the NOAA’s National Snow and Ice Data Center (NSIDC).
Arctic sea ice conditions are inherently variable from year to year in response to wind,
temperature and oceanic forcings. Quite often a
"low" ice year is followed by recovery the next year. But increasing surface temperatures in high latitudes have contributed to progressively more summer melt and less ice growth in the fall and winter.While natural variability is responsible for year-to-year variations in sea ice extent, three extreme minimum extent years along with evidence of thinning of the ice pack suggest that the sea ice system is experiencing changes which may not be solely related to natural variability.
As shown in the time series above, mean
Northern Hemisphere snow cover extent during the boreal winter (December 2006-February 2007) was below average. Much of this was due to anomalously warm conditions across Asia, Europe, Canada, and the northeast half of the U.S.The boreal winter 2007 snow cover extent over the Northern Hemisphere was the 8th lowest extent in the historical record. Mean Northern Hemisphere winter snow cover extent for the 1967-2007 period of record was 45.4 million square kilometers.
Arctic Sea Ice Extent (Area of ocean with at least 15% sea ice)
Northern Hemisphere Sea Ice Extent plot
Northern Hemisphere Snow Cover Extent Winter (Dec 2006 - Feb 2007)
Northern Hemisphere Snow Cover Extent for Winter 2007
North America Snow Cover Extent
Winter (Dec 2006 - Feb 2007)
15 Snow cover for the boreal winter 2007 across
North America was above average and was the 13th largest extent over the 41-year historical record.This was in part due to a series of snow and ice storms that struck the U.S. during the month of February. Average North America boreal winter snow cover extent is 17.0 million square kilometers for the 1967-2007 period of record.
Mean Northern Hemisphere snow cover extent during boreal spring (March-May) 2007 was below average. Much of this was due to
anomalously warm conditions across Asia, Europe, and most of the contiguous U.S. Spring 2007 snow cover extent on the Northern Hemisphere was the 3rd lowest extent on record. Mean Northern Hemisphere spring snow cover extent for the 1967-2007 period of record is 92.6 million square kilometers.
Snow cover for boreal spring across North America was below average, giving March-May 2007 a rank of 8th lowest extent on record. Mean North America boreal spring snow cover extent is 38.7 million square kilometers for the 1967-2007 period of record.
Data were provided by the Global Snow Laboratory, Rutgers University
Global Precipitation
Global precipitation in 2007 was above the 1961-1990 average. Precipitation throughout the year was variable in many areas. Regionally drier than average conditions were widespread across the southeastern and western contiguous U.S., northern India, the eastern coast of Brazil, the southern and eastern parts of Australia, and parts of eastern Asia. Meanwhile the central U.S. and parts of Europe and Asia experienced wetter than average conditions.
Northern Hemisphere Snow Cover Anonomalies
Spring (1967 - 2007)
Northern Hemisphere Snow Cover Extent for Spring 2007
North America Snow Cover Anonomalies
Spring (1967 - 2007)
Northern Hemisphere Snow Cover Extent for Spring 2007
Annual Global Precipition Anomalies (1900 - 2007)
Annual Global Precipitation Anomalies
Precipitation Anomalies Jan-Dec 2007 (with resepct to a 1961-1990 base period)
National Climatic Data Center/NESDIS/NOAA)
16
In Australia, a six-year drought affected the Murray-Darling Basin in April. It was described as the worst drought in the nation’s history. Precipitation in China was variable throughout the country with periods of heavy rain and in some areas extreme drought.The province of Gansu suffered its worst drought since 1940 during May.While in July, severe storms produced torrential rain that caused floods that affected nearly 500,000 people. In the province of Chongqing, a 24-hour rainfall record was broken when 227 mm (9 inches) of rain fell from July 16-17.
During January-February, heavy rain fell in Bolivia producing floods that affected nearly 200,000 people and 70,000 hectares (173,000 acres) of cropland. In early May, Uruguay was hit by the worst flooding since 1959 which affected more than 110,000 people and severely damaged crops and buildings.
In Costa Rica, heavy rain that fell during October 10-11 caused widespread floods that washed away over 800 homes and prompted a
deadly mudslide on the 11th.The mudslide, according to reports, is the worst weather disaster for Costa Rica in years, claiming 14 lives and burying hundreds of homes in the town of Atenas. In Nicaragua, the heavy rain affected 10,000 people and destroyed homes and crops. According to reports, 600 mm (24 inches) of rain fell in a period of four days.
In November torrential rain, which commenced in late October, fell over the state of Tabasco, Mexico causing devastating floods.The heavy rain triggered widespread floods, prompted deadly landslides, and caused rivers to flow over their banks, leading to the worst flooding in more than 5 decades. Approximately 80% of the state was under water, homes and crops were destroyed, and about half a million people were left homeless. On December 17, heavy rainfall triggered floods across southern Thailand which affected
In April 2007 the Irish Centre for High-End Computing (ICHEC) and Met Éireann embarked on a new scientific collaboration in the areas of weather forecasting and climate modelling. As part of this collaboration ICHEC provides computational facilities and support to Met Éireann to enable it to run its operational high-resolution forecast models on ICHEC’s flagship supercomputer,Walton.
Both partners contribute to the international HIRLAM (HIgh Resolution Limited Area Model) project dedicated to the development of a state-of-the-art numerical short-range weather forecasting system for operational use. In
particular, research efforts are currently targeted on the development of the next generation model: a non-hydrostatic mesoscale system that will resolve weather features on a kilometre scale over Ireland.The large computing facilities available through ICHEC greatly facilitate model development as extensive resources are required for a realistic testing and debugging of the complex code. ICHEC expertise is also
invaluable in optimising the performance of the model on distributed computer systems.This is a particularly important issue for a model that is run in an operational environment where there are tight deadlines for the generation of weather products; the complexity or level of detail that
the model can handle is usually configured to fit a fixed run-time.
The collaboration will also facilitate the expansion of Ireland’s involvement in climate research, particularly in the modelling area. Since 2003 Met Éireann, in collaboration with UCD, has been running the C4I (Community Climate Change Consortium for Ireland) project, using a regional climate model to dynamically downscale the outputs from global climate models to produce regional information on future climate change.The new collaboration will see the partners linking up with the EC-EARTH project, an international effort to develop a new European Earth System Model based on a global coupled atmosphere-ocean system, with dynamic vegetation, atmospheric chemistry, carbon cycle and ocean biogeochemistry components. Climate simulations with this model will be run at ICHEC.
ICHEC (see http://www.ichec.ie) is funded by Science Foundation Ireland (SFI) with
contributions from the Higher Education Authority (HEA) through the CosmoGrid project; it is hosted by the National University of Ireland, Galway. Further details regarding the C4I project are available at http://www.c4i.ie or through the Met Éireann website
(http://www.met.ie).
ICHEC / Met Éireann Collaboration
Signing of the ICEC / Met Éireann collaboration agreement. From left to right: Dennis Jennings (chairman ICHEC Oversight Board), Dr. J.-C. Desplat (ICHEC Director), Mr Declan Murphy (Met Éireann Director), and Prof. Iognáid Ó Muircheartaigh (NUI Galway President).
18
Brendan McWilliams
7 August 1944 to 22 October 2007
Brendan McWilliams was born into the world of meteorology. His father, Seán McWillams was one of the group of meteorologists recruited for the fledgling Irish Meteorological Service in 1939. Brendan was born in Dublin but grew up in Waterville, Co. Kerry as his father was Head of Valentia Observatory in nearby Cahirciveen.
On his graduation from University College, Cork Brendan chose to follow in his father’s footseps and joined the Meteorological Service in 1965. Following his training at Rosslare, he served for a period at Shannon Airport before moving to the Central Analysis and Forecast Office [CAFO] in 1975. He was a member of the team presenting the daily weather forecast on RTÉ television.
Brendan progressed to senior management in 1978 when he was appointed Head of the Dublin Airport office. He later became Head of
Administration & Training before being
appointed Assistant Director in 1990. Along the way, he had acquired an MBA from the National University, Dublin in 1987.
Brendan played a very active part in the work of international meteorological organisations and chaired many groups and committees, where his concensus-building ability and his
communications skills were much in evidence.
In 1998, Brendan took leave of absence from Met Éireann to take up the full-time post of Director of Administration of EUMETSAT in Darmstadt, Germany. He servied in this capacity until his retirement in 2004.
On completion of his MBA in 1987, Brendan’s drive and energy had led him to seek further outlets and he commenced writing the daily “Weather Eye” column in the Irish Times.This quickly became one of the most popular features of the newspaper. For the last year of his life he
made a weekly live contribution to “Today with Pat Kenny” on RTÉ’s Radio 1.
Mr McWilliams was a fellow of the Royal Meteorological Society (UK), an honorary life member of the Royal Dublin Society, and an honorary member of the Irish Meteorological Society.
Dr. Anthony (Tony) Hollingsworth
6 July 1943 to 29 July 2007
Dr. Anthony (Tony) Hollingsworth began his career working as a forecaster in the Irish Meteorological Service, now Met Éireann, from which he took leave to carry out Ph.D. studies at M.I.T. He returned to Europe to take up a research position in the UK Universities’
Atmospheric Modelling Group at the University of Reading. He joined ECMWF on 1st March 1975, and was, at the time of his passing, the Centre’s longest serving Staff Member. In his time with ECMWF he worked on virtually every aspect of numerical weather prediction, heading in turn the Physical Aspects Section and the Data and Model Divisions of the Research
Department. He was appointed Head of Research in 1991 and Deputy Director in 1995. He
stepped down from these latter positions on reaching his sixtieth birthday, but eschewed retirement to lead the Europe-wide GEMS environmental monitoring project, an activity he pursued with vision and dedication to the very end.
Tony was an important player also on a wider international stage, fostering extensive
19
Strategic Management - Delivering Met Éireann’s High-Level Goals
Progress in Achieving High-Level
Goals
Met Éireann’s Strategy Statement lists ten High-Level Goals which together describe the
organisation’s key objectives and strategies. Progress in achieving these Goals during 2007 is detailed below.
High-Level Goal 1:
To make available to the
general public of Ireland an excellent service of
high quality general weather forecasts, warnings
of hazardous weather and other information
helpful in the prevention or mitigation of
environmental disasters.
General Forecasting Division (GFD) continued to supply a wide range of forecast and warning services through its offices at Glasnevin and RTÉ, Donnybrook.
During the year a total of 487 Gale Warnings and 951 Small Craft Warnings were issued, along with additional specific warnings of particular weather conditions as outlined in the adjacent table.
There was a significant increase in the number of enquiries from the media and members of the public in relation to the very wet weather, particularly in the eastern part of the country, during the Summer months.
Customised weather services were delivered to energy utilities, the building industry, local authorities and several other business and commercial interests. In collaboration with the National Roads Authority, winter road
maintenance forecasts for over 50 sites were provided to local authorities nationwide.
The Telephone Consultancy Service continued to prove popular with many industrial and
commercial clients and strong demand continued for Weatherdial, Met Éireann’s premium-rate telephone weather service.
In association with RTÉ, some of GFD’s meteorologists presented weather forecasts from the BT Young Scientist Exhibition in the RDS in January and from the National Ploughing
Championships in Tullamore in September.
In October, Met Éireann hosted the Dublin meeting of Meteo Alarm (a consortium of European NMSs who upload severe weather warnings to a website for public access) - GFD staff were responsible for the smooth running of the meeting.
Two new chart plotters were purchased and installed in July and towards the end of the year, significant preparation had been made for the arrival of the new Forecaster Workstation, a significant addition to the operational tools available to the forecasting teams.
Numerical Weather Prediction
(NWP)
Collaboration with the HIRLAM (High-Resolution Limited Area Model)1community in
NWP research continues. Met Éireann’s contribution in recent years has focused on the treatment of the lateral boundary conditions used in the NWP model with the goal of formulating, in a mathematical sense, transparent boundaries that will improve the accuracy of the forecasts. This work is now coming to an end. A three day meeting was held in Dublin in October to formulate a plan for future research in this area; the meeting was attended by scientists from the Royal Meteorological Service of Belgium, and Météo France.
In collaboration with the Irish Centre for High-End Computing (ICHEC) research efforts are currently targeted on the development of the next generation model: a non-hydrostatic meso-scale system that will resolve weather features on a kilometre scale over Ireland.
In late May the HIRLAM Management Group visited Met Éireann to discuss Ireland’s
scientific contribution to the project and to gather feedback from the users of the operational products.
Specific Warnings Number issued
Frost / Low Temperature
Rain
Snow
Thunder
Wind
Blight Conditions
48
49
2
93
103
54
1HIRLAM, which began in 1985, is a cooperative project between the National Meteorological Services of the Nordic countries, Spain, the
20 14573 3068 7281 1534 1534 390 383 EINN 247 EIDW 343 EICK 212 EIME 251 EIKN 217 EISG 81 EIWF 65 Total 1416 168
Forecast / Products No.
No of short TAFs issued in 2007 No of long TAFs issued in 2007 No of LAFs issued in 2007 No of Low-Level Significant Weather Charts issued in 2007 No of tabular Wind Charts issued in 2007
No of SIGMETs issued No of Search and Rescue forecasts issued
No of Local Warnings issued
No of Wind Shear Warnings (included in local warnings total above)
Operational NWP Forecast System
In April ICHEC and Met Éireann embarked on a new scientific collaboration in the areas of
weather forecasting and climate modelling. As part of this collaboration ICHEC provides computational facilities and support to Met Éireann to enable it to run its operational high-resolution forecast models on ICHEC’s
supercomputers.This necessitated a complete overhaul of the NWP system. At the same time the NWP suite was updated to use the latest versions of the atmospheric and wave models and new components were introduced; the ROMS ocean model was added to produce guidance on storm surges in coastal areas and the atmospheric forecasts were refined, delivering new high-resolution forecasts on a 5 km horizontal grid over Ireland.
For forecasts in the range 3 to 7 days ahead, Met Éireann continues to rely primarily on guidance provided by the European Centre for Medium-Range Weather Forecasts (ECMWF).
High-Level Goal 2:
To fulfil the State’s
obligations to provide meteorological services to
aviation and to influence future developments in
this area in order to achieve the best long-term
result for the State and for the aviation sector.
Aviation Services Division (ASD) provides services to civil, military and general aviation, in accordance with the standards and
recommendations laid down by the International Civil Aviation Organisation, the requirements of the European Union and national procedures. ASD comprises the Central Aviation Office at Shannon Airport, where the Head of the Division is based, together with the Meteorological Offices at Dublin, Cork airports, Ireland West Airport Knock and at Casement Aerodrome.The Division is the focal point for liaison between Met Éireann and the Irish Aviation Authority, the airport authorities and the International Civil Aviation organisation and the Commission for
Aeronautical Meteorology of the World Meteorological Organisation. ASD staff also actively contribute to the work of cooperative organisations to ensure the best and most efficient service to users.
The ASD also provides forecast services for the regional airports of Donegal, Sligo, Galway, Kerry and Waterford.
All routine operations continued as normal throughout the year.Terminal Aerodrome
Forecasts (TAFs) were issued for Shannon, Dublin, Cork and Knock Airports and for
Casement Aerodrome. Local Aerodrome Warnings were provided for these sites and also for a number of regional airports. A total of 390 SIGMET messages were issued for the Shannon Flight Information Region, while 383 forecasts were provided to assist Search-and-Rescue operations. Self-briefing facilities were made available to pilots at Dublin, Cork and Shannon Airports.
The European Union’s Single European Sky (SES) policy aims to make air transport within Europe safer, more efficient and more cost effective. SES seeks to rationalise the organisation of European airspace, reducing the present
multiplicity of Flight Information Regions (FIRs) and ultimately creating a single unified airspace in Europe. SES also regulates the provision of services to aviation, including meteorological services.
A particular requirement of the SES regulations is that a meteorological service provider to
international civil aviation obtain and maintain an ISO 9001:2000 quality managements system.The ASD retained its certification in 2007 and, additionally, continued as the only certified meteorological service provider in Ireland.This certificate ensures that the Division complies with the requirements laid down by the SES legislative programme and that it provides its services in an efficient, open, transparent and
21
High-Level Goal 3:
To provide a
comprehensive range of climate services to all
sectors based on a high quality, up-to-date
national climate archive, and, in collaboration
with other centres of expertise, provide an
authoritative voice on future climate trends in
Ireland.
Throughout 2007 the Climatology and
Observations Division continued its main tasks of maintaining the National Climate Database, managing the observational station networks, operating the Climate Enquiries Office and analysing and commenting on the Irish climate.
The Climate Enquiries Office received approximately 5,250 telephone enquiries and 3,610 requests by email/fax/letter for
climatological information or reports. Almost 400 meteorologist reports were provided for
legal/insurance cases and expert witnesses attended in court as required.
The Monthly Weather Summary was produced promptly after the end of each month, giving a preliminary assessment of the month’s weather. The Monthly Weather Bulletin subsequently provided a more comprehensive description of weather conditions with commentary on
significant events, both in Ireland and worldwide.
The Division continued to maintain and collect data from 550 climatological and rainfall stations, assisted by co-operating agencies and private individuals.These data, along with data from Met Éireann’s own stations, were quality-controlled and made available in the climatological database. About half of the stations in the observing networks were visited by Met Éireann inspectors during 2007.
Work was completed on the production of rainfall depth-duration-frequencies as gridded datasets in support of the OPW Flood Studies Update.
Migration to a new database server was completed during the year.
High-Level Goal 4:
To maintain a high level
of expertise and involvement in specialised areas
such as agricultural, environmental and marine
meteorology and to use this expertise to provide
forecast guidance and decision support.
Agricultural and
Environmental Unit
During the year the Agricultural Meteorology Unit began work with the Department of Agriculture, Fisheries and Food on monitoring the risk of Blue Tongue Virus (BTV) in Ireland. The Unit developed a meteorological trajectory model to allow daily assessment of the risk of wind advection of BTV to Ireland from infected locations in Europe and Britain. 2007 also saw the commencement of collaboration with researchers at the Department of Botany in Trinity College, modelling the impact of climate change on farming in Ireland.This project utilises climate projections generated by the C4I project to forecast crop yields in a future climate. In January the Agmet Group, facilitated by Met Éireann, hosted ‘Making Science Work on the Farm - A Workshop on Decision Support Systems for Irish Agriculture’. In September the Unit again supported Met Éireann’s attendance at the National Ploughing Championship in
Tullamore, Co. Offaly; this provided an excellent opportunity for Met Éireann to highlight its services and to obtain feedback from customers.
Marine Unit
During 2007 the Marine Unit handled routine sea and shipping-related meteorological inquiries. The Unit continues to oversee the operational running of numerical wave and surge models which are used to provide forecast guidance on the sea state around Irish coastal areas and the Irish Sea.
During the second half of the year two important changes were made to the operational marine forecasting system: the wave model was upgraded to a more advanced version (ECWAM) and a new storm surge model (ROMS) was introduced. The changes enhance Met Éireann’s ability to predict the impact of severe weather in coastal areas.The new system was particularly effective in delivering timely warnings during two periods of exceptionally heavy seas in late November and early December.
New coastal visibility observations from
22
selection of lighthouses are now accessible in near real-time by forecasters.
During the year Met Éireann collaborated with the Marine Institute in the testing of a new Data Acquisition System using the Iridium network. The Marine Unit continues to monitor the quality of the data from the fixed buoy network, ensuring that problems are identified and resolved as quickly as possible; the data are an important input for the numerical and general forecasts covering Europe and the Atlantic and for monitoring long term changes in the marine climate.
Met Éireann continued its involvement in the EU-funded PRISM project, established to develop predictive models of the Irish Sea with supporting web-based tools suitable for use in planning and management decisions. A range of output data from the Met Éireann numerical forecast model are used to support PRISM.
In February Met Éireann advertised its marine activities at the 2007 Boat Show in Dublin; its stand attracted considerable interest from the public
Climate modelling - Community
Climate Change Consortium for
Ireland (C4I) Project
The climate modelling work intensified in 2007: new climate simulations were performed to expand the ensemble of simulations carried out for Ireland to quantify the uncertainty in climate predictions; an additional 150 year (1950-2099) simulation was performed for the European area in support of the international ENSEMBLES project of which Ireland is a partner; storm surge simulations (2 x 30 year periods) using an ocean model driven by downscaled atmospheric data were completed; a study of river catchment flooding was also completed; new studies were performed using the ensemble simulations to quantify the impacts of climate change on future energy demand for heating and the impact on upper level ozone. A high-resolution climate model is currently being used to produce a wind atlas for Ireland to support the wind energy community.
The first phase of this climate modelling work came to an end in December and preparations
were begun for a comprehensive report summarising the project findings.
Met Éireann became a partner in the EC-EARTH, an international project established to develop a new European Earth System Model based on a global coupled atmosphere-ocean system with dynamic vegetation, atmospheric chemistry, carbon cycle and ocean
biogeochemistry components. In December, Met Éireann and UCD jointly hosted a two day workshop meeting of the EC-EARTH group to discuss future research work.
In February, C4I gave a summary presentation to the Oireachtas Joint Committee on Environment and Local Government, debating ‘Climate Change in Ireland’.
High-Level Goal 5:
To undertake commercial
meteorological activity in a way that is consistent
with competition law and with Met Éireann’s
other mandates so as to reduce overall costs to
the exchequer.
Year Amount (€, 000)
1995 1996 1997 1998 1999 2000 2001 2002 2003 2004 2005 2006 2007
719 766 876 883 1,277 1,312 1,463 1,444 1,398 1,501 1,651 1,517 1,865
Annual Revenue 1996 - 2007
Year
1,500
1,000
500
0
1 2 3 4 5 6 7 8 9 10 11 12
Re
v
e
n
23 Met Éireann’s principal revenue-earning activities
continued to include premium-rate weather forecasts, services to TV and other media, provision of climatological data and reports, and supply of severe weather forecasts (including winter road maintenance) to the National Roads Authority and to local authorities. Revenues from these activities reached a new peak this year.
Customer service continued to benefit from the Customer Relationship Management (CRM) software system which provides instant access to key customer information, prioritises activities and tracks all customer-related communications. Operating in tandem with enhancements to Met Éireann’s accounting procedures, the CRM system enables customer requirements to be managed with improved timeliness and efficiency.
Throughout 2007 the Commercial Division maintained on-going liaison with all major customer groups and business partners. Marketing and promotional activities included attendance at a number of shows and exhibitions, most notably the Boat Show in January and the National Ploughing Championships in September.
Met Éireann staff at the National Ploughing Championship
High-Level Goal 6:
In association with Met
Éireann’s overall meteorological functions, carry
out an appropriate and relevant set of
environmental monitoring and geophysical
programmes.
Valentia Observatory
Four upper air radiosonde ascents per day to measure the vertical profile of meteorological elements were carried out at the Observatory,
along with hourly surface weather reports. Measurements of ultraviolet (UV) radiation and surface and total column ozone levels were performed, supplemented by weekly ozonesonde ascents. Upgrades to the telemetry and wind systems and upper air ground station were completed during 2007.
The Observatory participated in national and international monitoring programmes in
atmospheric chemistry, geomagnetics, seismology, and phenology.The upgrade of the geomagnetic facilities continued.The seismological facilities were upgraded in cooperation with the Dublin Institute of Advanced Studies (DIAS). A
lightening detection system was installed as part of the Met Office global network. A new aerosol optical depth monitoring programme
commenced in accordance with Global Atmospheric Watch (GAW) requirements.
Cooperation continued with NUI, Galway, in the area of atmospheric physics and chemistry, following up on the 2005 GAW review. Participation commenced in a new, three year Environmental Research Centre (ERC) project to analyse ozone levels over Ireland.
Laboratory
Analysis of the chemical composition of air and precipitation samples from selected synoptic stations, primarily Valentia Observatory, continued. Analysis of samples from five Environmental Protection agency (EPA) sites continued, as part of an ERTDI project to monitor air quality and acidification linked to transboundary pollution. Analysis of air samples from Mace Head commenced in accordance with GAW requirements.Tests associated with the extension of the range of the atmospheric chemistry programme, in accordance with the requirements of EMEP, GAW commenced.
High-Level Goal 7:
Maintain and enhance a
technical infrastructure for Met Éireann that
supports the production of its outputs.
Instrumentation
Synoptic Network
24
local weather conditions, comprises a mix of manned and automatic stations. A full programme of observations, 24 hours a day, was maintained throughout the year.
An additional automatic weather station (AWS) was installed in 2007 in the unified climatological and synoptic observations network (TUCSON). This station included intelligent sensors capable of monitoring visibility, weather or cloud conditions (ICAPS).The station was located at Gurteen Agricultural College, Co.Tipperary and will be commissioned early in the New Year.This brings the number of AWSs in this new automated network to 14. In addition, three existing TUCSON AWS sites were ICAPS enabled. Preparation for the installation of a AWS at Johnstown Castle was completed. Planning for the installation of a new AWS to be installed at Malin head in 2008 was completed.
The Met Éireann observational networks are supported by calibration, maintenance and repair programmes. A new facility for calibrating humidity sensors over their full operational range was installed during 2007.
Airports
The new type of ceilometer was deployed at both Cork and Knock airports.The upgrade of the wind sensing system at Casement aerodrome commenced and will be completed early in the New Year.The telemetry system at Dublin airport was moved to a new enclosure and upgraded.
Meteorological Radar and Satellite Receiving Systems
Met Éireann operates two networked weather surveillance radars, located at Dublin and
Shannon Airports. Ground station facilities for the reception of data from meteorological satellites are also maintained.These continue to be upgraded to handle the additional types of information becoming available from the new geostationary and polar orbiting satellites.
Information and Communications
Technology
Actual IT-related expenditure for 2007 amounted to an overall total of €1,042,782.44 .
A number of planned projects were deferred due to staffing difficulties or to disruption arising from refurbishment work in HQ.
Among the significant developments were
;-• New project area: New project, entitled “Migration to Table Driven Code Formats [MTDCF]”, did not incur capital expenditure in 2007 as the project implementation was postponed to 2009.
• Existing Project:The Forecaster Workstation (FWS) project incurred capital expenditure of €23,171.50 on hardware in 2007. Software expenditure for the project will be for €175k (incl VAT) in 2008.
• Replacements/Enhancements had a saving of €182k as some postponed due to staff shortages and difficulties arising from the refurbishment of 2nd Floor at HQ during 2007.
• ICT Maintenance costs reduced significantly mainly due to the cancellation of a H/W and S/W maintenance contract with IBM for the RS-6000 SP supercomputer that was taken out of service when the routine operational running of the NWP suite was outsourced to the Irish Centre for High-End Computing (ICHEC) from the start of 2007.
Normal ICT Operational Support
and Maintenance Activities
During 2007 IT staff enhanced and supported a wide range of computer systems and applications. Family friendly working arrangements,
particularly term time leave, impacted the working arrangements for some staff.Two IT Division staff resigned from Met Éireann after undergoing induction training and there were long delays in filling the consequential vacant IT posts in the applications development area.
1. Normal operational output were successfully supported and maintained throughout the reporting period despite the shortage of staff in attendance during the summer period in particular.