Multi-Layer Bayesian Based Intrusion Detection
System
Hesham Altwaijry, Saeed Algarny
Abstract—In this paper a multi-layer Bayesian based intru-sion detection system is developed. The system is trained a pri-ori using a subset of the KDD dataset. The trained classifier is then tested using a larger subset of KDD dataset. The Bayesian classifier was able to detect intrusion with detection rate that is superior to most published results.
Index Terms- Intrusion Detection – Bayesian Filter – KDD Dataset
I. INTRODUCTION
Network attacks have increased in number and severity over the past few years, and therefore Intrusion Detection Systems (IDSs) have become a necessary addition to the security infrastructure of most organizations. Intrusion De-tection Systems automate the monitoring and analysis of network traffic with the goal of capturing and detecting se-curity problems. These systems are either software, hard-ware of a combination [1] [2].
The Deployment of highly effective IDS systems is ex-tremely challenging. For example until an IDS is properly tuned to a specific environment, there will be thousands of alerts generated daily, with most of these alerts being incor-rect and thus are false alerts. However, it is not obvious whether the alert is positive or negative until after they have been investigated thereby creating a large burden on the IT department. There have been many techniques proposed to lessen these false alerts and improve the performance of the system. Agarwal and Joshi [3] used a two-stage general-to specific framework for learning a rule-based model (PNrule). This model can classify models of a data set that has widely different class distributions in the training data set. Levin [4] used a data-mining tool for classification of data and predic-tion of new cases using automatically generated decision trees. In this paper will show that the use of multi-stage Bayesian probability is very promising in reducing the false positive alert rate.
Bayesian probability is an interpretation of the probability calculus which holds that the concept of a probability can be defined as the degree to which a person (or community) believes that proposition is true. Currently Bayesian theory is used in email spam-filters [5] [6] [7], Speech recognition [8], Pattern Recognition [9], and Intrusion Detection [10]. [11] [12]
II.BAYESIAN THEORY
Bayesian theory is named after Thomas Bayes (1702-1761), his theory can be explained as follows:
If the events A1,A2,……and An constitute a partition of the sample space S such that P(Ak)≠0 for k=1,2,….,n, then for any event B such that P(B)≠0 :
In recent years Bayesian networks have been used across a wide range of fields in computer science [13] because of their ability to obtain a coherent result from probabilistic information about a situation. Additionally there are many efficient algorithms that can be used to derive the results from the information. We have previously used this ability to construct
II. KDD-99 DATASET
To test our IDS system we used the DARPA KDD99 In-trusion Detection Evaluation dataset [14]. This dataset was
created by Lincoln Laboratory at MIT and was used in The Third International Knowledge Discovery and Data Mining Tools Competition, which was held in conjunction with KDD-99 The Fifth International Conference on Knowledge Discovery and Data Mining [14]. This dataset is one of the
most realistic publicly available sets that include actual at-tacks [15]. Therefore, researchers have been using this data-set to design and evaluate their intrusion detection systems. An added benefit is that a common dataset allows research-ers to compare experimental results. The data set was ac-quired from nine weeks tcpdump data. It is made up of a
large number of network traffic activities including both normal and malicious connections. The KDD99 data set
includes three independent sets; “whole KDD”, “10% KDD”, and “corrected KDD”. In our experiments we have used the “10% KDD” and the “corrected KDD” as our train-ing and testtrain-ing set, respectively. Table I summarizes the number of samples in each dataset:
TABLE I:BASIC CHARACTERISTICS OF THE KDD99INTRUSION DETECTION DATASETS IN TERMS OF NUMBER OF SAMPLES
Dataset Normal DoS Prob-ing R2L U2 R Total Whl KDD 972,78
0 3,883,370 41,102 1,126 52 4,898,430
10%KD D
97,278 391,458 4,107 1,126 52 494,020
KDD corr
60,593 229,853 4,166 16,18 9
228 311,029
The training set contains a total of 22 training attack types. Additionally the “corrected KDD” testing set includes an additional 17 attack types. Therefore there are 39 attack types that are included in the testing set and these attacks can be classified into one of the four main classes;
) ( ) | ( ) ( ) | ( ) ( ) | ( ) ( ) ( ) ( ) | ( 1 B P A B P A P A B P A P A B P A P B P B A P B A
P i i
n k k k i i i
i
Manuscript received July 26, 2011; revised August 10, 2011
DOS: Denial of Service attacks.
Probe: another attack type sometimes called Prob-ing.
U2R: User to Root attacks. R2L: Remote to Local attacks.
DoS and Probe attacks are different from the normal traffic data and can be easily separated from normal activi-ties. They come in a greater frequency in a short period of time. On the other hand, U2R and R2L attacks are embed-ded in the data portions of the packets and normally involve only a single connection. Therefore these types of attacks are harder to identify and it is difficult to achieve satisfacto-ry detection accuracy for these two attacks. [16]
The KDD-99 network TCP connections have 41-features per connection (record). These features can be divided into four categories [17]:
Basis features: Features 1-9 are the basic features that are derived from packet header without inspecting the payload. Content features: Domain knowledge is used to assess the payload of the original TCP packets. This includes features such as the number of failed login attempts.
Time-based traffic features: These are features that capture properties that mature over a 2-s temporal window. An ex-ample is the number of connections to the same host over the 2-s interval.
Host-based traffic features: These features utilize a histor-ical window estimated over the number of connection in-stead of time. They are designed to assess attacks, which span intervals longer than 2s.
III.BAYESIAN FILTER
The Bayesian IDS is built out of a naïve Bayesian classifier. This classifier is anomaly based. It works by recognizing that feature values have different probabilities of occurring in attacks and in normal TCP traffic. The filter is trained by giving it preclassified traffic. It will then adjust the probabil-ities for each feature. After training, the filter will calculate the probabilities for each TCP connection and classify it as either normal TCP traffic or an attack. Therefore our Baye-sian filter consists of the following two components:
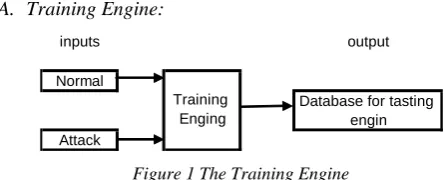
[image:2.595.48.272.520.610.2]A. Training Engine:
Figure 1 The Training Engine
Figure 1 shows the block diagram for the Bayesian filter that is constructed for the IDS system. For each input record there is a label describing the type of connection. We use this label to train the engine as follows:
First the numbers of good records and bad records in the training dataset are calculated.
Then two hash tables are created; the first one includes the frequency of each attribute for normal records, and the second one includes the frequency of each attribute for the not normal records.
Finally, a third hash table is created. This table contains each attribute from the normal and not normal records and it is scored using the following formula
_ _
_ _ _ _
Where:
B is the frequency of that attribute in the hash table re-lated to not-normal file.
G the frequency of that attribute in the hash table re-lated to normal file.
B. Testing Engine:
After training the engine is tested by loading the KDD cor-rected dataset. The following formula is applied to obtain a probability of whether the record is normal or not:
∏
∏ ∏ 1
Where:
n: number of attributes that we need to use to test the required record
score(i): the score of the attribute
The record is considered to be an attack if the P(record) is greater than a specified threshold.
IV.EXPERIMENTAL SETUP
Experiments differ basically in the training data used to build the database, which accordingly affects the accuracy of the test. Additionally, the number of features and level of threshold used in the testing engine makes a big difference in the results. Therefore, all experiments presented differ due to manipulation of the following inputs: training data, features and threshold.
A. Training data:
Using the 10% KDD data set we have 494,020 records that can be used to train the training engine. These training records consist of normal (non attack) records and known attack records distributed among the four attacks types: DoS, Probe, U2R and R2L. In all the experiments that we will present we will use the normal records (non attack), adding to them the appropriate not-normal (attack) records.
B. Features
Since the data record consists of 41 features, we can se-lect between them and perform a very large number of com-binations. We have selected the features as follows:
1) Using specific features like basic (features 1- to 9), con-tent (features 10-22) and traffic features (23 to 31) 2) Using all the 41 features.
3) Using selected features by inspecting the score map. The initial experiments performed showed that the first method does not yield good results compared to the second method. However, selecting key features leads to better re-sults. The features are selected by analyzing the score map that was built by the training engine to see the highest value that can result in a score that is above the threshold so that the detection rate maybe increased. Among the many fea-tures and after many experiments, we ended up with three features that raised the detection rate of R2L attack to 85% as will be explained in experiment 5.
C. Threshold
This is the level that we used to distinguish between normal records and attacks. The threshold value was ad-justed between the experiments to increase the detection rate.
inputs output
Normal
Database for tasting engin Attack
After performing each experiment, we analyzed the re-sults based upon the number of normal and not-normal records that the testing engine succeeded or failed in classi-fying. We use the following expressions to analyze the data: True Negative (TN): The percentage of valid records that are correctly classified.
True Positive (TP): The percentage of attack records that are correctly classified.
False Positive (FP): The percentage of records that were incorrectly classified as attacks whereas in fact they are va-lid activities.
False Negative (FN): The percentage of records that were incorrectly classified as valid activities whereas in fact they are attacks.
V. RESULTS
The results obtained using a single Bayesian filter were presented in [18]. by using Bayesian filters are comparable to what has been summarized in Chou’s PhD thesis [17] where he reported the results of most algorithms. However, Bayesian filters were able to achieve superior results for in detecting U2R and R2L attacks.
TABLE IIDETECTION RATE FOR VARIOUS ALGORITHMS [17]
Algorithm DOS Probe U2R R2l
KDD cup winner 97.10 83.30 12.30 8.40 SOM map 95.10 64.30 22.90 11.30
Gaussian Classifier 82.40 90.20 22.80 9.60
K-means Clustering 97.30 87.60 29.80 6.40
Nearest Clustering 97.10 88.80 2.20 3.40 Radial Basis 73.00 93.20 6.10 5.90 C4.5 Decision Tree 97.00 80.80 1.8 4.6
PN-rule 6.60 10.70
Linear GP 96.70 85.70 1.30 9.30
Online k-means 69.81 99.62 49.45 6.48
SVM 99.90 67.31 0.00 29.09
KMO+SVM 75.76 99.61 49.45 22.24
Backpropagation 97.23 96.63 87.71 30.97
A. Improved Bayesian Filter
To improve the performance of the IDS system for the U2R and R2L attacks we implemented multiple Bayesian filter layer. This section will describe the promising results that we achieved.
A.1 Improved Bayesian Filter 1 (IBF1):
[image:3.595.308.534.59.229.2]Although the testing engine classifies its inputs records to normal and attacks, its accuracy varies according to the records that are incorrectly classified (FN and FP). And since the FP percentages were very low for Bayesian filters with values less than 1%, we suggested an improved Baye-sian Filter. The Improved BayeBaye-sian Filter will trust the test-ing engine for its classification to attacks records, however the normal records that classified by the engine will enter the engine again to be filtered. The process can be repeated many times seeking higher accuracy. The improved Baye-sian filter is illustrated in figure 2 where we have nested loop of testing engines where each one use its precedents normal output as an input. On the other hand the attack records are collected from each engine.
Figure 2: Improved Bayesian Filter 1
However, each engine should use a different setup to be able to catch more attacks otherwise nothing will be changed. The settings that can be changed are the threshold and most important is the features' selections. By in depth study of the records' behavior, appropriate features can be selected to increase the accuracy.
A.2 Improved Bayesian Filter 2(IBF2):
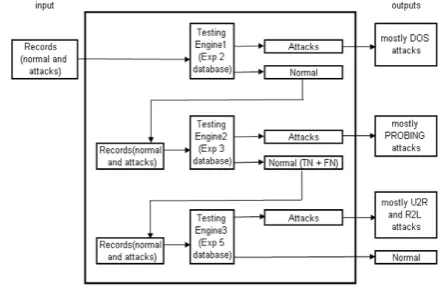
We have noticed that the accuracy of each filter and the DR varies based on the database used each time. Moreover, mostly the attack type that is used to train the filter could score the best accuracy We, therefore, we suggest using multilayer engines with different databases for each layer as illustrated in figure 3.
This filter is optimized as follows:
Testing Engine 1: this engine will use the database opti-mized to detect DOS attacks. Therefore, it will have the best results in detecting DOS attacks type. The output of this engine that is classified as normal will be sent as inputs to testing engine 2 for more filtration.
Testing Engine 2: this engine will use the database opti-mized for PROBING attack type. The output of this engine that classified as normal will be sent as inputs to testing en-gine 3 for more filtration.
Figure 3:Improved Bayesian Filter 2
[image:3.595.59.277.364.497.2] [image:3.595.318.541.527.675.2]This 3-layer improved Bayesian filter can detect the four attacks types with high DR. However, the FP percentage reaches 31.97% considered as a weakness in this filter.
A.3 Improved Bayesian Filter 3(IBF3):
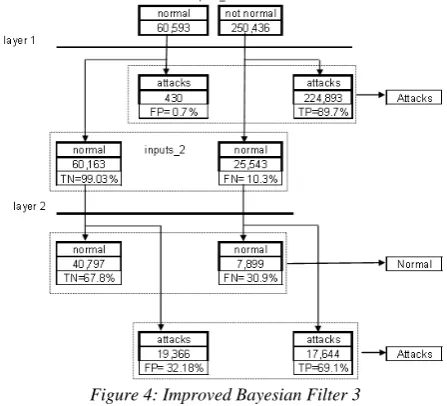
Using the ideas that were explained in IBF1 and IBF2, we conducted many experiments. We got the best results so far by using two layers filter (figure 4). The first layer used all attack records and the second layer used the R2L attacks records in addition to the normal traffic.
The Training Engine (layer 1): the training data was all the records available for training which classified as normal (92,827 records) and attacks or not normal (401,195 records).
The Testing Engine (layer 1): the setting used for the training engine was: threshold = 0.9 and all features used to build the score map for the training engine. The data that was tested are normal (60,593 records) and attacks or not normal (250,436 records.)
The results (layer 1) : they are classified into four cate-gories as follows:
TN: 60,163 normal records classified successfully with 99.3% as normal records.
TP:224,893 attack records classified successfully with 90% as attacks records.
FP: 430 normal records classified by mistake with 0.7% as attacks records.
FN: 25,543 attack records classified by mistake with 10% as normal attacks.
Therefore the DR = 90% and the CR = 94.65%
Although we achieved good results in general and espe-cially to detect attacks with very low of FP, we wanted bet-ter results to improve DR and to reduce the FN. Therefore, we will trust the first filter (layer 1) when it classified records as attacks since it gave excellent results with just 0.7% FP. However, the normal records that classified by layer 1's filter, need more filtration. Thus, we will add another filter as follows:
The Training Engine (layer 2): the training data was normal (92,827 records) and R2L attacks (1,126 records).
The Testing Engine (layer 2): the setting used for the training engine was: threshold = 0.6 and features 23,24,31 to build the score map for the training engine. The data that was tested are the data that was classified by filter 1 as nor-mal data. However, these data contains (60,163 nornor-mal records) and (25,543 attacks records). The question might be raised: why did we select R2L attacks to train the engine? And the answer is simply because by analysing the attacks' types, we found that R2L attacks were 63% of the attacks found while DOS, Probing and U2R were 29%, 7% and 0.9% respectively. Thus, we chose the attack type that has majority among the attacks.
The results (layer 2) : they are classified to four catego-ries as follows:
TN: 40,797 normal records classified successfully with 67.8% as normal records.
TP:17,644 attack records classified successfully with 69% as attacks records.
FP: 19,366 normal records classified by mistake with 32.18% as attacks records.
FN: 7,899 attack records classified by mistake with
The DR = 69% and the CR = 68.4%
However, since the IBF3 contains both layers, we will have an overall results as follows:
TN: 40,797 normal records classified successfully with 67.8% as normal records.
TP:17,644 + 224,893 = 242,537 attack records classified successfully with 96.85% as attacks records calculated as 242,537/ 250,436.
FP: 19,366 + 430 = 19,796 normal records classified by mistake with 32.67% as attacks records calculated as 19,796 / 60,593 .
FN: 7,899 attack records classified by mistake with 3.15% as normal attacks calculated as 7,899 / 250,436.
The overall DR = 96.85% and the overall CR = 82.1%
[image:4.595.321.545.297.500.2]These results are the best results comparing to all the ex-periments that we conducted for all data. Moreover, this experiment is considered much realistic and practical since the data came to the filter not classified as normal nor at-tacks but as raw data and the filter should classify them ac-cording to its setup and database.
Figure 4: Improved Bayesian Filter 3
VI.CONCLUSIONS
We have shown that using multiple Bayesian filters in series with each filter optimized for a specific attack type achieves results that are better than what can be achieved by a single filter. Moreover, using a two optimized Bayesian filters we were able to achieve an overall DR = 96.85. We believe that having multiple Bayesian filters in series will allow us to detect attacks with a high degree of confidence.
REFERENCES
[1] T. Crothers, Implementing Intrusion Detection Systems: A Hands-On Guide for Securing the Network, Wiley, 2003.
[2] R. Bace and P. Mell, NIST Special Publication on Intrusion Detection Systems, National Institute of Standards and Technology, 2001.
Explorations, vol. I, no. 2, pp. 67-75., January 2000.
[5] P. Grapham, Hackers and Painters: Big Ideas from the Computer Age, O'Reilly, 2004.
[6] B. Issac, W. Jap and J. Sutanto, "Improved Bayesian Anti-Spam Filter Implementation and Analysis on Independent Spam Corpuses," in International Conference on Computer Engineering and Technology, ICCET, Singapore , 2009.
[7] Y. Alkabani, M. El-Kharashi and H. Bedor,
"Hardware/Software Partitioning of a Bayesian Spam Filter via Hardware Profiling," in IEEE International Symposium on Industrial Electronics, Montreal,
Canada, 2006.
[8] J.-T. Chien, C.-H. Huang, K. Shinoda and S. Furui, "Towards Optimal Bayes Decision for Speech Recognition," in IEEE International Conference on Acoustics, Speech and Signal Processing, ICASSP,
Toulouse, 2006.
[9] X. Shi and R. Manduchi, "A Study on Bayes Feature Fusion for Image Classification," in Conference on Computer Vision and Pattern Recognition Workshop, CVPRW, Madison, Wisconsin, USA , June 2003 .
[10] C. Kruegel, D. Mutz, W. Robertson and F. Valeur, "Bayesian Event Classification for Intrusion Detection," in 19th Annual Computer Security Applications Conference (ACSAC), IEEE Computer Society, Las Vegas, NV, USA, 2003.
[11] A. Cemerlic, L. Yang and J. Kizza, "Network Intrusion Detection Based on Bayesian Networks," in
Proceedings of the Twentieth International
Conference on SOftware Engineering and Knowledge Engineering (SEKE'2008), San Francisco, CA, USA,
2008.
[12] M. Mehdi, A. Zair, A. Anou and M. Bensebti, "A Bayesian Networks in Intrusion Detection Systems,"
Journal of Computer Science, vol. 3, no. 5, pp.
259-265, 2007.
[13] A. Darwiche, "Bayesian Networks," Communications of the ACM, vol. 53, no. 12, pp. 80-90, December
2010.
[14] KDD Cup 1999 Data [Online]. Available:
http://kdd.ics.uci.edu/databases/kddcup99/kddcup99. html.
[15] U. Aickelin, J. Twycross and T. Hesketh-Roberts, "Rule Generalization in Intrusion Detection Systems Using SNORT," International Journal of Electronic Security and Digital Forensics, vol. 1, no. 1, pp.
101-116, May 2007.
[16] W. Lee, S. S.J. and K. Mok, "A data mining framework for building intrusion detection models," in Proceedings of the 1999 IEEE Symposium on Security and Privacy, Oakland, CA, USA, 1999.
[17] T. S. Chou, Ensemble fuzzy belief intrusion detection design, Florida International University, Paper AAI3299199. , 2007.