20th International Conference on Structural Mechanics in Reactor Technology (SMiRT 20) Espoo, Finland, August 9-14, 2009 SMiRT 20-Division V, Paper 2474
Reactor Head Stand Evaluation
Using Simplified Non-Linear Analysis
Taha D. Al-Shawaf
a, Lingyah Yen
a, and Kristin Murray Zaitz
ba
Material and Structural Analysis, AREVA NP Inc., Naperville, IL, USA,
b
Design Engineer, Pacific Gas & Electric Co., Diablo Canyon Power Plant, CA, USA, e-mail: [email protected]
Keywords: Non-Linear, Seismic Response, Inelastic Response Spectra, Decoupling, Reactor Head Stand.
1
ABSTRACT
Several analysis techniques are presented to increase the design margins in order to qualify an existing structure without the need for structural modifications. These methods include developing higher damping seismic response spectra, inelastic spectra generation, decoupling of linear systems, simplified non-linear modeling and the use of the 100-40-40 combination method.
2
INTRODUCTION
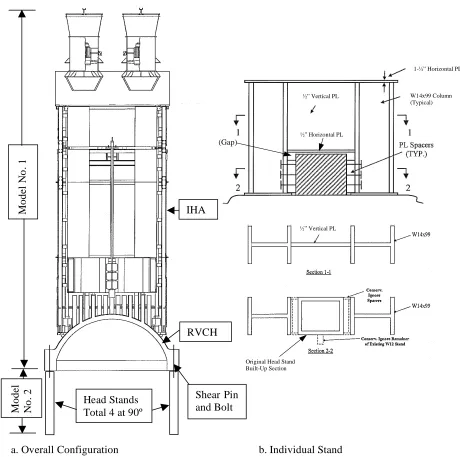
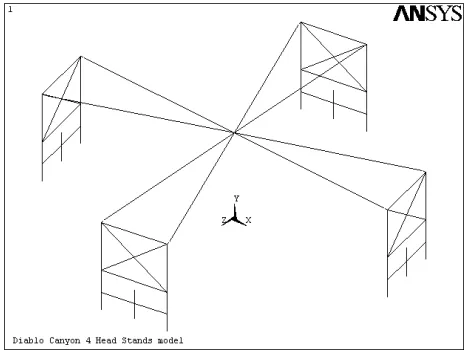
Diablo Canyon Power Plant intends to replace the existing Reactor Vessel Closure Head (RVCH) with a new RVCH and Integrated Head Assembly (IHA) that is heavier than the existing configuration. During refueling, the new combined RVCH and IHA structure is stored on a structure composed of four individual stands, 90 degrees apart (Figure 1). Since the head stands are only loaded during refueling outages, they are not considered to be safety-related structures. The Diablo Canyon design criteria allow such systems to have inelastic deformation under a seismic event if the behavior does not adversely impact any safety related structures, systems or components.
Previously, each stand had been modified to raise the elevation of the stored reactor head in order to allow for access to the bottom of the reactor head. The modification is composed of steel members that are welded to each other creating portal frames that are bolted to each of the original short storage stand legs. The original storage stand legs are welded to concrete embedment plates. The portal frames are not attached to the concrete slab and only act in bearing. The RVCH rests on the top of stand and is connected to the stand through (a) shear pins to resist horizontal forces and (b) bolts to resist vertical uplift. The total weight of the new RVCH and IHA is approximately 368 kips (1637 kN) which is a 12% increase from 328 kips (1459 kN) of the original assembly. The available design margin in the existing analysis is only 8%, and therefore, conservatisms in the existing evaluation must be reduced. This paper describes the methods implemented to qualify the existing stands without the need for structural modifications.
3
APPROACH
One of the conservatisms in the existing seismic evaluation was the use of 4% damping Hosgri response spectra because no higher damping value response spectra were available. NRC Regulatory Guide 1.61 (1973) permits the use of 7% damping for bolted structures under Safe Shutdown Earthquake and including Hosgri Earthquake. The 7% damping is more appropriate since the reactor head is bolted to the stand, and each head stand also has bolted connections. Therefore, a simplified methodology is developed to generate the 7% damping response spectra based on the available 4% damping response spectra. The seismic response spectra are further reduced in the low and intermediate frequency ranges by assuming a limited nonlinear (elasto-plastic) behavior exists in the structural system.
2
method is then simplified by using a decoupling technique to separate the structure into two models at the interface of RVCH and head stand as shown in Figure 1 below.
The reduced inelastic seismic response spectra is used in finding the reactions for an ANSYS stick model of the reactor head, CRDM, IHA, and the bolts between the head and the stand (noted as Model 1 in Figure 1). The non-linearity of Model 1 is due to reactor head-to-stand bolt stiffness in tension being smaller than the head-to-stand bearing compression stiffness. The reactions from Model 1 are then applied statically on a 3-D non-linear model of all the support frames comprising the stand structure (noted as Model 2 in Figure 1). This model depicts the behavior of the system and distributes the loads between the stand frames. The non-linearity of Model 2 is due to the fact that the portal frame (W14) is not attached to the concrete slab (i.e., act in bearing only). The resulting forces and stresses from Model 2 are evaluated using the design basis allowable criteria and code of record, AISC (1989), for acceptance.
a. Overall Configuration b. Individual Stand
Figure 1. Reactor Vessel Closure Head (RVCH) Stand
Mo
d
el
N
o
.
2
Mo
d
el
N
o
.
1
RVCH
Head Stands Total 4 at 90º
IHA (Gap)
½” Vertical PL
½” Horizontal PL
1-½” Horizontal PL
½” Vertical PL
Original Head Stand Built-Up Section
W14x99 Column (Typical)
4
RESPONSE SPECTRA GENERATION
4.1 7% Damping Response Spectra Generation
The existing head stand evaluation conservatively used 4% damping for Hosgri Earthquake since 7% damping spectra were not available. To reduce this conservatism, the response spectra for 7% damping is developed by scaling the 4% damping response spectra using the relationship given in Newmark (1971) which states that the spectral values are proportional to the following:
[
]
1/25 . 0
1+ " " " !
# s
Sa
%
$
(1)Where,
is the damping ratio
is the angular frequency (radians/sec)
s is the duration of strong motion earthquake (sec) Sa is the acceleration response (g)
Hence the spectral values for 7% damping, Sa7
, are obtained from the 4% spectral values,
Sa4, using
the following relationship:
[
]
[
]
1/24 2 / 1 7 4 7
5
.
0
1
5
.
0
1
! !"
"
"
+
"
"
"
+
=
s
s
S
S
a a#
$
#
$
(2)
The horizontal and vertical response spectra for 7% damping were found using s = 15 sec. which is the duration of strong motion of the Hosgri ground motion acceleration time history plots (see Figure 2). The 4% damping response spectra is plotted along with the 7% damping response spectra for the head stand floor elevation at Diablo Canyon in Figure 3. The peak horizontal acceleration was found to be 3.5g and the peak vertical acceleration was found to be 1.3g.
a. Horizontal Direction b. Vertical Direction
Figure 2. Ground Motion Time History for Hosgri Earthquake
4
a. Horizontal Direction b. Vertical Direction
Figure 3. Revised Hosgri Earthquake Response Spectra – (Newmark)
4.2 Generating Design Response Spectra for Inelastic Systems
In order to obtain more design margin, the generated seven percent (7%) damping response spectra is further modified by accounting for the limited nonlinear (elasto-plastic) behavior in the structural system. This method was proposed by Newmark (1982) and is also discussed by Gupta (1992).
The 7% damping response spectra (SE) is modified as follows: 1. For Low Frequency range SY = SE/
2. For Intermediate Frequency range SY = SE/ (2µ!1) 3. For High Frequency range SY = SE
Where is the ductility factor (ductility) of the structure and is taken as 3.0 for Class II structures per Table 4 of NUREG/CR-0098, Newmark (1998). Hence, (2µ!1) = 5 = 2.24. This reduction is only applied for the horizontal response spectra since the structure is fairly rigid (i.e., high frequency) in the vertical direction.
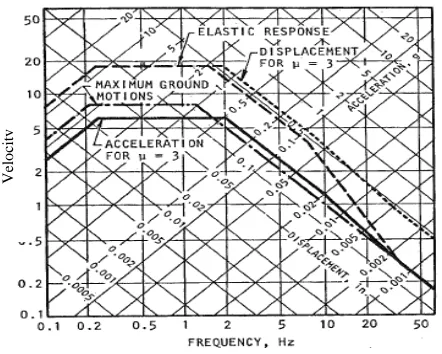
A typical response spectra plot showing the construction of the elastic and inelastic response was presented by Newmark (1982) and shown here in Figure 4.
Figure 4. Typical Elastic and Inelastic Design Spectra, Newmark (1982)
V
e
lo
c
it
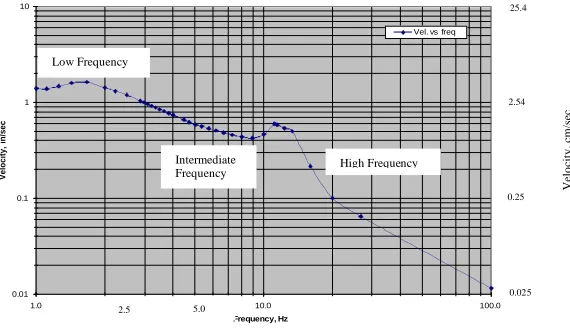
Since the velocity, V = D and the acceleration, A = 2D, where D is the displacement and is the circular natural frequency equal to 2f , and f is the frequency, then the velocity, V = A/ . The velocity can be determined and plotted on log-log scale as shown below which resembles shape of the curve on Figure 4.
Horizontal (based on 7% Damping)
0.01 0.1 1 10
1.0 10.0 100.0
Frequency, Hz
V
e
lo
c
it
y
,
in
/s
e
c
Vel. vs freq
Figure 5. Horizontal Velocity (Based on 7% Damping)
The low frequency range is taken to be up to 2.5 Hz, and the intermediate frequency range is taken from ~2.5 – 5.0 Hz. The high frequency range is taken beyond 5.0 Hz. These ranges are based on the spectral velocity plot shape. Conservatively, the elastic spectra in the low and intermediate frequency (i.e., less than 5.0 Hz) ranges is divided by 2.24. Figure 6 below shows the inelastic response spectra with fundamental frequency (f1) indicated; no other frequency occurs within the reduced response spectra region.
Figure 6. Reduced Inelastic Hosgri Earthquake Response Spectra – Horizontal
5
DECOUPLED MODEL NO. 1
The response spectra analysis method is linear elastic. However, the system contains non-linear characteristics at the interface between the head and the head stands, i.e., the bolts acting in tension with some flexibility and the interface is rigid in compression (bearing) on the four individual stands. The approach discussed below decouples the structure and reduces the non-linear behavior into an equivalent linear behavior that can be analyzed using the standard response spectra method.
V
el
o
ci
ty
,
cm
/s
ec
25.4
2.54
0.25
0.025 High Frequency
Low Frequency
Intermediate Frequency
2.5 5.0
6
5.1
Model for Load Development to Head Stand
The new RVCH and IHA parameters are input as a "stick" model into the ANSYS finite element program. The model includes the appropriate masses, mass locations and stiffnesses. A total of 3 models are created for the vertical and the two orthogonal horizontal directions of the ground excitation. The developed model is shown in Figure 7. The element type used to represent the stick model is ANSYS BEAM4, 3-D Elastic Beam Elements. For the lumped mass, m0 to m4, ANSYS MASS21 Element type is used. The elements that represent the CRDMs are located between m1 and m3 and are separated from the elements that represent the IHA (between m1 and m4). Mass point m2a is applied at the IHA component, and mass point
m2b is applied at the CRDM component.
Figure 7. Finite Element Stick Model
5.2
Boundary Condition
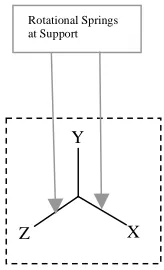
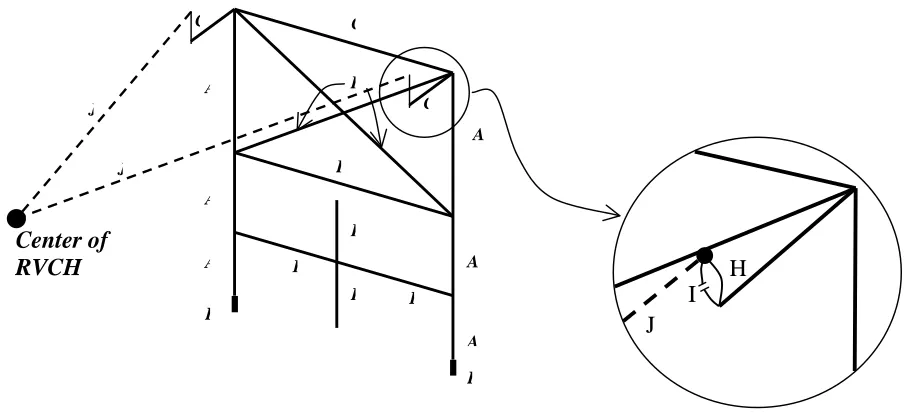
All models are restrained to rotation in the Y direction (vertical) and to displacements in X, Y and Z directions at the bottom of the model (base center of the RVCH). The non-linear behavior is converted to a linear problem by calculating an equivalent rotational stiffness that corresponds to the bolts in tension as the heads pivots around one of the legs (see Figure 8). The problem then is decoupled by introducing rotational springs at the base of the stick model. Tension stiffness (upward) of the bolts is calculated; compression stiffness (downward) is assumed rigid. Other boundary conditions (lateral and torsion restraints) are assumed rigid.
a. Plan View b. View A-A: Displacement due to Moment M
Figure 8. Rotational Moment Representation
Stand 1
Stand 2 Stand 3
Stand 4
Z
X
C
M
δ
2δ
1T
1T
2R
R
θ
North
A
A
15º
Y
Z X
To illustrate, the stiffness of the rotational spring is calculated as follows: Let the head rotate and pivot around Stand 4 (Figure 8a). If the moment produces a unit displacement δ1 = unity at the location of Stand 1 (Figure 8b), the stiffness (lbs/in) of the bolts located at this stand is computed as follows:
L EA n
k1 = !
The reaction T1 (lbs) at Stand 1 is equal to
"
1!
k
1.At the middle section, the stiffness of the bolts corresponding to Stands 2 and 3 is given by:
L EA n
k2 =2! !
Where,
E is the elastic modulus (psi),
A is the bolt area (in
2),L is the bolt length (in), n is the number of bolts per stand The reaction T2 (lbs) for Stands 2 and 3 is equal to
"
2!
k
2.The reaction C (lbs) at Stand 4 is equal to T1 + T2.
Therefore, the moment (lbs-in) acting at the base center is given by: M = C × R + T1 × R The angle θ (rad.) at the displaced configurations is given by:
!
"
#
$
%
&
'
=
(R
2
1
tan
1)
Therefore, the rotational stiffness kθ (lbs-in/rad) is equal to:
kθ = M/θ
The rotational stiffness is input for both global X and Z directions at the support with ANSYS COMBIN14 Element type as shown in Figure 7.
5.3
Modal Combinations
The mode extraction method specified for the modal analysis is Block Lanczos Eigenvalue Extraction Method, and the single-point base excitation response spectrum solution is obtained by using the seismic acceleration response spectrum loading defined in Section 4.2. Three dynamic response spectra analyses are performed (one for each direction of earthquake motion).
The modal combination method used in the response spectra analysis is the Grouping Method specified in NRC Regulatory Guide 1.92 (1976), see Equation 3 below. The Grouping Method is a generalization of the method of the square root of the sum of the squares where closely spaced modes are divided into groups that include all modes having frequencies lying between the lowest frequency in the group and a frequency 10% higher.
2 / 1 1 1
!
"
#
$
%
&
=
''
= = n i pj n j pi ijpI
R
R
R
(
(3)Where,
RpI= combined periodic response for the I th
component of seismic input motion (I = 1, 2, 3 for one vertical and two horizontal components)
εij = the modal correlation coefficient for modes i and j
Rpi = periodic response or periodic component of a response of mode i
Rpj = periodic response or periodic component of a response of mode j
8
5.4
Seismic Load Combinations
The reactions at the base of the ANSYS stick model are combined using the 100-40-40 method. Unlike the Square Root of the Sum of the Squares (SRSS), the 100-40-40 method maintains the sign of the reaction forces. This allows the analysts to distinguish between the different structural behavior, i.e., in tension and compression. As such the 100-40-40 reduces conservatism by qualifying members based on their actual response in tension or compression. This method creates a total of 24 loading combinations from the X, Y, and Z excitations. The additional moments caused by P-Δ effects due to possible large deflections under inelastic behavior are also included with 100-40-40 seismic combination for both force (P) and displacement (Δ) in the three orthogonal directions. The displacement (Δ) is based on the maximum displacement obtained from ANSYS output multiplied by the allowed ductile ratio ( ) of 3.0 to account for the inelastic response. The individual head stands are located 15 degrees from the called North direction as shown in Figure 8a, and therefore, the reaction forces and moments are resolved into the local coordinate of the head stand assembly. For each load combination, these forces and moments are distributed to each head stand in terms of applied shear and vertical forces for determination of the critical loading combinations. Upon determination of the critical loading combinations, the associated reaction forces and moments at the base are used in analysis of the stands in Model No. 2.
6
DECOUPLED MODEL NO. 2
6.1
Three Dimensional Head Stand Model
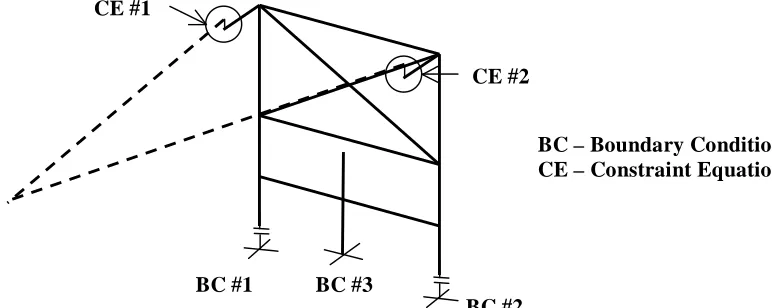
In order to predict a more accurate behavior of the stand legs acting as a group instead of individually, a 3D model of the four head stand legs tied by the RVCH is developed using ANSYS program. The configuration of the head stand structure is illustrated in Figure 1. The model includes the appropriate material, geometric properties, and boundary conditions. Critical loads obtained from the 100-40-40 seismic combination method (see Section 5.4) are superimposed to the dead weight at the center of the flange face of the RVCH. The overall view of the four stands as modeled in ANSYS is shown in Figure 9.
Figure 9. Finite Element Head Stand Structure Model
Figure 10. Element Type for Each Individual Head Stand
Table 1. Element Type Summary
Component (See Figure 1b) Element Type Element Type Description
Element Designation (See Figure 10)
W14x99 Column BEAM4 3-D Elastic Beam A 1/2” Horizontal Plate BEAM4 3-D Elastic Beam B 1-1/2” Horizontal Plate BEAM4 3-D Elastic Beam C 1/2” Vertical Plate LINK8 3-D Truss D Original Stand Built-Up
Section BEAM4 3-D Elastic Beam
E
Rigid Links (RVCH, Bolts between Original and Stand Extension, Eccentricities for the RVCH Bolts to Stands)
BEAM4 3-D Elastic Beam
F,G,J
Tension in Bolts LINK10 Tension-only Spar H Compression Between Head
and Stands CONTA178 3-D Node-to-Node Contact
I
Compression Between
W14×99 Column and Concrete CONTA178 3-D Node-to-Node Contact
K
6.2
Boundary Condition
Figure 11 shows the locations of the boundary conditions at each stand. Boundary Conditions # 1 and 2 are gap elements (CONTA178) that are fixed to the ground and work only in compression since the W14 columns are not attached to slab. Boundary Condition # 3 is restrained for all translational (ux, uy, uz) and rotational (θx, θy, θz) degrees of freedom since the member is welded to the embedment plate. See coordinate triad shown in Figure 9 for directions.
Center of
RVCH
AA A
A
A
A B
C
D
E
E F
F G
G J
J
K
K
10
The structure also contains constraint equations for lateral displacements, ux and uz (CE #1 and CE #2) since the shear pins would prevent differential lateral movements between RVCH and stands. Shear pins are assumed to be at the same location as the bolts in the model.
Figure 11. Boundary Condition and Constraint Equations
The required nodal forces and moments are extracted by post processing the ANSYS analysis results. The resulting forces and stresses are evaluated against the allowables in accordance with AISC and station seismic criteria for acceptance. The maximum displacement given by
ductility ratio (
=3.0) times displacement obtained from analysis is reviewed for possible interaction with nearby commodities. All members and connections were within allowables and no modification was required.7
CONCLUSION
The existing head stand structure was qualified without the need for structural modification using simplified non-linear analysis techniques. These techniques include developing higher damping spectra, inelastic spectra, decoupling of the structure, simplified non-linear model, and the 100-40-40 seismic combination methods.
REFERENCES
American Institute of Steel Construction (AISC), 9th Edition, “Manual of Steel Construction, Allowable Stress Design,”
ANSYS Finite Element Computer Code, Version 11.0, ANSYS Inc., Canonsburg, PA
Gupta, A. K., 1992, “Response Spectrum Method in Seismic Analysis and Design of Structures,” CRC Press Newmark, N. M., Rosenblueth, E., 1971, “Fundamentals of Earthquake Engineering,” Prentice-Hall, Inc. Newmark & Hall, 1982, “Earthquake Spectra and Design,” Earthquake Engineering Research Institute Newmark & Hall, 1998, “Development of Criteria for Seismic Review of Selected Nuclear Power Plants,” NUREG/CR-0098
U.S. Nuclear Regulatory Commission, Regulatory Guide 1.61, October 1973, “Damping Values for Seismic Design of Nuclear Power Plants”
U.S. Nuclear Regulatory Commission, Regulatory Guide 1.92, February 1976, “Combining Responses and Spatial Components in Seismic Response Analysis”
BC #1
BC #2 BC #3
CE #1
CE #2