DOI : https://doi.org/10.32628/CSEIT1952248
A Review on Various Algorithms used in Machine Learning
Divya Chaudhary*1, Er. Richa Vasuja2
1Computer Science and Engineering, Department, Chandigarh University, Gharuan, Punjab, India
2Assistant Professor, Computer Science and Engineering, Department, Chandigarh University, Gharuan, Punjab,
India ABSTRACT
In today’s scenario all of data is being generated by everyone of us . so it becomes vital for us to handle this data.
To do so new technologies are being developed such as machine learning, data mining etc. This paper gives the study related to machine learning(ML).Precise approximations are repetitively being produced by Machine
Learning algorithms. Machine learning system effectively “learns” how to guess from training set of completed
jobs. The main purpose of the review is to give a jagged estimate or overview about the mostly used algorithms in machine learning.
Keywords : Machine Learning(ML), Supervised Learning(SL), Unsupervised Learning(USL), K-means, Decision Trees.
I. INTRODUCTION
There are many new technologies that are being developed and are giving better solutions to every problem .most widely trending technologies are Artificial intelligence(AI), deep learning, data mining , Machine learning(ML) etc . Now let’s
understand what basically ML means :it means the ability of any computer to learn without explicitly coding . Machine Learning is the study of computational methods for refining performance by mechanizing the gaining of knowledge from understanding [1]. The machine finds better solution to every problem . ML is being used in every field of computational work where it design and increase the performance of algorithms.
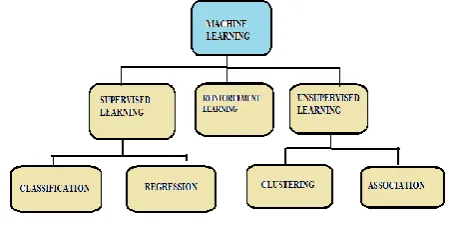
Three main types of machine learning can be named as: supervised learning (SL), unsupervised learning(USL) and reinforcement learning(RL). Supervised learning: this process deals with comparing the output with the expected output then finding the errors and solving it to get the expected output. For example : based on past information
about spam mails your genuine mails are getting separated from spam mails. Supervised learning can further be classified as classification and Regression. Unsupervised Learning: in this type of learning computer learns by its own by discovering and adopting from input pattern . . In this learning the data is divided into different clusters and therefore it is named as clustering algorithm. [2]
example of this is recommendations you get from your social accounts. Unsupervised learning can be classified as clustering and association.
Fig 1: classification of ML
II. OVERVIEW OF ALGORITHMS USED IN MACHINE LEARNING
Algorithms are the set of instructions to solve any problem. In ML to solve each and every problem we need a different approach. One problem can be solved using various algorithms but we need to find the most optimum solution. Our algorithms will help the machine to solve problems and give us the desired output.
Fig 2 : basic input and output
Name of some commonly used algorithms are: ● Linear regression(S)
● Decision tree(S)
● SVM(support vector machine(S) ● Naïve bayes (C)
● K-means(UNS)
● Random forest(S)
III.ALGORITHM DESCRIPTION
3(a)LINEAR REGRESSION:
Linear regression is built on supervised learning. It is one of the most simplest model in ML which is based on statistical model. The major use of this model is in forecasting or trend forecasting. now before
understanding what does linear regression means let’s understand what actually words implies. linear means a simple linear relation whereas regression in terms of maths means measure of the relation between two different values.
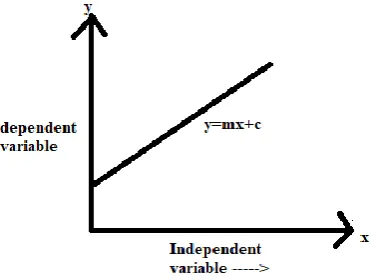
Fig 3 : graph showing linear regression
This algorithm depends upon relation between independent and dependent variables.
The equation of line is y=mx+c
Where y represents the dependent variable X denotes independent variable
m denotes the slope of line
c denotes the y intercept this algorithm finds the relation between x and y that means for every value of x we have a corresponding value of y . it maps continuous value of x to continuous value of y.
Fig 3 : Slope of line ( y=mx+c)
If the value of x increases ,then the slope of graph is positive (as shown in above graph).
of this technique. We have a method known as R-square which is also famous as coefficient of determination or coefficient of multiple determination.
That’s all about linear regression technique.
2) DECISION TREES:
Decision tree are the part of classification algorithms that come under supervised learning. In this algorithm a tree like structure is created. To find an outcome the tree is traversed according to the conditions. The root node have no incoming edge whereas other nodes(leaf nodes) have just one entering edge.[1]
Decision Tree is one of a widespread technique for forecast. Most of investigators have used this technique because of its easiness and unambiguousness to uncover small or large data structure and predict the value. [8][ 9] [13]
There are 3 kinds of nodes :
● ROOT NODE: the starting node of the tree which have no incoming edge
● DECISION NODE: the node which further splits into 2 further sub-nodes.
● LEAF NODE: the terminal nodes which are the end nodes
Example of decision node is suppose you have to find whether you want to find if your car is lost or not by traversing the tree we can obtain the result.
Car description {swift(car name), VDI (car model), red(car color)}
Fig 4 : Example showing decision tree
Decision trees gives the most accurate result and is widely used in many algorithms of classification. The main drawback of this algorithm is overfitting and it is not very well in dealing with continuous values because it already segregates the data in 2 sub-parts.
3) SVM(SUPPORT VECTOR MACHINE):
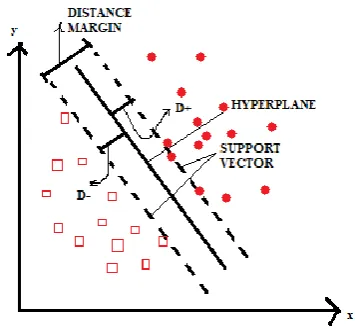
SVM is a category of supervised learning algorithm It is a discriminator classifier which analyses large data sets and finds pattern in it. and sorts the data in two classes. The major applications of this algorithm is face detection, text and hypertext categorization and classifying images. In this approach the data is divided using a line which is known as margin. SVM is grounded on the Structural risk Minimization (SRM).]
SVM have been fruitfully realistic to a diversity of real world problems [2] like particle identification, Bioinformatics, Civil and electrical engineering etc. The hyperplane is at maximum distance from the support vectors .
Fig 5 : Graph showing SVM algorithm.
So here the solution for 1-D data sets. There is kernel function present in sklearn package which converts 1-D data to 2-D set first then do the further predictions. There are 3 types of different kernel . different kernel function are for different decision functions.
Fig 6 : Input –output in case of 1-D dataset
TYPES OF KERNEL AND ITS POLYNOMIAL FUNCTIONS.
● Polynomial kernel k(a,b)=a*b
● Radial basis kernel k(a,b)=(a+b+1)^4 (RB Function)
● Sigmoid function k(a,b)=e^-7|a-b|^2
Kernel function changes the data into n-dimensions which makes easy to separate the data into different classes. These kernel functions can be fused together also.
The biggest problem in this algorithm is the choice of kernel function.
4) NAÏVE BAYES:
This algorithm comes under classification technique which is mostly most as a probabilistic classifier. the main advantage of this algorithm is that it needs very marginal amount of exercise dataset to evaluate the parameters. Naïve bayes have basically 2 parts in the algorithm.
Fig 7 : Naïve bayes parts.
5) K-MEANS ALGORITHM:
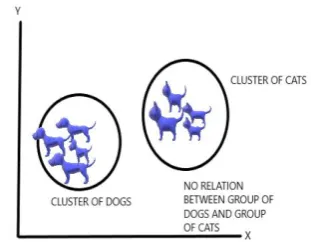
This algorithm comes under clustering .It is actual what people observe in their daily routine like a group of women standing together or a family going for dinner and sharing the same table. Clustering in terms of data science means a group of similar data sets with have no relation with the group of other data set. Segregating a set of objects in databanks into identical groups or clusters [5] is a vital procedure in data mining. It is suitable in a number of tasks, such as classification (unsupervised) [6], accumulation and splitting up or partition.
As shown in below diagram.
Fig 8 : Clustering of 2 datasets.
Clustering are of 3 types:
• Exclusive clustering , overlapping clustering and hierarchical clustering.
with the other cluster just like in k-means
• Put the nearest numbers in the clusters.
• Then find the mean of the clusters again and again sort the values in new cluster according to new calculated means
• Repeat these steps until you get the same means. • Final result will be generated.
The main cons of this algorithm are
1) Outliers: the data sets with are not part of any All the recommendations given to user on Netflix or amazon are using this algorithm. Hence it is one of the most popular algorithm being used.
6) RANDOM FOREST:
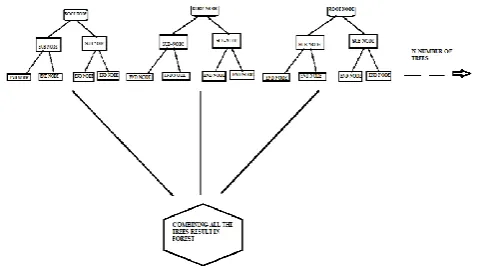
Random forest is the most popular algorithm in supervised learning. As the name indicated it creates a forest from number of trees .It can perform both regression and classification techniques which in fact makes it the most powerful algorithm of all. Decision tree algorithm act as base of this algorithm. Under this algorithm many decision trees are drawn and at the end all the trees are combined together to get the output. More the number of trees more will be the accuracy of the algorithm.
Fig 9 : Random forest generation
To make more clear what actually random forest
means let’s take a example: you want to buy sweets for family function. You will ask your closest friend that what sweet you like the most .you will ask some random questions to him based on what he will give you answer then if you ask only your closest friends others will say that you are biased then you will ask your other friends also about their taste. Then finally
you’ll buy the sweet that has more votes. Similarly
random forest algorithm works. It combines answers from various decision trees and then select the most common answer as the final output.
ALGORITHM OF HOW RANDOM FOREST WORKS:
• First of all, we have to pick any n number of random records from the dataset.
• Building decision trees
• Choose the number of trees you want and repeat step 1 and 2 .
• In case of regression the trees predicts the value of y and the average of all the values of y can be considered as final result whereas in case of classification trees each tree gives a new record and then at the end the new record is assigned to the category which wins the most votes.
IV.CONCLUSION
based or data structure based. We have discussed the working of mostly used algorithms along with their limitations and applications.
V. REFERENCES
[1]. Pat Langley, Stanford and Herbert A.Simon, Pittsburgh. "Application of Machine Learning and Rule Induction." available at http://cll.stanford.edu/~langley/papers/app.cac m.ps.
[2]. C. J. Burges, “A tutorial on support vector
machines for pattern recognition”, Data Mining
and Knowledge Discovery, vol. 2, (1998), pp. 1-43
[3]. M. Li and al. “An improved k-means algorithm
based on Map reduce and Grid”, International
Journal of Grid Distribution Computing, (2015) [4]. C. J. Burges, “A tutorial on support vector
machines for pattern recognition”, Data Mining
and Knowledge Discovery, vol. 2, (1998), pp. 1-43
[5]. Klosgen, W. and Zytkow, J.M. 1996. Knowledge discovery in databases terminology. Advances in Knowledge Discovery and Data Mining, U.M. Fayyad, G. Piatetsky-Shapiro, P. Smyth, and R. Uthurusamy (Eds.), AAAI Press/The MIT Press, pp. 573–592
[6]. Cormack, R.M. 1971. A review of classification. J. Roy. Statist. Soc. Serie A, 134:321–367
[7]. M. M. Quadri, N. Kalyankar, Drop out feature of student data for academic performance using decision tree techniques, Global Journal of Computer Science and Technology 10 (2). [8]. E. Osmanbegovic, M. Sulji ´ c, Data mining
approach for predicting student performance, Economic Review 10 (1)
[9]. S. Natek, M. Zwilling, Student data mining solution–knowledge management system related to higher education institutions, Expert systems with applications 41 (14) (2014) 6400–
6407
Cite this article as :