1
Studying a light sensor with light: multiphoton imaging in the retina
Thomas Euler1,2*, Katrin Franke1,3, & Tom Baden1,4
1 Institute for Ophthalmic Research, University of Tübingen, Germany
2 Werner Reichardt Centre for Integrative Neuroscience (CIN), University of Tübingen, Germany 3 Bernstein Centre for Computational Neuroscience Tübingen, University of Tübingen, Germany 4 School of Life Sciences, University of Sussex, Brighton, UK
* Corresponding author
i. Summary/Abstract
Two-photon imaging of light stimulus-evoked neuronal activity has been used to study all neuron classes in the vertebrate retina, from the photoreceptors to the retinal ganglion cells. Clearly, the ability to study retinal circuits down to the level of single synapses or zoomed out at the level of complete populations of neurons, has been a major asset in our understanding of this beautiful circuit. In this chapter, we discuss the possibilities and pitfalls of using an all-optical approach in this highly light-sensitive part of the brain.
ii. Key Words
Vertebrate retina, mouse, zebrafish, two-photon microscopy, biosensor, activity probes, visual stimulus-evoked activity, laser-evoked retinal activity
2
1. Introduction
Unlike most other neuronal tissues, the retina directly responds to light. Accordingly, using any form of light microscopy to study its function inevitably leads to superimposition of neuronal activity driven by the “intended” visual stimulus with activity driven by the optical imaging system itself.
Since single-photon (1P) excitation of fluorescence, as used in traditional wide-field charge-coupled device (CCD) camera systems or for confocal microscopy, usually uses excitation light within the visual spectrum, this conflict is near insurmountable. Typically, the excitation light of these imaging systems would saturate or even permanently blind the photoreceptors of the retina, thus leaving little room for modulation of their activity using additional sources of light. Two-photon (2P) microscopy [1] dramatically ameliorates – though never eliminates – this problem by using an infrared laser outside the visual spectrum for fluorescence excitation. This way, direct activation of retinal photoreceptor cells by the imaging system becomes much less of a problem [2–4]. As a result, 2P microscopy as a tool for studying neuronal function revolutionised retinal research over the past decades. At last, researchers could draw on the power of optical imaging to complement their physiological toolkit. Here, following a brief recap of retinal structure and function, we will highlight the advantages and remaining pitfalls of using 2P imaging to study this highly light-sensitive tissue with optical recording techniques, and how the light-induced side effects of the actual measurement can be estimated and overcome.
1.1
Probing retinal function with optical methods
The retina comprises five principal classes of neurons that are organised into three nuclear and two synaptic layers (Fig. 1a). In the outer plexiform layer (OPL), photoreceptors connect to the dendrites of horizontal cells and bipolar cells. The latter in turn carry the signal to the inner plexiform layer (IPL) where they contact amacrine cells as well as the dendrites of retinal ganglion cells (RGCs), the eye’s projection neurons to the brain. Most computational “power” of the retinal network derives from its
3 retinal function have focussed on these sites. As for neuronal networks in other parts of the brain, the ability of 2P microscopy to resolve neuronal activity down to the level of single synapses here really comes to shine.
With a few notable exceptions, most studies looking at vertebrate retinal function using 2P
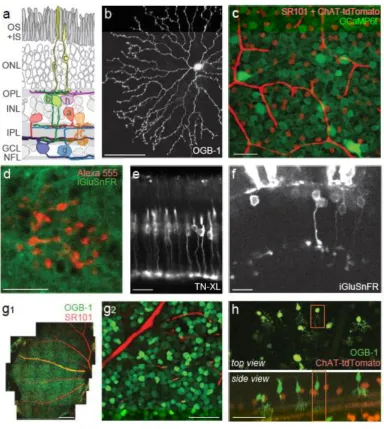
microscopy have focussed on the retinae of mice, rabbits and larval zebrafish. Initially dominated by use of synthetic fluorescent probes introduced by single-cell injections (Fig. 1b), nowadays
genetically-encoded indicators of neuronal activity (“biosensors”) are used in genetically accessible model systems such as mouse and zebrafish (Fig. 1c-f). Such biosensors include, for instance, the GCaMP family of calcium (Ca2+) probes [5, 6] or, more recently, iGluSnFR, a sensor for extracellular glutamate [7–9]. For example, Dreosti et al. [10] expressed SyGCaMP2 under the RibeyeA promotor to drive expression of this Ca2+ biosensor in bipolar cells of the larval zebrafish retina. This was followed by a series of studies using this approach and its subsequent iterations using other forms of GCaMP or SypHy to study zebrafish inner retinal processing at great depth [11–17]. In parallel, Ca2+ imaging using biosensors also found its way into the mouse retina (Fig. 1c,e) [5, 18]. This enabled investigating more complex synaptic interactions with multiple partners [19, 20], such as those at the core of the intensely studied “direction-selective” (DS) circuit in the retina [21]. Even intracellular chloride (Cl-) levels – indicative of inhibitory synaptic inputs mediated by γ-aminobutyric acid (GABA) or glycine receptors – can be monitored in this way. For example, Duebel et al. [22] used Cl- imaging to reveal in certain bipolar cell types a standing Cl- gradient, which enables these cells to process GABAergic inputs differentially at the dendrites and the axon terminals. More recently, the ascent of glutamate imaging further expanded the available toolset for studying retinal function (Fig. 1d,f; [7, 23]). All major excitatory neurons of the retina use glutamate as their neurotransmitter. Accordingly, the ability to directly monitor their synaptic output using glutamate imaging – rather than “just” the presynaptic Ca2+ signals that drive release – turned out to be yet another game changer. For
4 inhibition in the inner retina [24]. In the meanwhile, others used this approach to study receptor types underlying transient and sustained Off bipolar cell responses [25] and the role of excitation in direction selectivity [26].
Fig. 1. Retina and retinal labeling
5 Multiple studies followed suit using similar techniques, for example, most recently demonstrating species differences in these cells’ dendritic wiring with the presynaptic partners [28]. Finally, given
that the retina is a thin sheet of tissue, also bulk loading of synthetic indicators, in particular via electroporation (Fig. 1g,h), can be used to address questions that require complete labelling of neuronal populations, such as the synaptic terminals of photoreceptors in the OPL [29] or the cell bodies in the ganglion cell layer (GCL) [30–32]. Bulk loading with synthetic indicators may also be tweaked to result in sparse labelling useful for imaging individual neurons [33, 34], avoiding the need for technically challenging single-cell injections.
Taken together, 2P imaging has to date been used to study all major sites in the inner and outer retina, including cone pedicles [4, 29, 30, 35], horizontal cell dendrites [36], bipolar cell axon
terminals [20, 26, 34, 37], amacrine cell circuits [17, 19, 27, 28, 38–41] and ganglion cells [20, 30, 32, 34, 42, 43]. Clearly, the ability to study retinal circuits down to the level of single synapses, or zoomed out at the level of complete populations of neurons, has been a major asset in our understanding of this beautiful circuit. However, as we shall see, we must continue to be vigilant about the remaining pitfalls of using an optical approach.
1.2
Direct and indirect excitation of the retina in 2P microscopy
Optical access to the retina from the photoreceptor side is limited, because here several layers of photoreceptor cell bodies form a light-scattering lenslet array (cf. Fig. 1a; [44]). Instead, the isolated and “flat-mounted” retina is typically accessed from the retinal ganglion cell side. However, as the retinal tissue itself is only around 150-200 µm thick and transparent, the main challenge is not depth penetration – as it is in other parts of the brain – but rather light-sensitivity. Perhaps contrary to intuition, the infrared (IR) laser used in 2P microscopy is not at all invisible to the retina [2, 3].
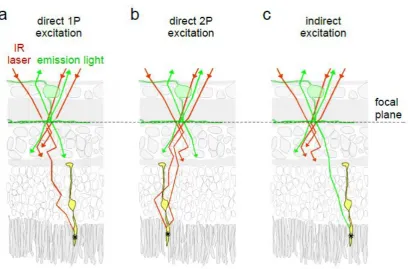
6 long, ultra-low sensitivity tail that reaches far into the IR range [46]. Combined with the high laser power required for generating fluorescence signals, this direct (1P) excitation of opsins can be substantial (Fig. 2a). In addition, the 2P effect [47] can also excite opsins [2] (Fig. 2b) – just like the fluorescent probes. Due to the quadratic laser intensity dependence of 2P excitation (see Section 3.4) and the fact that scanning usually occurs in a plane several tens of micrometres away from the photoreceptors, 2P excitation of opsins appears highly unlikely. However, because of the extreme opsin concentration in the photoreceptor outer segments and the high gain of the phototransduction cascade, even sparse 2P opsin activation can contribute strongly to the laser-evoked response of the retina. Finally, the fluorescence that is meant to be generated within the tissue adds to this laser response: when scattered towards the photoreceptors, it hits the opsins right in the bulk of their sensitivity curve (Fig. 2c). This effect can cause rhythmic activity as the laser focus repetitively scans across a cell’s receptive field. This effect is referred to as “indirect excitation” (of the photoreceptors)
and further contributes to setting up a background activation of the retinal network.
7 Together, direct 1P and 2P excitation as well as indirect excitation of photoreceptors generate a “low-photopic” level of background activation in the retina [3]. This makes it difficult, if not
impossible, to study retinal processing outside the photopic regime using 2P microscopy. How to estimate and minimise these effects is discussed in Section 3.4.
1.3
Visual stimulation
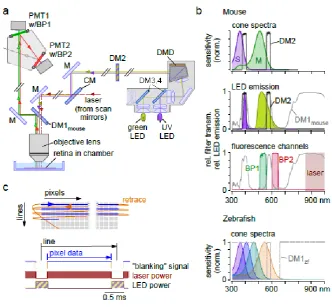
Beside the imaging system interfering with the photoreceptors and thereby triggering the retinal network (“laser effect”, see Section 1.2), the possibility of “opposite” crosstalk presents a further complication: Any light introduced in addition to the excitation laser – for example, to provide a controlled visual stimulus to the retina – is potentially “seen” by the microscope’s light detectors (some variant of photomultiplier tube, PMT). In other words, the visual stimulus can easily “swamp” the detection part of the 2P-system, thus making it impossible to image anything at all (or even permanently damage the PMTs). Two main approaches can be used to ameliorate this problem: (i) segregation of the spectrum into specific bands for fluorescence emission (from the probe) and light stimulation, for instance, using customised dichroic mirrors, or (ii) rapid temporal separation of image acquisition and visual stimulation. Ideally, both are used in conjunction [3].
Spectral separation is usually easy to achieve as visual stimulation does not need to cover the retina’s full spectral sensitivity range. Depending on the species, two to four narrow wavelength bands are typically sufficient to differentially drive the spectrally different opsins (photoreceptors) and thus address basic questions in colour vision. In this way, conflicts between visual stimulation and imaging can be avoided, so long as two spectral windows for detection of the common fluorescent probes, which usually exhibit their fluorescent peaks around 530 nm (“green”) and 630 nm (“red”), are left reserved for imaging. Example arrangements for mouse and zebrafish are given in Section 3.3.
8 such stimulation artefacts hamper the reliable detection of the actual light stimulus-evoked activity. This problem can be addressed by segregating periods of image acquisition from those of light stimulation, for instance, by stimulating solely during the scan retrace (see Section 3.3). In addition, “gated” PMTs that, for instance, contain a shutter that can be driven with microsecond precision
(see, e.g. the H11526 series by Hamamatsu), maybe become an option to prevent stimulation light from entering the actual detectors.
1.4
Recording configurations
Though principally transparent itself, the retina embedded in the pigmented eyeball remains difficult to optically access in vivo. As a result, most work on retinal physiology has been done in so-called “retinal explants” where the retina is removed in its entirety from the eyeball (see Section 3.1). In its
“flattened” form, this in vitro configuration provides for straight-forward optical access of any retinal
neuron and synaptic layer, and it simplifies spatially structured visual stimulation. Since the retinal network is largely feed-forward with most species receiving little or no centrifugal projections from the brain [48], this “whole-mount” configuration is considered to provide a reasonable
approximation for most retinal functions.
9 network are severed by the sectioning. Therefore, from a functional point of view, whole-mounts are preferable as here the long-range inhibitory interactions (i.e. polyaxonal amacrine cells [52] and horizontal cells [53]) remain intact.
In principle, in vivo imaging of the mammalian retina is also possible. This can be achieved using adaptive optics which permit optically corrected access of the imaging system through the cornea and lens and has been demonstrated, for example, in mice and macaques [54, 55], in the latter, though, not yet for 2P imaging of neuronal activity. However, this in vivo approach is technically challenging and therefore not yet widely used. In contrast, small, semi-transparent model species, such as the larval zebrafish, offer a simpler alternative for many research questions. Here, genetic (e.g. “crystal fish”, [56]) or chemical removal of some of the eye’s pigment [10] allow direct optical access to most of the retinal network in vivo. One remaining downside is that any removal of the eye’s screening pigment around the eyeball also interferes with the spatial profile of light reaching
different parts of the eye. Of course, this is also an issue in any form of retinal explant.
2. Materials
2.1 Two-photon microscope
10 In our labs, we use MOM-type 2P microscopes, originally designed by W. Denk (MPI for Neuro-biology, Martinsried, Germany) and now built and further developed by Sutter Instrument (Novato, CA, USA). We chose the MOM – the “movable objective microscope” – because it can be easily customised, e.g. by adding different types of visual stimulators (cf. Section 2.2). For a detailed description of the MOM design, see elsewhere [3]. In brief, our systems are equipped with a mode-locked Ti:Sapphire laser (MaiTai-HP DeepSee, Newport Spectra-Physics, Darmstadt, Germany) tuneable to wavelengths roughly between 800 and 1030 nm, a water immersion objective (e.g. W Plan-Apochromat 20x/1.0 DIC M27 VIS-IR, Zeiss, Oberkochen, Germany) and two fluorescence detection channels. The latter are optimised for detection of green and red fluorescent probes by using appropriate band-pass filters positioned in front of the PMTs (cf. Fig. 5a; for example, HQ 510/84 and HQ 630/60 dichroic filters, respectively; AHF Tübingen, Germany). For image acquisition, we use custom software (“ScanM” by M. Müller, Max Planck Gesellschaft, Martinsried, and T.E.) running under IGOR Pro 6.3 for Windows (Wavemetrics, Lake Oswego, OR, USA) on a PC equipped with fast multi-channel I/O cards (PCI-6110 or PCI-6115, and PCIe-6363, National Instruments, München, Germany), which control scanners and image acquisition, and generate blanking and trigger signals (cf. Section 3.3). However, other software packages (e.g. ScanImage, Vidrio
Technologies, Ashburn, VA, USA) can be used on the same hardware as well. In addition, ScanImage is quite flexible and can be adapted to a range of imaging hardware and I/O cards.
2.2 Visual stimulation
The advantages of TTO stimulation (cf. Section 2.1) are (i) that the high quality of the objective lens used for imaging is also exploited for stimulus projection; (ii) that, assuming proper alignment, the stimulation centre is always registered to the centre of the imaging field (the stimulus is “carried around” with the imaging field when moving across the retinal surface); and (iii) that only a relatively
11 sufficient spatial resolution (i.e. a high NA) while having a large field-of-view (FOV) and, thus, large stimulation area. Here, a 20x objective like the selected one (cf. Section 2.1) represents a good compromise for many research questions in the retina.
The TTO solution presented in this chapter uses a digital-mirror-device (DMD) based video projector that is coupled into the optical path of the microscope after the scan mirrors. Commercially available “consumer” devices can be employed, however, depending on the species studied and, thus, the
wavelengths needed for effective opsin stimulation, the internal LEDs may need to be replaced by appropriate LED/filter combinations (for mouse and zebrafish solutions, see Section 3.3). For minimising cross-talk between light stimulator and PMTs (cf. Section 1.3), a modification of the LED control may be necessary to blank the stimulator light during the scanning (see Section 3.3). While such consumer devices are very affordable, they undergo fast revision cycles, such that only a year later it may be difficult to find the same model for which the LED modification was developed. Therefore, employing more expensive, but well-documented and controllable evaluation platforms with longer revision cycles, such as the LightCrafter™ (e.g. DLP LightCrafter 4500, Texas Instruments, Dallas, TX, USA), may be considered as an alternative. These devices are also available with
customer-specified LEDs and appropriately optimised internal optics (e.g. EKB Technologies Ltd, Bat-Yam, Israel) and even as a version with a port for a light-guide, which facilitates adding other light sources. The LightCrafter can be driven like a computer monitor via an HDMI link from any visual stimulation software (e.g. Psychtoolbox, http://psychtoolbox.org, [57]; or our own software, QDSpy, https://github.com/eulerlab/QDSpy, see Section 3.3).
For full-field stimuli, a simple, LED-based light stimulator in TTC configuration may be sufficient. Such a contraption can be easily built from a set of filters and LEDs driven by off-the-shelf electronics, like an Arduino Uno microcontroller board (https://www.arduino.cc/). It enables easy control of the LEDs’ intensities via pulse-width modulation (PWM), precise timing of the stimulus time course, and
12
3. Methods
3.1. Tissue preparation
The tissue preparation procedures for retinal imaging experiments are very similar to those used for standard physiological recordings in the retina, which is why we will not go into detail here. A step-by-step description of mouse retina dissection, including retinal slicing and whole-mount
preparation, as well as a list of tools and materials, is available elsewhere (e.g. [50, 60]). In the following, we will discuss a few guidelines regarding tissue preparation that are important for successfully imaging light-driven activity in the mouse retina. While most of these “rules” apply to any retinal experiment using light stimulation, some are critical for 2P imaging of the retina.
To maximise the amount of available light-sensitive visual pigment in the in vitro retina, animals should be dark-adapted for ≥1 hour prior to dissection. In our experience, dark-adaptation also facilitates detaching the neural retina from pigment epithelium (PE), which is advantageous when isolating the retina from the eyecup. While helpful in the mouse, this step is essential in many non-mammalian preparations such as birds and fish where the outer segments of photoreceptors markedly move in and out of the pigment epithelium depending on the adaptation state [61]. To minimise visual pigment bleaching, we carry out all steps of the dissection procedure using illumination light at the long-wavelength edge of the species’ visible spectrum: In mice, with their visual spectrum shifted to shorter wavelengths [62], very dim red light (e.g. ~650 nm-LEDs with ~100 µW power) still well-visible to humans, can be used. Minimising bleaching is less critical for
13 Depending on the research question, registering the orientation of the retina throughout the
preparation procedure and the experiment may be critical. This is because in most, if not all species, the distribution of neurons across the retina is anatomically and/or functionally inhomogeneous (e.g. [66, 67]). For example, in mice, short- and medium-wavelength sensitive photoreceptor types are unequally distributed across the retina [59, 68, 69]. In addition, recent studies demonstrate that different types of mouse RGCs show distinct distributions across the retina to differentially sample visual space [70–73]. One possibility to keep track of the retina´s orientation during the dissection is to use an orienting mark (e.g. dorsal) on the eye whilst still in the animal and make a little cut in the eyecup (with the retina still in) at the corresponding location. Alternatively, the stereotypic pattern of retinal blood vessels may be used (for mice, see Fig. 2 in [74]). As a result, this allows monitoring the retinal position and orientation of the recording site(s), which can be crucial for data
14
15 As discussed in Section 1.4, retinal whole-mounts or slices can be chosen. While both preparations allow keeping track of the recording position (for preparing slices, see e.g. [36]), whole-mounts make it particularly easy to map positions in the explanted retina onto spherical coordinates, thereby reconstructing the recording site(s) in the intact, three-dimensional retina (e.g. using the “Retistruct” algorithm, [75]). This presents the researcher with the opportunity, to relate retinal coordinates, for example, to motion axes [76] or visual coordinates, thus providing insights into the functional role and potentially, behavioural relevance of the retinal cells and circuits studied.
When mounting the retina in the recording chamber, the stimulus direction needs to be considered. The TTO configuration – with the stimulus projected from above and the GCL up – allows “more intact” preparations, such as an eyecup or a PE-attached whole-mount. Here, the retina can be
mounted on a non-transparent filter paper (e.g. nitrocellulose membrane, 0.8 µm pore size, Millipore, Ireland) or on IR-transmissive ceramic discs (“Anodisc”, #13, 0.2 µm pore size, GE
Healthcare, USA). For the TTO configuration, however, the stimulated area is limited by the field of view of the objective (cf. Section 2.2). In contrast, when the stimulus is projected from below through a condenser, the retina needs to be detached from PE and sclera. In addition, the tissue needs to be mounted on filter paper (see above) in which a small window has been cut (to allow the stimulus from below reaching the photoreceptors). Alternatively, a “harp” (e.g. a “U”-shaped Pt-wire with nylon strings, self-made or from companies such as Warner Instruments, Hamden, CT, USA) can be used to keep the retina flat and steady in the recording chamber. Another option is using the
transparent ceramic discs described above – however, one needs to consider that these discs scatter short-wavelength light, resulting in a blurred stimulus. Specifically, we found that 385 nm-stimuli smaller than 50 µm were blurred, whereas 576 nm-stimuli of the same size were accurately projected on the retina.
If compatible with the other fluorescent (activity) probes used, 0.1 µM of the red dye
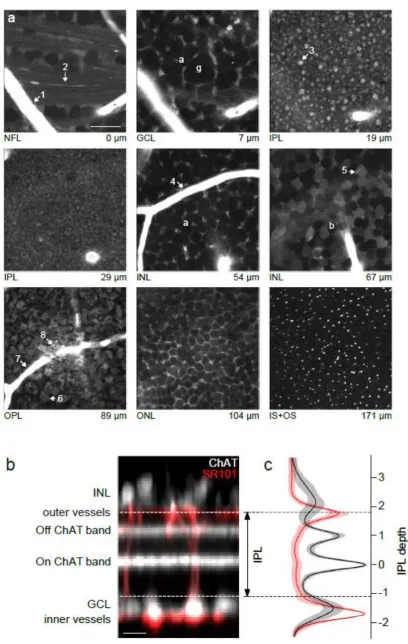
16 also enters damaged cells and brightly labels these [3, 77], thereby allowing to monitor tissue health during recordings. In addition, SR101 strongly stains retinal blood vessels (Fig. 3a), which can be used as a reliable stratification marker in the IPL (Fig. 3b,c; [24]) and as landmarks in the whole-mount, for example, to match recorded with subsequently immunolabeled cells [30]. Note that synaptically very active cells slowly take up SR101 by endocytosis (Fig. 3a); this has, for instance, been used to identify cone axon terminals in slices [36]. The level of SR101 staining usually allows distinguishing between this uptake-dependent labelling and labelling of damaged cells: The latter are stained quickly and become much brighter [77].
Finally, two more general points are in our experience critical for ensuring high quality recordings in the in vitro retina. First, recordings should be carried out at physiological temperatures (~37°C for mouse, or typically ~28°C for zebrafish – although as ectotherms, the fish retina is more
temperature-resistant) to maximise photoreceptor light responses. Second, the perfusion should run with at least 3-4 ml per minute to keep the tissue healthy and responsive to light. In our experience, both artificial cerebral spinal fluid (ACSF) solution (for recipe, see for example [30]) and Ames’ medium (e.g. A1420, Sigma-Aldrich / Merck, Darmstadt, Germany; [78]) work well for the isolated mouse retina.
3.2. Labelling the retina with activity probes
In recent years, the diversity of available indicators to measure different aspects of neuronal activity increased tremendously (e.g. [79]). This presents the opportunity to not only record neuronal activity per se but a specific biological process like neurotransmitter release (cf. Section 1.1). Here, we will
briefly describe a selection of labelling techniques that were successfully employed to introduce activity probes into the retina and that enable recordings of light-driven responses across all retinal cell classes.
17 The great advantage of biosensors over synthetic dyes is the possibility to address neuronal subsets selectively, including single, genetically defined cell types. For example, we use mouse lines
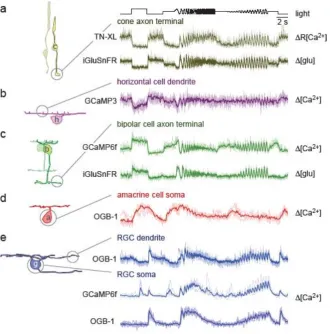
expressing the Ca2+ sensor TN-XL and GCaMP3 in cone photoreceptors and horizontal cells [4, 36], respectively, to image light-evoked Ca2+ changes in cone axon terminals (Fig. 4a) and horizontal cell dendrites (Fig. 4b) in the outer retina. While transgenic mouse lines have the advantage of stable expression suitable for longitudinal studies (e.g. [80]), their generation is very time consuming. Here, viral delivery of the biosensors, for instance, by transfection with adeno-associated virus (AAV) constitutes a more flexible alternative [81]. Viral vectors can be delivered to the retina via two routes [82]: They can be injected into the vitreous body of the eye (“intravitreal”), which predominantly targets inner retinal neurons, or into the subretinal space (“epiretinal”), targeting outer retinal neurons including photoreceptors.
18 We successfully injected AAVs purchased from Penn Vector Core (Philadelphia, PA, USA) encoding, e.g., the Ca2+ sensor GCaMP6f ([5], e.g. AAV9.hSyn.GCaMP6f), or the glutamate sensor iGluSnFR ([7], e.g. AAV2.hSyn.iGluSnFR) intravitreally using micromanipulators (M3301, WPI, Friedberg, Germany) and a Hamilton injection system (Hamilton Messtechnik GmbH, Höchst, Germany); for a description of the procedure, see e.g. [24]. Red fluorescent versions of Ca2+ and glutamate biosensors, such as RGECO [83] and R-iGluSnFR1 (8), respectively, are also available. Depending on the combination of viral vector and mouse line used, the expression can be targeted to a subpopulation of cells or (more or less) ubiquitously expressed across cell types (see also below). For example, by injecting the “floxed” GCaMP6f virus into the Pcp2-cre line (JAX 006207, The Jackson Laboratory, Bar Harbor,
USA), the Ca2+ sensor can be selectively expressed in a subset of bipolar cells, allowing, e.g., recording light-driven Ca2+ changes in isolated bipolar cell axon terminal systems (Fig. 4c). In contrast,
ubiquitous expression of a Ca2+ indicator such as GCaMP6f allows recording somatic light responses across a population of RGC types in the scan field (Fig. 4e). Similarly, the glutamatergic output of all bipolar cell types and photoreceptors can be systematically recorded by expressing the iGluSnFR ubiquitously across the retina (Fig. 4a,e). In general, the retinal transduction efficiency strongly depends on the serotype of AAV used: While some serotypes like AAV2 or AAV2.7m8 efficiently pass the inner limiting membrane [84], other serotypes, such as AAV9 or AAV1, require a punctuation of the inner limiting membrane with the injection needle to access the retina.
19 OGB-1 and Rhod-2, or more recent ones, such as Cal-520 [86], allows imaging somatic responses of complete populations of GCL cells [30], including RGCs (Fig. 4e) and displaced amacrine cells (Fig. 4d).
3.3. Light stimulation
20
Fig. 5. Optical pathways
21 ideal because higher LED intensities are needed to drive the cones, this “compromise” has been successfully used for chromatic stimulation of the mouse retina (e.g. [59, 87]). To increase stimulation efficiency of the mouse’s S-cone, using shorter-wavelength LEDs (e.g. 360 nm) is
tempting, however, we recommend checking first if the chosen projector sufficiently modulates/transmits such short wavelengths – in the DMD projectors we tested (e.g. DLP
LightCrafter 4500; K11 by Acer Computer GmbH, Ahrensburg, Germany), transmission sharply drops at ~380 nm. In any case, careful calibration of the effective photoisomerisation rates induced by the stimulator channels is mandatory, in particular when studying chromatic processing (for details and procedures, see e.g. [59, 87, 88]).
It is possible to adapt the filter/LED combinations for TTO stimulation also to the specific spectral requirements of other species. A possible filter design for zebrafish (DM1zf, Fig. 5b, bottom) could use the transmission band at ~590 nm of DM1mouse for stimulation of the fish red opsin, whereas the ~400-nm transmission of DM1mouse would need to be broadened to allow stimulating the fish UV, blue and green opsins. As long as temporally modulated visual stimuli suffice, such a tetrachromatic stimulator can be easily designed (cf. Section 2.2). For tetrachromatic, spatio-temporally structured stimuli, two DMD projectors equipped with a complementary set of LEDs can be combined. The selection of dichroic filter combinations for restricting the sometimes quite broad LED emission spectra to narrow bands – to accommodate for the necessary fluorescence detection channels – can become here more difficult, as it may necessitate (costly) custom filter designs.
Unfortunately, spectral separation only reduces, but does not eliminate stimulus light-evoked artefacts in the PMTs (cf. Section 2.2), mainly because filters are imperfect and PMTs highly light-sensitive. Therefore, we also use temporal separation of fluorescent signal detection and visual stimulation (Fig. 5c) by enabling the LEDs only during the retrace period of the microscope’s scan mirrors. This “blanking” signal is generated by the imaging software (in parallel to the signals that
22 resulting “flicker” of the LEDs modulate the retina’s activity, we use a total scan line duration of 2 ms
(e.g. 1.6 ms for signal acquisition, 0.4 ms for the retrace/visual stimulation); the resulting blanking signal frequency of 500 Hz is about one order of magnitude faster than the flicker fusion frequency of most mammals [89]. The LEDs can be switched either electronically (e.g. a “breaker” circuit) or mechanically (e.g. using a “chopper” wheel, that is synchronised with the blanking signal; see MC2000B, Thorlabs GmbH, Dachau, Germany). If the LEDs’ current requirements are high, building a breaker circuit with the required temporal precision becomes increasingly difficult; in this case an optical chopper solution may be considered. The latter, however, tends to be less flexible with respect to the timing and a potential source of vibrations which can be ameliorated by using rubber feet.
A focus adjustment lens in the stimulus pathway (not shown in Fig. 5a; for details, see [3]) introduces a vertical offset between focal plane (e.g. in the IPL) and stimulation plane in the photoreceptor outer segment layer (cf. Fig. 6a). In principle, it is possible to couple this adjustment lens to the movement of the objective (e.g. by using an electrically tuneable lens) to allow for changing the focal plane while keeping the stimulation plane fixed. In practice, we found that small changes of the focal plane – for example by ~50 µm to scan different levels of the IPL – has a negligible effect on stimulus quality.
3.4. Estimating and ameliorating laser effects on retinal activity
As discussed in Section 1.2, the laser used to excite the fluorescent probes can evoke substantial light responses in the retina’s photoreceptors via three mechanisms: direct 1P and 2P excitation, as well
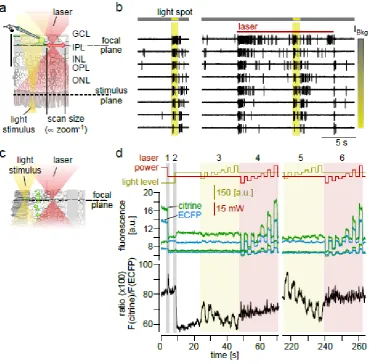
23 Generally, direct 1P excitation of the photopigment by the laser cannot be avoided, as the opsins’ spectral sensitivity curves represent probability distributions, which means the chance of excitation is non-zero even for wavelengths in the IR range. However, this probability rapidly falls with increasing laser wavelengths [90]. For example, at 930 nm mouse rhodopsin is in the order of 10-11 times less sensitive than at 497 nm, the peak of its sensitivity curve. This amounts to a rate of around 20 photoisomerisations per second and rod (R*s-1rod-1) for a 5 mW-laser beam scanning a whole-mounted retina with the focal plane in the IPL (Fig. 6a,b; for the detailed calculation, see [3]). Of course, when scanning closer to the photoreceptor layer, the laser-illuminated area in the
photoreceptor layer decreases quadratically with decreasing distance, resulting in a higher photon density and, therefore, in an increased 1P-dependent photoisomerisation rate in photoreceptors within that area.
Two-photon excitation requires a high photon density, which in practice is generated by pulsing an IR laser that is, “compressing” the laser’s power into very short light pulses. As 2P excitation probability
falls with the fourth power with increasing distance from the focal plane, fluorophores are only excited in a tiny volume (< 1 fl) within the focal plane (2P-based optical sectioning, see [1, 91]). For the same reason, it might seem that direct 2P excitation of the photoreceptor layer is unlikely. However, due to the extreme photopigment concentration in the photoreceptor outer segment (e.g. mouse rods contain in the order of 7·107 rhodopsin molecules [92]), combined with the high gain of the phototransduction cascade [93], even a few 2P excitation events can trigger sizable light
24 effect on the RGC activity should result from the photoreceptors “seeing” the 930 nm-laser (1P
excitation).
In addition to the dependence on absolute laser power, area and depth of the scanned field (or, more precisely, volume) within the retinal whole-mount are important factors that determine the laser-evoked activity observed under a specific experimental condition. Generally, the smaller the distance between the scanning plane and the layer of the photoreceptor outer segments, the stronger the laser-evoked 1P and, in particular, 2P effects. In practice, light stimulus-evoked activity in the OPL fades within a couple of seconds when using mouse retinal whole-mounts, but activity imaging in any other layer proximal to the OPL (that is, closer to or in the GCL) works quite well. The lack of discernible, stable light responses in the OPL may be due to excessive photopigment
25
Fig. 6. 2P effects
26 the minimum required for a sufficient signal-to-noise ratio (S/N) in the signal of interest by carefully adjusting the laser power and restricting the scanned volume to the necessary minimum. The success of these efforts, of course, also depends on the sensitivity and fidelity of the fluorescence detection system (for an example of how to estimate the effect of indirect excitation as a function of S/N, see [3]).
Because slicing unavoidably damages the retinal network, whole-mounts are preferable over retinal slices – at least for circuit-oriented research questions (cf. Sections 1.4 and 3.1). However, if optical recordings in the OPL are needed, vertical slices represent a viable alternative (e.g. [4, 51, 59]). By restricting the scan field to the OPL, the perpendicular orientation of the laser beam to the slice surface eliminates in-path laser illumination of the photoreceptor layer (Fig. 6c). Since only scattered laser light can reach the photopigments, direct excitation-related effects are strongly reduced compared to the whole-mount situation, enabling direct recordings of light stimulus-driven photoreceptor activity (Figs. 4a, 6d). Under the assumption that the focal volume roughly behaves like a point source (with fluorescence radiating equally likely in all directions), indirect laser effects are expected to be similar in the slice and the whole-mount.
27 from the bottom in Fig. 6b). In practice, this also means that stimulus presentations should always be preceded by an adequate period of time of laser scanning and background illumination (cf. Fig. 6d).
In conclusion, several measures can be taken to reduce direct 1P and 2P, as well as indirect laser-evoked effects:
(i) Limit the laser power to levels adequate to achieve sufficient S/N in the signal of interest;
(ii) Present a steady background illumination using the stimulator to reduce the overall light sensitivity of the retina;
(iii) After laser onset, give the retinal network sufficient time to adapt to the combined laser/stimulator background;
(iv) Restrict scan volume size as much as possible;
(v) If feasible, avoid highly fluorescent structures and/or homogeneities in fluorescent labelling within the scan volume.
28
5. References
1. Denk W., Strickler J.H., Webb W.W., et al. (1990) Two-photon laser scanning fluorescence microscopy. Science 248(4951):73-6
2. Denk W., Detwiler P.B. (1999) Optical recording of light-evoked calcium signals in the functionally intact retina. Proc Natl Acad Sci U S A 96:7035–40
3. Euler T., Hausselt S.E., Margolis D.J., et al. (2009) Eyecup scope-optical recordings of light stimulus-evoked fluorescence signals in the retina. Pflugers Arch Eur J Physiol 457:1393–1414 4. Wei T., Schubert T., Paquet-Durand F., et al. (2012) Light-driven calcium signals in mouse cone
photoreceptors. J Neurosci 32:6981–6994
5. Akerboom J., Chen T.W., Wardill T.J., et al. (2012) Optimization of a GCaMP calcium indicator for neural activity imaging. J Neurosci 32:13819–13840
6. Chen T.-W., Wardill T.J., Sun Y., et al. (2013) Ultrasensitive fluorescent proteins for imaging neuronal activity. Nature 499:295–300
7. Marvin J.S., Borghuis B.G., Tian L., et al. (2013) An optimized fluorescent probe for visualizing glutamate neurotransmission. Nat Methods 10:162–170
8. Wu J., Abdelfattah A.S., Zhou H., et al. (2018) Genetically encoded glutamate indicators with altered color and topology. ACS Chem Biol. doi: 10.1021/acschembio.7b01085
9. Marvin J.S., Scholl B., Wilson D.E., et al.(2017) Stability, affinity and chromatic variants of the glutamate sensor iGluSnFR. bioRxiv. doi: 10.1101/235176
10. Dreosti E., Odermatt B., Dorostkar M.M., et al. (2009) A genetically encoded reporter of synaptic activity in vivo. Nat Methods 6:883–9
11. Baden T., Esposti F., Nikolaev A., et al. (2011) Spikes in retinal bipolar cells phase-lock to visual stimuli with millisecond precision. Curr Biol 21:1859–1869
12. Esposti F., Johnston J., Rosa J.M., et al. (2013) Olfactory stimulation selectively modulates the OFF pathway in the retina of zebrafish. Neuron 79:97–110
13. Nikolaev A., Leung K.-M., Odermatt B., et al. (2013) Synaptic mechanisms of adaptation and sensitization in the retina. Nat Neurosci 16:934–41
14. Odermatt B., Nikolaev A., Lagnado L. (2012) Encoding of luminance and contrast by linear and nonlinear synapses in the retina. Neuron 73:758–73
15. Rosa J.M., Ruehle S., Ding H., et al. (2016) Crossover inhibition generates sustained visual responses in the inner retina. Neuron 90(2):308-19
16. Zimmermann M.J., Nevala N.E., Yoshimatsu T., et al. (2017) Zebrafish differentially process colour across visual space to match natural scenes. bioRxiv. doi: 10.1101/230144
17. Antinucci P., Suleyman O., Monfries C., et al. (2016) Neural mechanisms generating orientation selectivity in the retina. Curr Biol 26:1802–1815
18. Hasan M.T., Friedrich R.W., Euler T., et al. (2004) Functional fluorescent Ca2+ indicator proteins in transgenic mice under TET control. PLoS Biol 2:e163
19. Chen Q., Pei Z., Koren D., et al. (2016) Stimulus-dependent recruitment of lateral inhibition underlies retinal direction selectivity. eLife 5:1–19
20. Yonehara K., Farrow K., Ghanem A., et al. (2013) The first stage of cardinal direction selectivity is localized to the dendrites of retinal ganglion cells. Neuron 79:1078–1085
29 asymmetry in structure and function. Nat Rev Neurosci 13:194–208
22. Duebel J., Haverkamp S., Schleich W., et al. (2006) Two-photon imaging reveals
somatodendritic chloride gradient in retinal ON-type bipolar cells expressing the biosensor clomeleon. Neuron 49:81–94
23. Borghuis B.G., Marvin J.S., Looger L.L., et al. (2013) Two-photon imaging of nonlinear
glutamate release dynamics at bipolar cell synapses in the mouse retina. J Neurosci 33:10972– 10985
24. Franke K., Berens P., Schubert T., et al. (2017) Inhibition decorrelates visual feature representations in the inner retina. Nature 542:439–44
25. Borghuis B.G., Looger L.L., Tomita S., et al. (2014) Kainate receptors mediate signalling in both transient and sustained OFF bipolar cell pathways in mouse retina. J Neurosci 34:6128–6139 26. Park S.J., Kim I.J., Looger L.L., et al. (2014) Excitatory synaptic inputs to mouse on-off
direction-selective retinal ganglion cells lack direction tuning. J Neurosci 34:3976–3981 27. Euler T., Detwiler P.B., and Denk W. (2002) Directionally selective calcium signals in dendrites
of starburst amacrine cells. Nature 418:845–852
28. Ding H., Smith R.G., Poleg-polsky A., et al. (2016) Species-specific wiring for direction selectivity in the mammalian retina. Nature 535:1–17
29. Jackman S.L., Babai N., Chambers J.J., et al. (2011) A positive feedback synapse from retinal horizontal cells to cone photoreceptors. PLoS Biol 9:e1001057
30. Baden T., Berens P., Franke K., et al. (2016) The functional diversity of retinal ganglion cells in the mouse. Nature 529:345–350
31. Briggman K.L., Euler T. (2011) Bulk electroporation and population calcium imaging in the adult mammalian retina. J Neurophysiol 105:2601–2609
32. Briggman K.L., Helmstaedter M., Denk W. (2011) Wiring specificity in the direction-selectivity circuit of the retina. Nature 471:183–188
33. Baden T., Berens P., Bethge M., et al. (2013) Spikes in mammalian bipolar cells support temporal layering of the inner retina. Curr Biol 23:48–52
34. Poleg-Polsky A., Diamond J.S. (2016) Retinal circuitry balances contrast tuning of excitation and inhibition to enable reliable computation of direction selectivity. J Neurosci 36:5861–5876 35. Kemmler R., Schultz K., Dedek K., et al. (2014) Differential regulation of cone calcium signals
by different horizontal cell feedback mechanisms in the mouse retina. J Neurosci 34:11826–43 36. Chapot C.A., Behrens C., Rogerson L.E., et al. (2017) Local signals in mouse horizontal cell
dendrites. Curr Biol 27:3603–3615.e5
37. Baden T., Nikolaev A., Esposti F., et al. (2014) A Synaptic mechanism for temporal filtering of visual signals. PLoS Biol 12:e1001972
38. Grimes W.N., Zhang J., Graydon C.W., et al. (2010) Retinal parallel processors: more than 100 independent microcircuits operate within a single interneuron. Neuron 65:873–885
39. Hausselt S.E., Euler T., Detwiler P.B., et al. (2007) A dendrite-autonomous mechanism for direction selectivity in retinal starburst amacrine cells. PLoS Biol 5:e185
40. Hsiang J.-C., Johnson K., Madisen L., et al. (2017) Local processing of visual information in neurites of VGluT3-expressing amacrine cells. Elife e31307
30 90:27–34
42. Auferkorte O.N., Baden T., Kaushalya S.K., et al. (2012) GABA(A) receptors containing the alpha2 subunit are critical for direction-selective inhibition in the retina. PLoS One 7:e35109 43. Oesch N., Euler T., Taylor W.R. (2005) Direction-selective dendritic action potentials in rabbit
retina. Neuron 47:739–750
44. Solovei I., Kreysing M., Lanctôt C., et al. (2009) Nuclear architecture of rod photoreceptor cells adapts to vision in mammalian evolution. Cell 137:356–368
45. Jacobs G.H. (2012) The Evolution of Vertebrate Color Vision, In: López-Larrea J (ed) Sensing in Nature. Advances in Experimental Medicine and Biology, Springer, New York, NY, vol 739, pp. 156–172
46. Lewis P.R. (1955) A theoretical interpretation of spectral sensitivity curves at long wavelengths. J Physiol 130:45–52
47. Göppert-Mayer M. (1931) Über Elementarakte mit zwei Quantensprüngen. Ann Phys 9:273– 295
48. Reperant J., Ward R., Miceli D., et al. (2006) The centrifugal visual system of vertebrates: a comparative analysis of its functional anatomical organization. Brain Res Rev 52:1–57 49. Werblin F.S. (1978) Transmission along and between rods in the tiger salamander retina. J
Physiol 280:449–470
50. Kulkarni M., Schubert T., Baden T., et al. (2015) Imaging Ca2+ dynamics in cone photoreceptor axon terminals of the mouse retina. J Vis Exp e52588
51. Kulkarni M., Trifunović D., Schubert T., et al. (2016) Calcium dynamics change in degenerating cone photoreceptors. Hum Mol Genet 25:3729–3740
52. Lin B., Masland R.H. (2006) Populations of wide-field amacrine cells in the mouse retina. J Comp Neurol 499:797–809
53. Peichl L., González-Soriano J. (1994) Morphological types of horizontal cell in rodent retinae: a comparison of rat, mouse, gerbil and guinea pig. Vis Neurosci 11:501–517
54. Yin L., Masella B., Dalkara D., et al. (2014) Imaging light responses of foveal ganglion cells in the living macaque eye. J Neurosci 34:6596–6605
55. Palczewska G., Dong Z., Golczak M., et al. (2014) Non-invasive two-photon microscopy imaging of mouse retina and retinal pigment epithelium through the pupil of the eye. Nat Med 20:785–789
56. Antinucci P., Hindges R. (2016) A crystal-clear zebrafish for in vivo imaging. Sci Rep 6:29490 57. Brainard D.H. (1997) The Psychophysics Toolbox. Spat Vis 10:433–6
58. Breuninger T., Puller C., Haverkamp S., et al. (2011) Chromatic bipolar cell pathways in the mouse retina. J Neurosci 31:6504–6517
59. Baden T., Schubert T., Chang L., et al. (2013) A tale of two retinal domains: Near-optimal sampling of achromatic contrasts in natural scenes through asymmetric photoreceptor distribution. Neuron 80:1206–1217
60. Ivanova E., Toychiev A.H., Yee C.W., et al. (2013) Optimized protocol for retinal wholemount preparation for imaging and immunohistochemistry. J Vis Exp e51018
61. Arey L.B. (1916) The movements in the visual cells and retinal pigment of the lower vertebrates. J Comp Neurol 26:121–201
31 ultraviolet light. Nature 353:655–656
63. Wang J.-S., Kefalov V.J. (2011) The cone-specific visual cycle. Prog Retin Eye Res 30:115–128 64. Li P.H., Field G.D., Greschner M., et al. (2014) Retinal representation of the elementary visual
signal. Neuron 81:130–9
65. Newman E.A., Bartosch R. (1999) An eyecup preparation for the rat and mouse. J Neurosci Methods 93:169–75
66. Boycott B.B., Wässle H. (1974) The morphological types of ganglion cells of the domestic cat’s retina. J Physiol 240:397–419
67. Goodchild A.K., Ghosh K.K., Martin P.R. (1996) Comparison of photoreceptor spatial density and ganglion cell morphology in the retina of human, macaque monkey, cat, and the marmoset Callithrix jacchus. J Comp Neurol 366:55–75
68. Peichl L. (2005) Diversity of mammalian photoreceptor properties: Adaptations to habitat and lifestyle? Anat Rec - Part A Discov Mol Cell Evol Biol 287:1001–1012
69. Szél A., Röhlich P., Caffé A.R.R., et al. (1992) Unique topographic separation of two spectral classes of cones in the mouse retina. J Comp Neurol 325:327–342
70. Bleckert A., Schwartz G.W., Turner M.H., et al. (2014) Visual space is represented by
nonmatching topographies of distinct mouse retinal ganglion cell types. Curr Biol 24:310–315 71. Rousso D.L., Qiao M., Kagan R.D., et al. (2016) Two pairs of ON and OFF retinal ganglion cells
are defined by intersectional patterns of transcription factor expression. Cell Rep 15:1930– 1944
72. Zhang Y., Kim I.-J., Sanes J.R., et al. (2012) The most numerous ganglion cell type of the mouse retina is a selective feature detector. Proc Natl Acad Sci 109:E2391–E2398
73. Joesch M., Meister M. (2016) A neuronal circuit for colour vision based on rod–cone opponency. Nature 532:236–239
74. Wei W., Elstrott J., Feller M.B. (2010) Two-photon targeted recording of GFP-expressing neurons for light responses and live-cell imaging in the mouse retina. Nat Protoc 5:1347–1352 75. Sterratt D.C., Lyngholm D., Willshaw D.J., et al. (2013) Standard anatomical and visual space
for the mouse retina: Computational reconstruction and transformation of flattened retinae with the Retistruct package. PLoS Comput Biol 9
76. Sabbah S., Gemmer J.A., Bhatia-Lin A., et al. (2017) A retinal code for motion along the gravitational and body axes. Nature 546:492–497
77. Schlichtenbrede F.C., Mittmann W., Rensch F., et al. (2009) Toxicity assessment of intravitreal triamcinolone and bevacizumab in a retinal explant mouse model using two-photon
microscopy. Invest Ophthalmol Vis Sci 50:5880–7
78. Lin M.Z., Schnitzer M.J. (2016) Genetically encoded indicators of neuronal activity. Nat Neurosci 19:1142–53
79. Bethge P., Carta S., Lorenzo D.A., et al. (2017) An R-CaMP1.07 reporter mouse for cell-type-specific expression of a sensitive red fluorescent calcium indicator. PLoS One 12:e0179460 80. Davidson B.L., Breakefield X.O. (2003) Neurological diseases: Viral vectors for gene delivery to
the nervous system. Nat Rev Neurosci 4:353–364
81. Vandenberghe L.H., Auricchio A. (2012) Novel adeno-associated viral vectors for retinal gene therapy. Gene Ther 19:162–8
32 indicators. Science 96333:1888–91
83. Dalkara D., Byrne L.C., Klimczak R.R., et al. (2013) In vivo-directed evolution of a new adeno-associated virus for therapeutic outer retinal gene delivery from the vitreous. Sci Transl Med 5:189ra76-189ra76
84. Lavis L.D. (2017) Teaching old dyes new tricks: Biological probes built from fluoresceins and rhodamines. Annu Rev Biochem 86:825–843
85. Tada M., Takeuchi A., Hashizume M., et al. (2014) A highly sensitive fluorescent indicator dye for calcium imaging of neural activity in vitro and in vivo. Eur J Neurosci 39:1720–1728 86. Chang L., Breuninger T., Euler T. (2013) Chromatic coding from cone-type unselective circuits
in the mouse retina. Neuron 77:559–571
87. Wang Y. V, Weick M., Demb J.B. (2011) Spectral and temporal sensitivity of cone-mediated responses in mouse retinal ganglion cells. J Neurosci 31:7670–7681
88. Healy K., McNally L., Ruxton G.D., et al. (2013) Metabolic rate and body size are linked with perception of temporal information. Anim Behav 86:685–696
89. Lamb T.D. (1995) Photoreceptor spectral sensitivities: Common shape in the long-wavelength region. Vision Res 35:3083–3091
90. Denk W., Svoboda K. (1997) Photon upmanship: Why multiphoton imaging is more than a gimmick. Neuron 18:351–357
91. Lyubarsky A.L., Daniele L.L., Pugh Jr. E.N. (2004) From candelas to photoisomerizations in the mouse eye by rhodopsin bleaching in situ and the light-rearing dependence of the major components of the mouse ERG. Vis Res 44:3235–3251
92. Luo D.G., Xue T., Yau K.W. (2008) How vision begins: An odyssey. Proc Natl Acad Sci U S A 105:9855–9862
93. Gray-Keller M., Denk W., Shraiman B., et al. (1999) Longitudinal spread of second messenger signals in isolated rod outer segments of lizards. J Physiol 519 Pt 3:679–692
94. Mank M., Reiff D.F., Heim N., et al. (2006) A FRET-based calcium biosensor with fast signal kinetics and high fluorescence change. Biophys J 90:1790–1796
33
Figure Legends
Fig. 1 Retina and retinal labelling. (a) Schematic cross-section of a mammalian retina (c, cone photoreceptor; r, rod photoreceptor; h, horizontal cell; b, bipolar cell; a, amacrine cell; g, retinal ganglion cell; OS+IS, outer and inner segments; ONL, outer nuclear layer; OPL, outer plexiform layer; INL, inner nuclear layer; IPL, inner plexiform layer; GCL, ganglion cell layer; NFL, nerve fibre layer). The following panels illustrate methods for labelling retinal neurons (for details, see text): (b) Top view of rabbit starburst amacrine cell (SAC) injected with the synthetic Ca2+ indicator OGB-1. (c) Whole-mount retina of transgenic mouse expressing tdTomato (red) in starburst amacrine cells (SACs), and ubiquitously expressing the genetically encoded Ca2+ biosensor GCaMP6f (green) introduced by viral infection. The tissue was counterstained with sulforhodamine (SR101, red), here visualizing the blood vessels (cf. Fig. 3). (d) Scan of the axon terminal system of a bipolar cell filled with Alexa 555 (red) via a sharp electrode in the flat-mounted mouse retina, with the iGluSnFR staining overlaid in green. (e) Retinal slice from HR2.1:TN-XL mouse line with cones expressing the Ca2+ biosensor TN-XL. (f) iGluSnFR sparsely expressed under the RibeyeA promotor labels both photoreceptors and bipolar cells in larval zebrafish in vivo (7 days post fertilisation, courtesy of T. Yoshimatsu, Univ. Sussex, Brighton, UK). (g1,2) Mouse retinal whole-mount electroporated with
OGB-1 (green) and counterstained with SROGB-10OGB-1 (red), here visualizing the vessels. (h) Retina from a same mouse line as in (c), with SACs expressing tdTomato (red) and bipolar cells sparsely loaded with OGB-1 (green) via dye incubation (courtesy of J. Diamond, NINDS, Bethesda, MA, USA; for protocol, see [34]). Scale bars: b, c, g2, h, 50 µm; d, e, 10 µm; g1, 300 µm; f, 20 µm. Panel (d) adapted from Franke et al. 2017 [24] with permission from Springer Nature. Panel (e) adapted from Baden et al. 2013 [59] with permission from Elsevier. Panel (g) adapted from Baden et al. 2016 [30] with permission from
Springer Nature
34 emitted from activity probe (green). Photoreceptors can get activated directly by the IR laser via single-photon (a) and two-photon events (b), as well as indirectly by emitted fluorescence in the visible range (c). Arrows indicate photon propagation direction, stars symbolise photoisomerisation events in the highlighted photoreceptor. Dotted line, focal plane of the scan
Fig. 3 Visualizing retinal structure. (a) Images at different depths of whole-mounted wildtype mouse retina recorded using a 2P microscope. The living, light-sensitive tissue was stained with SR101 to visualise retinal structure and blood vessels. Layers, depths and examples for retinal cells are indicated (a, amacrine cell; g, retinal ganglion cell; b, bipolar cell; arrows: 1,4,7, blood vessels; 2, ganglion cell axon bundles; 3, rod bipolar cell terminal; 5, rod bipolar cell soma; 6, cone pedicle; 8, rod spherule; NFL, nerve fibre layer; GCL, ganglion cell layer; IPL inner plexiform layer; INL, inner nuclear layer; OPL, outer plexiform layer; ONL, outer nuclear layer; OS+IS, outer and inner segments). (b) Vertical projection of stack from a ChAT:Cre x Ai9tdTomato mouse counterstained with SR101
illustrating the position of the choline acetyltransferase (ChAT) immunopositive bands (white) relative to blood vessels (red). Dashed lines mark IPL borders. (c) Average depth profiles of blood vessels (red) and ChAT bands (black; ± 1 s.d. shading). Scale bars: a, 20 µm; b, 10 µm. Panels (b) and (c) modified from Franke et al. 2017 [24] with permission from Springer Nature
35 responses in/at axon terminals of different On cone bipolar cell types measured with the Ca2+
biosensor GCaMP6f ([6]; floxed AAV construct in PcP2Cre mouse line) and iGluSnFR (ubiquitous AAV-mediated expression), respectively. (d) Somatic Ca2+ response of a starburst amacrine cell measured using OGB-1 introduced by bulk electroporation [31]. (e) Dendritic Ca2+ signals of an RGC injected with OGB-1 using a sharp electrode (1st row) and somatic Ca2+ responses recorded in RGCs using GCaMP6f (ubiquitous AAV-mediated expression, 2nd row), and OGB-1 (bulk electroporation; 3rd row). Panels (a; top), (b), and (e; top) courtesy of S. Pop, Y. Ran, and C. Chapot, respectively (all:
Univ. Tübingen, Germany)
Fig. 5 Optical pathways. (a) Overview of optical pathways in a 2P microscope equipped with a light stimulator designed for chromatic stimulation of mouse retina. For simplicity, most lenses and some silver mirrors (M) were omitted (for a complete description, see [3]). Excitation/detection pathway: The laser (dashed red line) passes a cold mirror (CM), dichroic mirror 1 (DM1, here the mouse version, DM1mouse), and the objective lens, before exciting the probe in the recording chamber. Fluorescence emitted from the probe (red/green lines) is reflected by DM1 into the detection head containing two GaAsP photomultiplier tubes (PMT), each equipped with a band pass (BP) filter. Stimulus pathway: Light from a green and a UV LED are combined (DM3,4), illuminating a digital
36 divided into two sections: one for acquiring pixel data (blue) and one for allowing the scan mirrors to move to the start of the next line (“retrace”; orange). Bottom: Signal generated by the scan software (“blanking”; top) to synchronise laser and stimulus LEDs: During retrace, laser power is blanked
(centre; e.g. by a Pockels’ cell), while LEDs are turned on (bottom). Schematic in (a) adapted from Euler et al. 2008 [3] with permission from Springer Nature
Fig. 6 Two-photon effects. (a) Schematic cross-section of a whole-mount retina, illustrating scan size and focal planes of light stimulus (yellow) and scanning excitation laser (red). (b)
Electrophysiological cell-attached recording of a rabbit ON-OFF ganglion cell, with traces showing spiking response to a 200-µm light spot alone (left), and during laser scanning (right; λ=927 nm) for increasing background intensities (IBkg). Note the cell’s responses to both laser scanning start and end. (c) Schematic cross-section of an imaging in a retinal slice. (d) Ca2+ signals recorded in axon terminals of mouse cone photoreceptors (slice preparation) exclusively expressing the ratiometric Ca2+ biosensor TN-XL [4, 95] (all traces represent averages of n=8 cells). Top: Traces of light stimulus (yellow) and scanning laser power (red; λ=860 nm). Centre: Fluorescence signals of the two TN-XL
fluorophores, citrine (green) and ECFP (cyan); lower trace pair represents background fluorescence measured outside the photoreceptors. Bottom: ratiometric signal (black), as reported by TN-XL, representing the Ca2+ level in the terminals. Reducing the laser power (1) elicited a transient in the ratio signal. Turning on the light stimulator (2) evoked a strong decrease in Ca2+(=light response). Cones responded strongly to bright and dark flashes (3) but barely to “flashes” in scanning laser
power. Laser “flashes” are strongly reflected in citrine and ECFP fluorescence, but hardly in the ratio