http://innove.org/ijist/ 29
Two-Dimension MUSIC Algorithm Using
Uniform Circular Array
Mohammed Amine Ihedrane
Material and Instrumentation (MIN), Electrical Engineering Department, High school of technology ESTM,
Moulay Ismail University Meknes,Morocco [email protected]
Seddik Bri
Material and Instrumentation (MIN), Electrical Engineering Department, High school of technology ESTM,
Moulay Ismail University Meknes,Morocco [email protected]
Abstract—Smart antenna has been widely used in many applications such as radar, sonar and wireless communication systems; they can increase system capacity and reduce co-channel interference or deployment and implementation of information and communication technologies in the Smart Cities. In this article expounds in detail how to obtain Direction of Arrival (DOA) information using Multiple Signal Classification (MUSIC) algorithm with Uniform Circular Arrays (UCA) based on theoretical analysis of receiving spatial signal by reconstruction of the data matrix. The results presented were compared with the experimented measures prove that our proposed method is accurate and original.
Key words—MUSIC, DOA, UCA, Smart antenna, Smart Cities
I.INTRODUCTION
In wireless communications, smart antenna has been widely used in much variety of applications such as mobile communications, sonar, and seismology [1].Considerable research efforts have been made to estimate the direction of arrival (DOA) and various array signal process techniques for DOA estimation have been proposed. The DOA estimation for uniform circular arrays (UCAs) has been developed in these scenarios, which desired all-azimuth angle coverage. By the virtue of their geometry, UCAs are able to provide 360°of coverage in azimuth plane. Moreover, they are known to be is isotropic. That is, they can estimate the DOA of incident signal with uniform resolution in the azimuth plane. In addition, direction patterns synthesized with UCAs can be electronically rotated in the plane of the array without significant change of beam shape [3].
The smart cities need infrastructural development and housing plan by using smart technologies for the comfortable life of the people [2]. While developing smart cities, there are many issues that need to be considered, such as population, culture, technology and growth. The main issue, however, is the high population of a city. It needs to analyze the impact of traffic and health monitoring systems. GPS has limitations such as selective availability and anti-spoofing. Instead of using GPS [4], an IRNSS constellation can be used to improve the quality of service wider availability across the regions.
DOA estimation uses antenna arrays. It is known that antenna radiation main lobe beam width is inversely proportional to the number of elements in antenna. So, if we consider a single antenna then array pattern will be wider and the resolution cannot be good. Instead of using single antenna, an antenna array system is used in DOA estimation which will improve the resolution of the received signals (Resolution in DOA estimation is the ability to distinguish two signals arriving at different angles). An array system has a multiple elements distributed in space [3].
One major limitation of this method is poor resolution that is its ability to separate closely spaced signals. Unlike conventional methods, subspace methods exploit the information of the received data resulting in high resolution. Two main subspace based algorithms are Multiple Signal Classification and Estimation of Signal Parameters via Rotational Invariance Techniques.
The DOAE of a signal is an effective approach for developing the received signal quality using smart antennas, which consist of a large number of antennas along with signal processing algorithms to improve the received signal and determine the DOAE from the signal quality point of view. The antenna can be arranged 2D as a linear/circular array, or 3D as cubic/spherical array. This antenna array is used for information transmission in a certain area or to estimate the DOA of a signal. Thus, the received signal quality enhancement is based on the performance of the employed method that used in the DOA of the signal. The DOAE algorithms are complex, where their performance relies on several parameters, namely the position, the used number of antennas, the antenna directivity, the spacing between the antennas within the array, the number of signal samples in the DOA estimation process.
Vol.2 No.2, 2018
http://innove.org/ijist/ 30
Techniques) and the MUSIC (Multiple SIgnal Classification), maximum likelihood techniques, integrated techniques and local polynomial approximation beam-former [6-11].
These algorithms give information about number of incident signals and DOA of each signal. Maximum likelihood method is one of the first techniques to be investigated for DOA estimation but has the drawback of intensive computational complexity [5].
The MUSIC algorithm is widely applied and has high resolution in array signal processing and DOA estimation, which utilizes the Eigen-structure of the data covariance matrix of the receive array to obtain the cost function. In conventional subspace approaches in MIMO radar system, we usually assume that the number of array elements remains fixed and the number of snapshots is large which could be infinity. In such situation, the statistic covariance matrix of the observed signals could be substituted by their sample covariance matrix (SCM) to obtain accurate target parameters. However, in large MIMO radar system [6-8] in which the number of the transmitter and receiver array elements is so large that the number of observations is unable to satisfy the demand given above. Since the observation matrix could be regarded as a large dimensional random matrix for large MIMO radar system, it is feasible to analyze the problem of parameter estimation using the asymptotic spectrum theory of large-dimensional random matrix as a mathematical tool [10-11].
This article expounds in detail how to obtain DOA information using a modified MUSIC algorithm through re-construction data matrix with conjugate data.The comparison between proposed method and the experimented one. The proposed method can solve the problem of coherent signals and estimate clearly the direction of arrival.
II. SYSTEM MODEL AND THE PRINCIPLE OF MUSIC ALGORITHM Multiple Signal Classification (MUSIC) method [12] is widely used in signal processing applications for DOA [13] estimation. It is applied to only narrow band signal sources i.e., frequencies of interest are narrowband [14-15-16]. Consider M number of narrow band signal sources arriving from different angles θi=1, 2…M, impinging on a uniform linear array of N equis-paced array elements (Where N > M) as shown in fig.1. At different instants of time t, t=1, 2 … K, where K being the number of snapshots, the array output will consist of signal along with noise components [9].
Fig.1. Uniform circular array geometry
The received array signal can
X(t) = AS(t) + N(t) () Where A=[a(θ1,),…,a(θM,)] is a matrix of the M steering
vectors, which represents the possible value set of DOA and a(θ1,φ1) [e
j2πr
λcosθm, … , ej2π r λcos (θm−
2π(N−1)
N )]and S=[S1(t),…,SM(t)]T is a signal source vector of size ( M×1). Where the statistical expectation is denoted by E [ ] and [ ]T denote transpose of
signal vector. The correlation matrix of received vector can be written as:
Rx = E[XXH] ()
= E[ASSHAH] + E[WWH]
= AVAH+ σ²I
= Rs+ σ²I
Whereσ² is the variance of white Gaussian noise vector (W) Whereσ² is the variance of white Gaussian noise vector (W), V is covariance matrix of signal vector (S) which is a full rank matrix of order M×M given by,
V = E[SSH] ()
=
[
E[|S1|2] ⋯ … 0
0 E[|S2|2] … 0
⋮ ⋱ … ⋮
0 0 … E[|SM|2]]
RSis a signal covariance matrix of order (N×N) with rank
M given by:
Rs =
[
E[|S1|2] ⋯ … 0 … 0
0 E[|S2|2] … 0 … 0
⋮ ⋱ … ⋮ . . 0
0 0 … E[|SM|2] . . 0
0 0 … 0 … 0]
()
So RS, has N-M eigenvectors corresponding to zero eigen
values. We know that steering vector a(θ1,) which is in the
signal subspace is orthogonal to noise subspace let Qnbe such
an eigenvector.
RSQn= AVAHQn= 0 (5)
Since V is a positive definite matrix:
aH(θi)Qn= 0 (6)
This implies that signal steering vectors are orthogonal to eigen vector corresponding to noise subspace. So the MUSIC algorithm searches through all angles and plots the spatial spectrum:
PMUSIC(θ) =
1
(aH(θ)QnQnHa(θ)) (7) Assuming the number of signals M is known. Given the data set X (k), k = 1, 2. . . K, the MUSIC algorithm proceeds as the following steps:
•Compute the sample covariance matrix R.
•Compute its eigen values λ1≥λ2≥ ⋯ ≥λN and the
corresponding eigenvectorsQ1, Q2…,Qn then Qn=
http://innove.org/ijist/ 31
•We plotPMUSIC(θ) for −π/2 <θ< π/2
•Choose the M minimum of PMUSIC(θ) to estimate(θ)
III.2-DMUSIC ALGORITHM
MUSIC is an acronym which stands for Multiple Signal Classification. This approach was first posed by Schmidt [9]. It is well known for the implementation simplicity as well as the capability of estimating DOA in much higher resolution than any other conventional algorithms [12-16].
We assume that there are N uniform circular array, M narrow band far field signals from different incident direction. The radius of the circular array is denoted as r and wavelength of narrow band is denoted as λ. The incident angle of the signals is shown in fig.2.
Fig.2. Uniform circular array geometry
The received array signal can
X(t) = AS(t) + N(t) () Where A=[a(θ1,φ1),…,a(θM,φM)] is a matrix of the M
steering vectors, which represents the possible value set of
DOA and a(θ1,φ1) [e j2πr
λsinФmcosθm, … , ej2π r
λsinФmcos (θm− 2π(N−1)
N )]and S=[S1(t),…,SM(t)]Tis a signal source vector of size ( M×1).
Where the statistical expectation is denoted by E [ ] and [ ]T denote transpose of signal vector.
The correlation matrix of received vector can be written as: Rx = E[XXH] ()
= E[ASSHAH] + E[WWH]
= AVAH+ σ²I
= Rs+ σ²I
Whereσ² is the variance of white Gaussian noise vector (W), V is covariance matrix of signal vector (S) which is a full rank matrix of order M×M given by,
V = E[SSH] ()
=
[
E[|S1|2] ⋯ … 0
0 E[|S2|2] … 0
⋮ ⋱ … ⋮
0 0 … E[|SM|2]]
RSis a signal covariance matrix of order (N×N) with rank
M given by:
Rs =
[
E[|S1|2] ⋯ … 0 … 0
0 E[|S2|2] … 0 … 0
⋮ ⋱ … ⋮ . . 0
0 0 … E[|SM|2] . . 0
0 0 … 0 … 0]
()
So RS, has N-M eigenvectors corresponding to zero eigen
values. We know that steering vector a(θ1,φ1) which is in the
signal subspace is orthogonal to noise subspace let Qnbe such
an eigenvector.
RSQn= AVAHQn= 0 (12)
Since V is a positive definite matrix:
aH(θi, φi)Qn= 0 (13)
This implies that signal steering vectors are orthogonal to eigenvector corresponding to noise subspace. So the MUSIC algorithm searches through all angles and plots the spatial spectrum:
PMUSIC(θ,φ) =
1
(aH(θ,φ)QnQnHa(θ,φ)) (14)
IV.
THE PROPOSED ALGORITHM
In order to have a better estimation of direction of arrival, we have proposed a modified algorithm based on the reconstruction of the received signal the modified algorithm; where the data matrix is:
Y = T X∗ ()
The ‘*’ represents complex conjugate of the received signal described above, T is an N order inverse identity matrix which is called transition matrix. The covariance matrix of the data Y is
RY = TRX∗ T ()
We introduce a new array covariance matrix, which is the sum of RY and Rx
R = RY+ RX ()
= ARsA+ T[ARsA]∗ T + 2 σ²I
According to matrix theory, if q is an eigenvector corresponding to a zero eigenvalue of matrix ARSA, then q
must also be an eigenvector correspond to the zero eigenvalue of matrix T [ARSA]*T . We observe that matrix Rx, RY and R
have the same noise subspace. By performing eigenvalue decomposition with R, we get its eigenvalues and its eigenvectors. According to the estimated number of signal sources, the noise subspace among the eigenvectors can be distingue.
With the new noise subspace, we can construct MUSIC spatial spectrum
PMUSIC(θ,φ) =
1 (A(θ,φ)Hq
nqnHA(θ,φ))
(18)
V.SIMULATIONANDCOMPARATIVERESULTS
Vol.2 No.2, 2018
http://innove.org/ijist/ 32
along both x and y axis to assess the performance of the proposed estimator. It is assumed that there are M = 3 sources at angles (10°, 20°) (30°, 35°) and (40°,150°) are implying on the array from far-field[22] .A uniform circle array (UCA) with five antennas, radius r=124 mm. the radiation source is pulse signal and the distance between the radiating antenna and the direction finder receiving antenna approximately is 8 m. The carrier frequency is 6 GHz. And according to the estimated received signal, the receiving data SNR is above 20 dB according to [23], a 4x4 planar antenna array with 0.5 λ element spacing for [24] and UCA with 8 antenna element, 2 source and noise = 12 dB, with BPSK modulation ,the search step of MUSIC is 0.1° and the noise intensity is -12dB according to [25] .
Fig.3. Proposed method simulation for azimuth φ and elevation𝜃 (10°, 20°) (30°, 35°) and (40°, 150°)
Fig.3 plots the spectrums of three functions including 2D-MUSIC, RD-MUSIC [22], and the proposed estimator. It is seen from the figures that the proposed method estimates Ψ correctly, which generates corresponding peaks at Ψ1= sin (θ1)
cos (φ1) = sin (10) cos (20) ≈0.16, Ψ2= sin (θ2) cos (φ2) = sin
(30) cos(35) ≈ 0.41and Ψ3= sin(θ3) cos(φ3) = sin(40) cos(150)
≈ −0.56as expected. This indicates that 𝜓can be estimated by the method with 1D spectral search efficiently. Therefore, the proposed method has a much lower complexity as compared to 2D-MUSIC.
In fig.4, we note that the proposed can resolve clearly the
azimuth φ and elevation 𝜃 (133.6°, 137.8°) and (78.6°, 82.4°) respectively and the peaks are sharp, while
the Music only fond one peak around there. To confirm the first simulation result, another simulation showed in Fig.3, using unequal power signal arriving at azimuth and elevation are (128.4°, 116°) and (78°, 84°), so the fig.4 confirm that the proposed Music algorithm can resolve clearly the angles(θ,φ) and the peaks become Sharp.
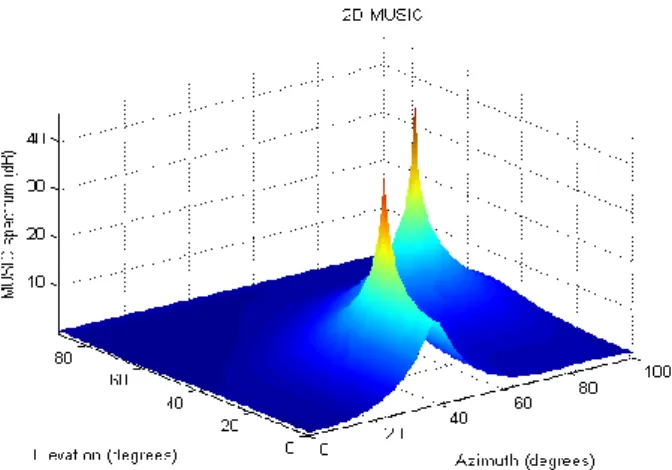
From the simulation results shown in Fig.5 and Fig.6, both of the two algorithms can get a correct estimation of the direction angle of independent signals. Because of re-constructing the data covariance matrix in the modified algorithm, which is equivalent to utilize the information of the data one more time, the peak of spectrum becomes sharper and the precision is higher [24].
Fig.6shows that angles have the same values but the proposed method presents a good magnitude for angles (99.48°, 50.13°); (64.88°, 15.1°) , the magnitude is 40.15 dB, 38.84dB respectively. We resolved that the proposed method can detect, estimate the DOA clearly and present an efficient magnitude with +0.24% for angles (99.48° ,50.13°) and +0.02% for angles (64.88° ,15.1°) compared to result given in [25].
Fig.4. Proposed method simulation for azimuth φ and elevation 𝜃 (133.6°, 137.8°) ; (78.6°, 82.4°)
http://innove.org/ijist/ 33
TABLE.1.COMPARATIVE RESULT FOR DIFFERENT RADIUS
TABLE.2.COMPARATIVE RESULT FOR DIFFERENT SIGNALS
TABLE.3.COMPARATIVE RESULT FOR DIFFERENT ANGLES
Fig.6. Proposed algorithm for azimuth and elevation (99.48°, 50.13°); (64.88°, 15.1°)
Table.1 show that even if the values of number radius change, the proposed method give a higher precision and value of peaks, contrary to experimented one, it cannot detect all angles even if number of signals increases. Results indicate that proposed method MUSIC based on UCA does not have a problem of aperture vagueness.
Table.2 illustrates the results of the comparison between proposed method and Music method indicate at [24]. It can be seen that the proposed method estimates three DOA more accurately while the experimented one cannot detect angles when the number of signals exceeds 2. The proposed one gives a less error margin to estimate DOA.
In the next steep, we Compare our results with experimented one indicated in [26] in the same conditions.
The fig .7 show that the peaks in the spectrum are located at angles ( 90.4° ;120°) which are very close to the true angles, moreover, the MAE (mean absolute error) is 0.6° which is less than the MAE given in [26].Table 3 summarizes the results of five different experiments for passive objects, carried out in the three The overall MAE is 0.3° over all the passive experiments, indicating a very good accuracy.
Fig.7. DOA for angles (90°; 120°)
Radius Pm (°) [24](°) Error
[24](°)
Error Pm (°)
0.1 λ 57.100000 57.100002 +0.10002 +0.10002
0.5 λ 57.100004 57.100004 +1.00004 +1.00004
0.8 λ 56.900000 56.900002 -1.90002 -1
1.0 λ 57.000000 57.000004 +0.00004 0
Signal 𝜽
𝒊𝒏° 𝜽𝒐𝒖𝒕° 𝜟𝜽𝒐𝒖𝒕° 𝝋𝒊𝒏° 𝝋𝒐𝒖𝒕 ° 𝜟𝝋𝒐𝒖𝒕°
1
[24] 78
84
78.5 82.5
+0.0064 0
128.4 116.0
129.5 117
+0.0082 +0.0086
Pm 78
84
78 84
0 0
128.4 116.0
128.1 116.2
-0.0023 +0.0017
2
[24] 77.0
85.8
76.0 86.5
-0.0065 0
128.2 120
129.5 121.5
77.0 85.8
Pm 77.0
85.8
77.0 85.8
0 0
128.2 120
128.2 120.1
00 +0.0008
[24] 78.6 82.4 0 0 -1 -1 133.6 137.8 0 0 -1 -1
Pm 78.6
82.4
79.0 85.4
+0.005 +0.036
133.6 137.8
134 137
+0.0029 -0.0028
Angle of arrival
(𝜃°)
Angle (𝜃°)
[26]
Estimated angle by proposed method (𝜃°)
[90 120] [92.35 124.2] [90.40 124]
[90 110] [89.14 111.4] [90.40 109.90]
[45 90] [42.18 80.14] [45 89.52]
[45 69 90] [46.65 64.88 86.66] [44.93 69.57 89.70]
MAE 2.99° 0.3°
Vol.2 No.2, 2018
http://innove.org/ijist/ 34
VI.CONCLUSION
Modern society has a firm foundation of science and technology, which plays a key role for economic growth. This study has introduced the 2-D DOA estimation algorithm for Uniform circular array. The MUSIC uses the eigen values and eigen vectors of the signal and noises to estimate the direction of arrival of the incoming signals. It becomes easier to separate the signals from noise as the eigen vectors for signal and noise subspace are orthogonal to one another. It works efficiently when the signals that are being incident on the array of sensors are non-coherent. Efficiency of this estimation algorithm can be improved by increasing the inter element spacing, increasing the number of antenna sensors, number of snapshots and improving the incidence angle difference between the incoming signals. The results presented and compared with experimentations cases demonstrated the effectiveness of our used algorithms witch give an accuracy values of the DOA using two-Dimension MUSIC for uniform circular array. Future research works is to validate this proposed method in complex environments and to verify them for industrials applications as the intelligent sensors.
REFERENCES
[1] H. Krim and M. Viberg, “Two decades of array signal processing research: the parametric approach,” IEEE Sign. Proc. Magn, vol. 13, pp. 67-94, 1996.
[2] C. Thiripurasundari , V. Sumathy , C. Thiruvengadam. “An FPGA implementation of novel smart antenna algorithm in tracking systems for smart cities”. vol.2, pp.1-8, 2017.
[3] LC Godara. “Application of Antenna Arrays to Mobile Communications Part II: Beam-forming and Direction of Arrival Consideration,” IEEE Proc. pp.1195-1245, 1997.
[4] Hedley, R. W., Y. Huang, and K. Yao. “Direction-of-arrival estimation of animal vocalizations for monitoring animal behavior and improving estimates of abundance”. Avian.Conse Eco.vol.12, no.6, pp.3-16,2017.
[5] B.Liao and S.C. Chan. “DOA Estimation of Coherent Signals for Uniform Linear Arrays with Mutual Coupling,”IEEE Proc. Inter. Symp. Circ. Syst. Rio de Janeiro, Brazil,pp. 377-380, 2011.
[6] M. Jalali, M. N. Moghaddasi and A. Habibzadeh. “Comparing accuracy for ML, MUSIC, ROOT-MUSIC and spatially smoothed algorithms for 2 users,” IEEE Proc. confe. Medit. Micro. Symp. (MMS). Tangiers, Morocco, pp.1-5, 2009.
[7] J.G.Nam , S.H.Lee and K.K.Lee. “2-D Nominal Angle
Estimation of Multiple Coherently Distributed Sources in a Uniform Circular Array,” IEEE ante.wire.prop.lette, vol. 13, pp. 415-418.2014.
[8] S.S.Balabadrapatruni,Performance Evaluation of Direction of Arrival Estimation Using Matlab, Signal & Image Processing. Int. J; vol3, pp.57-72. 2012
[9] R. O. Schimd. “Multiple emitter location and signal parameter estimation,” IEEE Trans. Anten. Propag, Vol. 34, pp. 276–280, 1986.
[10] Z. Wang and S. A. Zekavat, “Manet localization via multi-node TOA-DOA optimal fusion,” in Proc. Milcom, 2006, pp. 542– 548.
[11] O. Salychev, “Inertial systems in navigation and geophysics,” Bauman Moscow State Technical University Press, Tech. Rep., 1998.
[12] M.A. Ihedrane, S.Bri and El.F.Adiba. “High Resolution Method Using Patch Circular Array,” International Journal of Electrical and Computer Engineering (IJECE).Vol.7.no4.2017.
[13] M. A. Ihedrane and S. Bri, “Direction of arrival estimation using MUSIC, ESPRIT and maximum-likelihood algorithms for antenna arrays,” Walailak J. Sci. Tech., vol. 13, no. 6, pp. 491– 502, 2015.
[14] M. R. Yuce, G. Alici and T. D. Than, Wireless Endoscopy - Encyclopedia of Electrical and Electronics Engineering. Wiley, 2014.
[15] [21] S. Yun, K. Kim and S. Nam, “Outer-wall loop antenna for ultra-wide band capsule endoscope system,” IEEE Antennas Wireless Propag. Lett., vol. 9, pp. 1135–1138, 2010.
[16] K. Kim, S. Yun, S. Lee, S. Nam, Y. J. Yoon and C. Cheon, “A design of a high-speed and high-efficiency capsule endoscopy system,” IEEE Trans. Biomed. Eng., vol. 59, no. 4, pp. 1005– 1011, 2012.
[17] K. Arshak and F. Adepoju, “Adaptive linearized methods for tracking a moving telemetry capsule,” in Proc. ISIE, 2007, pp. 2073–2708.
[18] M. Fischer, R. Schreiber, D. Levi and R. Eliakim,“Capsule endoscopy: the localization system,” Gastrointestinal Endoscopy Clinics of North America, vol. 14, pp. 25–31, 2004.
[19] J. Bulat, K. Duda, M. Duplaga, R. Fraczek, A. Skalski, M. Socha, P. Turcza and T. P. Zielinski. “Data processing tasks in wireless GI endoscopy: image-based capsule localization and navigation with video compression,” in Proc. EMBS, 2007, pp. 2815–2818.
[20] G. Mao, B. Fidan, and B. Anderson. “Wireless sensor network localization techniques.” Computer Networks.vol.51, no.10 ,pp. 2529–2553.2017.
[21] A. R. Nafchi, S. T. Goh, S. A. R. Zekavat, “High performance DOA/TOA-based endoscopy capsule localization and tracking via 2D circular arrays and inertial measurement unit,” In Wireless for Space and Extreme Environments (WiSEE), 2013 IEEE International Conference on (pp. 1-6), 2013.
[22] J.He,M. N. S. Swamy, and M.O.Ahmad, “Joint DOD and DOA
estimation for MIMO array with velocity receive sensors,” IEEE Signal Processing Letters, vol. 18, no. 7, pp. 399–402, 2011 [23] W. J. SI, X.Y. LAN and Y. ZOU. “Novel high-resolution DOA
estimation using subspace projection method”J. Chi. Uni. Pos. Tel, Vol.19, pp.110-16, 2012.
[24] T. Varum, J. N. Matos and P. Pinho.”Direction of Arrival Estimation Analysis Using a 2D AntennaArray,” Proce. techn , Vol 17, pp.667-624,2013.
[25] B.Sun. “MUSIC Based on Uniform Circular Array and Its Direction Finding Efficiency,”Inte.J.Sign.Proce.Syst, Vol 1, pp.273-277, 2013.