Please cite this article as: R. Soofifard, M. Gharib, A New Approach to Project Risk Responses Selection with Inter-dependent Risks, International Journal of Engineering (IJE), TRANSACTIONS B: Applications Vol. 30, No. 5, (May 2017) 720-728
International Journal of Engineering
J o u r n a l H o m e p a g e : w w w . i j e . i rA New Approach to Project Risk Responses Selection with Inter-dependent Risks
R. Soofifard*a, M. Gharibb
aTraining and Human Resourse Development Department, Research Institute of Petroleum Industry, Tehran, Iran b Faculty of Fouman, College of Engineering, University of Tehran, Fouman, Iran
P A P E R I N F O
Paper history:
Received 23 January 2017
Received in revised form 22 February 2017 Accepted 10 March 2017
Keywords: Risk Response Project Risk Management Risk Interactions
Multi-objective Harmony Search Algorithm
A B S T R A C T
Risks are natural and inherent characteristics of major projects. Risks are usually considered independently in analysis of risk responses. However, most risks are dependent on each other and dependent risks are rare in the real world. This paper proposes a model for proper risk response selection from the responses portfolio with the purpose of optimization of defined criteria for projects. This research has taken into account the relationships between risk responses; especially the relationships between risks, which have been rarely considered in previous works. It must be pointed out that not considering or superficial evaluation of the interactions between risks and risk responses reduces the expected desirability and increases project execution costs. This model is capable of optimization of different criteria in the objective function based on the proposed projects. Multi-objective Harmony Search (MOHS) is used to solve this model and the numerical results obtained are analyzed.
doi: 10.5829/idosi.ije.2017.30.05b.12
1. INTRODUCTION1
With the increasing demand for energy on a world-wide basis, there is a shortage of power in most countries whilst the demand seems to be in a never-ending upward spiral. Power is the lifeblood of any nation, especially in the current times when power consumption is increasing while power generation is not able to keep up with this demand in most countries. As a result, thermal power plants remain an indispensable ingredient in the mix of power units of a country [1]. Therefore, Energy Project Risk Management is an important issue for interested researchers in the field. PRM generally consists of three phases [2]: risk identification, risk analysis and risk response. Risk analysis refers to identification of documentation of the related risks. Risk assessment deals with the examination of identified risks, correction of risk descriptions and estimation of the effects and the corresponding possibilities. Risk response is associated with identification, assessment, selection and execution of necessary measures in order to decrease the likelihood of risks and their negative
*Corresponding Author’s Email: [email protected](R. Soofifard)
effects. Risks response plays a major role in the reduction of negative effects [3]. Appropriate risk response strategies ought to be able to carry out risk identification and analysis in execution of a project [4]. Therefore, risk response strategy is an important issue in PRM [5]. In other words, in the risk management process, risk response phase is the process of extending the alternatives and providing actions to enhance opportunities and mitigate threats to the project’s objectives [6]. However, little work has been done on risk response strategies, which are an important part of PRM. In the analysis of risk responses in order to select the response strategy, risks are considered independent [7]. However, risks are usually dependent and interact with one another [8]. In fact, the interactions between risks must be considered as an important part of risk analysis [9].
The objective of this work is introduction of an
optimal mathematical model considering the
maximizing the effects of execution of risk response strategies (by considering the cost, quality and the time of each strategy). In addition, the interaction between risks in decision-making is studied. It is understandable that interactions such as those between risk responses are effective on determination of risk response strategies. Furthermore, paying more attention to the interactions between risks can increase the expected benefit and lower execution costs. The interactions between risks and their responses have hardly been studied in previous works although these relationships are undeniable in the real world. Thus, in order to manage an oil and gas project the risks of which are dependent, it is important to form different risk dimensions and make a model of risk interactions in the PRM process. In order to express the real complexities of a project, risk interactions must be modeled using a network structure rather than an old list or tree structure. In this work, a structure has been proposed for modelling and analysis of risk network behavior to support project management decision-making. To analyze and assess the interactions between risks, Risk Structure Matrix Methods consisting of methods such as Design Structure Matrix (DSM) and Analytic Hierarchy Process (AHP) are used. The reason for these calculations is supporting the decision makers in planning the corresponding risk response measures using a structured and repeatable approach. The second part of this paper reviews the prior art in the area of risk response. In the third part, the problem has been analyzed considering the relations between risks and risk responses, which have not yet been dealt with in the literature. The preparation of a risk structure matrix is explained in the fourth section and the fifth section presents the mathematical model. The results of calculations of the proposed algorithm is explained in details in the next section and conclusions have been made in the final part.
2. LITERATURE REVIEW
Project execution is always accompanied by risks and the studies on project risks and risk interdependence have always been the topics of concern in academia and practice. Some studies on the project risk interdependence from qualitative perspectives. Adner [10] points out that the success of a company's growth strategy hinges on the assessment of the ecosystem's risks of the company. The ecosystem is characterized by three fundamental types of risks: initiative risks, interdependence risks and integration risks. Dikmen et al. [11] have proposed training based approach for risk management and applied this tool to an ongoing construction and project because they believed that risk management was a task, which had to be performed
during the project life cycle. The case study proved that such tool could be used for storage and updating of the data related to the project and ultimately the evaluations following the project. The major weak point of this tool is identification of risks and their ranking trend as well as the reluctance of the employees for feeding the information concerning reasons for risks. Zoullouti et al. [12] have carried out some research on risk analysis of operating room using the fuzzy bayesian network model. Kwan and Leung [13] have proposed methods to estimate risks by taking into account of risk dependence effects, and risk response strategies. Focusing on risk dependences should also be developed. Pajares and Lopez [14] argue that new methodologies should be developed in order to deal with project-portfolio interactions in terms of risk, schedule or cash-flow. The approaches involved in the existing studies can be mainly classified into four categories [15]: the zonal based approach, the trade off approach, the WBS based approach and the optimization model approach. In the following, the brief descriptions and comments on these approaches will be given.
combinations of the strategies, the acceptable level of the loss of risks, the budget of implementing the strategies [5, 7, 23, 24] and so on.
The above approaches have made significant contribution to risk response strategy selection from different perspectives. According to studies, a limited research is accomplished on the relationship between risks and their responses and particularly the interactions between risks [25]. However, there are some limitations in the existing approaches. For example, only two criteria can be considered in the zonal based and trade off approaches, and there is lack of more precise mathematical solution to the problem in the trade off and WBS based approaches. In addition, all the approaches, except the WBS based approach, can just be applied to small scale projects, in which risk analysis is easily made to the whole project directly without the need for presenting the project's discrete work activities. Therefore, it is necessary to develop a new approach to project risk response strategy selection. In recent years, the approach based on Design Structure Matrix (DSM) [26], which represents relations and dependences among objects, has been developed [27-29]. The core of the approach is to capture and represent project risk interdependences by building up matrices. The approach mainly includes two steps. First, a binary matrix representing the existence of potential interdependence between each pair of risks is built. Secondly, the binary matrix is transformed into a numerical one to assess the strength of risk interdependence, in which the Analytic Hierarchy Process (AHP) [30] is used. Fang et al. [27] proposed a framework for risk response strategy selection considering that the risk interactions and the DSM method mentioned above are applied to identify the risk interactions. In their work, however, the effect of the risk interactions on the project risk response decisions is not analyzed, which produces a space guiding us to make deep thinking and conduct a further study in this aspect. In this study, we will try to fill this gap by proposing an optimization model for selecting risk response strategies and further analyze the effects of the risk interdependence on decisions about project risk response.
3. STATEMENT OF THE PROBLEM
Risk identification, usually the first step for project risk analysis, is the process of determining risk events, which could affect project objectives negatively or positively [31]. The risk interdependence is defined as the existence of a possible precedence relationship between two risks Ri and Rj [28, 32]. It should be noted
that in this paper, interactions between risks analyzed with risk structure matrix (RSM) will be explained. According to the literature review, a mathematical
model is developed here for selection of project risk responses. Different risks are considered for the oil and gas project activities, and different responses are selected for each risk. In addition, risk responses have not been considered individually, but are correlated. The selection of related responses can affect their influence on the project objectives. These effects can appear as positive or negative synergisms. If the specific numbers of related response sets are selected, the synergism (positive or negative) results will enhance the individual effect of each response. Different assessment criteria are considered in the objective function, which attempts to select responses for maximizing the amount of effects resulting from these criteria. If one criterion is considered, the problem will turn into a single objective mathematical model. Two or more assessment criteria will change the problem into a multi-objective mathematical model. In addition to the interaction between responses, different constraints are considered to create a balance among the selected responses. These constraints attempt to consider requisites prerequisites between the risk responses, and further prevent the selection of antithetic responses.
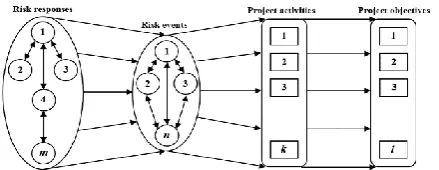
In this study, using the optimization model approach for selection of risk responses, first, a conceptual model for evaluation and selection of project risk responses is proposed, which clearly relates WBS, risk events, risk reduction actions, and their effects. It is necessary to consider the WBS as the relationship basis in order to establish a relationship between the risk response selection models and general project management system. The relationship is such that if a specific number of responses are selected, a positive or negative synergism will be activated between the responses. In other words, the WBS is an important basis in integration of a comprehensive project management system with other subsystems such as risk management. In the proposed model, it is attempted to select a set of responses such that the objective function is optimized in addition to meeting the system constraints (budget, technical dependences of responses, etc.). The objective is maximizing the expected desirable effects resulting from the risk responses (i=1, 2, …, m) on a number of desirable project objective criteria (L=1, 2, ..., l). The working elements are the same as the components of WBS and are represented as K=1, 2, …, k, and the risks are represented by j=1, 2, …, n. Risk responses interact with each other and are assumed to be independent. Risk events may negatively or positively affect one or more work activities. The relationship between risk events and responses and their effects on the project objectives are shown in Figure 1 [33, 34].
Figure 1. Proposed framework for selection of project risk responses considering the relationship between events and responses
The Design Structure Matrix (DSM) represents relations and dependencies among objects. The same objects are both in the rows and columns of the square matrix. The DSM was introduced by Steward [26] with tasks and was initially used basically for planning issues [36]. In order to build the RSM, the interactions between project risks have to be identified. The iterative procedure used is notably addressed in ongoing publications. Classically, the DSM is re-ordered in a way, which permits to show first level blocks, using the well established partitioning process [36]. In order to do so, firstly an AHP based evaluation is used to transform the RSM into a numerical matrix, which is to catch the strength of local interactions. In this paper, according to research conducted by Feng and Marle [27] risk structure matrix (RSM) to measure the interaction between the project risks in the model is used.
3. 2. Modeling The mathematical method developed in this paper intends to select proper responses for project risks. It is a multi-objective and Binary Integer Programming (BIP). The objective is maximizing the desirable affects of criteria in the projects. Sets, parameters and variables are defined as follows:
Sets:
i=1, 2, …, m
Risk responses
A={A1,A2,…,Am}
j=1, 2, …, n
Risks
B={B1,B2,…,Bn}
k=1, 2, …, K
Activities
W={W1,W2,…,WK}
l=1, 2, …, L
Assessment criteria (project objectives)
C={C1,C2,…,CL}
k=1, 2, …, K
Risks for activity k
Bk
j=1, 2, …, n
k=1, 2, …, K
The set of responses related to risk j for activity k. Its selection and implementation cause synergism of their effect on the jth risk.
Stjk
Parameters:
Maximum available budget for selection of risk responses
𝐵
The set of all pairs of strategies, which exclude each other
𝑀⃡
The set of all pairs of strategies, which cooperate with each other
𝑀̅
Cost required for implementation of the ith risk
𝑐𝑖𝑘
response for activity k
Variation in time of activity k if risk j occurs
𝑠𝑗𝑘
Improvement in the time of activity k if the ith risk response is implemented to control the jth risk
𝑠̃𝑖𝑗𝑘
Variation in time of activity k resulting from the synergism of risk responses related to the jth risk
𝑠𝑎
̃𝑗𝑘
Maximum allowable delay for activity k
ε𝑘
The quality of activity k affected by risk j
𝑞𝑗𝑘
The quality of activity k changed if the ith risk response is implemented to control the jth risk
𝑞̃𝑖𝑗𝑘
The quality of activity k changed resulting from the synergism of implementation of risk responses related to the jth risk
𝑞𝑎̃𝑗𝑘
Maximum allowable quality reduction for activity k
𝛿𝑘
Effect of the ith risk response effective on the jth risk for the kth activity on the lth criterion
𝐴𝑡𝑟𝑖𝑗𝑙𝑘
Synergism resulting from the risk responses related to the jth risk for the kth activity on the lth criterion
𝑔𝑗𝑙𝑘
Minimum risk responses selected for synergism for the jth risk and the kth activity
𝑚𝑗𝑘
Maximum risk responses selected for synergism for the jth risk and the kth activity
𝑀𝑗𝑘
Effect of the fth risk on jth risk within risk structure matrix
𝑅𝑁𝑀𝑓𝑗
Variables:
If the ith risk response is selected for the jth risk in the kth activity, it is 1, otherwise zero
𝑥𝑖𝑗𝑘
If synergism for the jth in the kth activity risk occurs, it is 1, otherwise zero
𝐿𝑀𝑗𝑘
Model:
Considering the parameters and variables of the problem, the Binary Integer Programming (BLP) model of this work is presented as follows:
𝑀𝑎𝑥 𝑧 =
∑ ∑𝑗∈𝐵𝑘(∑𝑖∈𝑆𝑡𝑗𝑘𝐴𝑡𝑟𝑖𝑗𝑙𝑘𝑥𝑖𝑗𝑘+
𝐾 𝑘=1
∑𝑓∈𝐵𝑘𝑅𝑁𝑀𝑓𝑗∑𝑜∈𝑆𝑡𝑓𝑘𝐴𝑡𝑟𝑜𝑓𝑙𝑘 𝑥𝑜𝑓𝑘) +
∑𝐾𝑘=1∑𝑗∈𝐵𝑘𝑔𝑗𝑙𝑘𝐿𝑀𝑗𝑘 , 𝑙 = 1,2, … , 𝐿
(1)
s.t. :
∑ ∑𝑘 𝑖∈𝑆𝑡𝑗𝑘𝑐𝑖𝑘 𝑚𝑎𝑥 𝑗𝑥𝑖𝑗𝑘≤ 𝐵 (2)
∑𝑗∈𝐵𝑘𝑠𝑗𝑘−
(∑ [∑ 𝑠̃𝑖𝑗𝑘𝑥
𝑖𝑗𝑘+ ∑𝑓∈𝐵𝑘𝑅𝑁𝑀𝑓𝑗∑𝑜∈𝑆𝑡𝑓𝑘𝑠̃𝑜𝑓𝑘 𝑥𝑜𝑓𝑘 +
𝑖∈𝑆𝑡𝑗𝑘
𝑗∈𝐵𝑘
𝑠𝑎̃𝑗𝑘𝐿𝑀𝑗𝑘]) ≤ 𝜀𝑘 , 𝑘 = 1,2, … , 𝐾
(3)
∑ 𝑞𝑗𝑘
𝑗∈𝐵𝑘 −
(∑𝑗∈𝐵𝑘[∑𝑖∈𝑆𝑡𝑗𝑘𝑞̃𝑖𝑗𝑘 𝑥𝑖𝑗𝑘+
∑𝑓∈𝐵𝑘𝑅𝑁𝑀𝑓𝑗∑𝑜∈𝑆𝑡𝑘𝑓𝑞̃𝑘𝑜𝑓 𝑥𝑜𝑓𝑘 + 𝑞𝑎̃𝑗𝑘𝐿𝑀𝑗𝑘]) ≤ 𝛿𝑘 ,
𝑘 = 1,2, … , 𝐾
(4)
∑𝑖∈𝑆𝑡𝑗𝑘𝑥𝑖𝑗𝑘− 𝑚𝑗
𝑘+ 1 ≤ 𝑀 × 𝐿𝑀
𝑗𝑘𝑚≤ ∑𝑖∈𝑆𝑡𝑗𝑘𝑥𝑖𝑗𝑘−
𝑚𝑗𝑘+ 𝑀 , 𝑘 = 1,2, … , 𝐾, 𝑗 = 1,2, … , 𝑛
(5)
𝑀𝑗𝑘− ∑𝑖∈𝑆𝑡𝑗𝑘 𝑥𝑖𝑗𝑘+ 1 ≤ 𝑀 × 𝐿𝑀𝑗
𝑘𝑀≤ 𝑀
∑𝑖∈𝑆𝑡𝑗𝑘 𝑥𝑖𝑗𝑘+ 𝑀 , 𝑘 = 1,2, … , 𝐾 , 𝑗 = 1,2, … , 𝑛
𝐿𝑀𝑗𝑘𝑀× 𝐿𝑀𝑗𝑘𝑚= 𝐿𝑀𝑗𝑘 , k=1,2,…,K, j=1,2,…,n (7)
𝑥𝑖𝑗𝑘+ 𝑥𝑖𝑘′𝑗′ ′
≤ 1, (𝐴𝑖, 𝐴𝑖′) 𝜖 𝑀⃡ , 𝑖, 𝑖′= 1,2, … , 𝑚 ,
𝑗, 𝑗′= 1,2, … , 𝑛 , 𝑘, 𝑘′= 1,2, … , 𝐾 (8)
𝑥𝑖𝑗𝑘+ 𝑥𝑖𝑘′𝑗′ ′
= 1 , (𝐴𝑖, 𝐴𝑖′) 𝜖 𝑀⃡
𝑖, 𝑖′= 1,2, … , 𝑚 , 𝑗, 𝑗′= 1,2, … , 𝑛
𝑘, 𝑘′= 1,2, … , 𝐾
(9)
𝑥𝑖𝑗𝑘− 𝑥𝑖𝑘′𝑗′ ′
≤ 0 , (𝐴𝑖, 𝐴𝑖′) 𝜖𝑀̅
𝑖, 𝑖′= 1,2, … , 𝑚 , 𝑗, 𝑗′= 1,2, … , 𝑛
𝑘, 𝑘′= 1,2, … , 𝐾
(10)
𝑥𝑖𝑗𝑘, 𝑥𝑖𝑘′𝑗′ ′
, 𝐿𝑀𝑗𝑘, 𝐿𝑀𝑗𝑘𝑚, 𝐿𝑀𝑗𝑘𝑀𝜖 {0,1}
𝑖, 𝑖′= 1,2, … , 𝑚 , 𝑗, 𝑗′= 1,2, … , 𝑛
𝑘, 𝑘′= 1,2, … , 𝐾
(11)
In this model, the objective function aims at optimizing the quantity obtained from each assessment criterion including the sum of effects resulting from the selection of each risk response in that criterion as well as the sum of effects of synergism for each risk.
Constraint 1 states that the cost of implementation of risk responses must be less than the allocated budget. According to constraint 2, risk responses must be selected such that the difference in improvement in time of the kth activity and the effect of risk on its time must be less than the expected value. Constraint 3 states that risk responses must be selected such that the difference in improvement in time of the kth activity and the effects of risk on quality of kth activity must be less than the expected value. According to constraints 4-6, if a known number of risk responses are selected for the corresponding risk, the resulting synergism will increase or decrease the effect of that risk. Constraint 4 implies that if the number of responses selected is greater than mjk, LMjkm will be one, and otherwise zero. In addition,
according to constraint 5, if the number of responses selected is less than Mjk, LMjkM will be one, and
otherwise zero. Constraint 6 states that if the number of responses selected is within the desirable range, synergism will be activated and LMjk will be equal to 1,
and otherwise zero. Furthermore, M in constraints 4 and 5 is a very large number (Big M). Constraints 7-9 are known as balance constraints. Constraint 7 states that strategies Ai and Ai′ exclude each other. Constraint 8
ensures that one strategy must be selected in the case of strategy exclusion. Constraint 9 says that the selection of one strategy requires that another specific strategy be selected, too. Constraint 10 is also a binary mode indicator.
4. THE PROPOSED METHOD OF SOLVING THE PROBLEM
In this paper, metaheuristic algorithm is used in order to solve the zero and one optimization model such that ε-constraint is used for problems of small dimensions. In addition, since the problem is NP-Hard and cannot be solved by the exact ε-constraint method, the algorithm mentioned will be used for problems of larger dimensions. First, these methods are explained.
4. 1. ε-Constraint Method This method was first introduced by Haimes et al. [19]. This method is based on the conversion of a multi-objective optimization problem to a single oobjective one such that only one objective is optimized and the others are considered constraints. In fact, this is one of the known approaches for confronting multi-objective problems, which solves the problem by transferring all the objective functions, except for one, in each step to a constarint. The steps in ε-constraint method are as follows:
1. One of the objective functions is chosen as the major objective function.
2. The problem is solved each time by considering one of the objective functions, and the optimized values for each function are obtained.
3. The interval between two optimized values of the minor objective functions is divided to previously determined numbers and a table for is made ε2,
…,εn.
4. The problem is solved each time with one of the major objective functions for each of the values of ε2, …,εn.
5. The Pareto responses found are reported.
Equation (12) shows the format of the ε-constraint problem.
𝑀𝑖𝑛 𝑦 = 𝑓(𝑥) = 𝑓1(𝑥)
𝜖 𝑥, 𝑦
f_2 (x )≤ ε_2
f_n (x )≤ ε_n
(12)
response vector available in X w memory. If the response
vector created is better, it is substituted with the worst response vector and HM is thus updated. This process continues unit the stopping conditions are reached. Therefore, HS algorithm consists of the following three major steps: initialization, improvement of a new harmony and updating HM. It must be pointed out the multi-objective harmony search algorithm (MOHS) is the developed form of HS and has been used in this work due to the type of research of interest.
5. COMPUTATIONAL RESULTS
To analyze the results of the proposed algorithm, it is first necessary to familiarize with specifications of sample problems, displaying the response, and adjustment of parameters, which will be explained below.
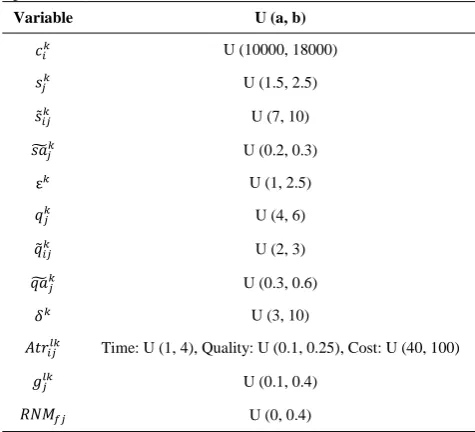
5. 1. Specifications of Sample Problems Two methods have been proposed for solving a problem; exact and innovative methods. The problems have been used in this work to produce responses, as shown in Table 1. In addition, the parameters related to the problems have been randomly generated to evaluate the performance of the proposed algorithm and the uniform distribution function has been used to generate numbers. Furthermore, the range of generation of parameters for the proposed algorithm, based on the publications available in this regard is as follows (Table 2). Quality, cost and time have been considered as the criteria for evaluation of the functions. The amount of budget is 60% of the total cost. The minimum and maximum risks to create synergism are 2 and 6, respectively. Since the data are not accurate and exact and for the sake of simplicity, all risks are assumed to be effective on all activities and all the responses affect all risks, but the effects are different.
TABLE 1. Specifications of solved problems
Problem Number of
activities
Number of risks
Number of risk response strategies
1 8 3 4
2 12 4 5
3 15 5 7
4 20 5 8
5 25 6 9
6 30 8 12
7 35 10 15
8 40 12 20
9 45 15 25
10 50 20 30
5. 2. How to Display the Answers The response is displayed as a two dimensional matrix in the hypothesized model. The matrix shows response strategies for the risks in each activity. Therefore, the numbers of lines and columns in the matrix are the same as response strategies and activity risks, respectively. In other words, the matrix is of I∙J×K form, in which I is the number of responses, J is the number of risks and K is the number of project activities. The numbers in this matrix are 0 and 1. If Kth activity is selected as the response strategy for Jth risk, it is 1, otherwise zero. Table 3 shows how responses for a problem with 4 response strategies, 2 risks and 3 activities are displayed.
A sample response has been hypothetically considered here. As observed, responses 2 and 3 have been selected for risk 1 of activity 1 and responses 3 and 4 have been selected for risk 2 of the same activity. Response strategy 1 has been selected for both risks of activity 2. Response strategy 4 has been selected 4 times and in all activities. Response strategy 2 has also been selected 3 times and for all activities.
TABLE 2. Probability distribution function to generate parameters
U (a, b) Variable
U (10000, 18000)
𝑐𝑖𝑘
U (1.5, 2.5)
𝑠𝑗𝑘
U (7, 10)
𝑠̃𝑖𝑗𝑘
U (0.2, 0.3)
𝑠𝑎
̃𝑗𝑘
U (1, 2.5)
ε𝑘
U (4, 6)
𝑞𝑗𝑘
U (2, 3)
𝑞̃𝑖𝑗𝑘
U (0.3, 0.6)
𝑞𝑎̃𝑗𝑘
U (3, 10)
𝛿𝑘
Time: U (1, 4), Quality: U (0.1, 0.25), Cost: U (40, 100)
𝐴𝑡𝑟𝑖𝑗𝑙𝑘
U (0.1, 0.4)
𝑔𝑗𝑙𝑘
U (0, 0.4)
𝑅𝑁𝑀𝑓𝑗
TABLE 3. Display Answer for 4 risk response strategies, 2 risks and 3 activities
Activity Activity 1 Activity 2 Activity 3
Risk Risk 1 Risk 2 Risk 1 Risk 2 Risk 1 Risk 2
Response 1 0 0 1 1 0 0
Response 2 1 0 1 0 0 1
Response 3 1 1 0 0 0 0
5. 3. Adjustment of Parameters To adjust the parameters for the proposed algorithm, Taguchi method has been used with 9 experiments. Initial population number, maximum, harmony memory coefficient, rate of step setting and bandwidth rate have been considered as parameters for MOHS method, as shown in Table 4.
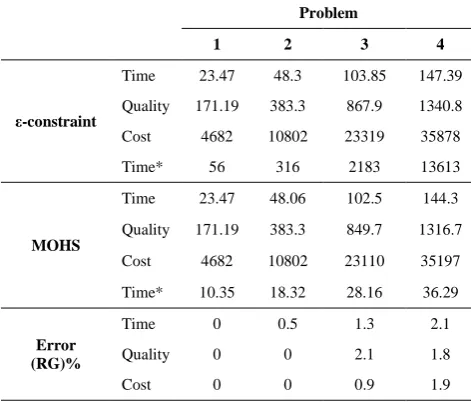
5. 4. Analysis of the Results of the Proposed Algorithm Four problems of small dimensions have been considered here to show the efficiency of the proposed algorithm. The results obtained from the proposed algorithm have been compared with those of the exact solution of ε-constraint. In the exact solution of ε-constraint, 5 breaks have been considered for the objective constrained function and a maximum of 25 Pareto points are generated for each problem. However, the exact solution of ε-constraint is not capable of being solved in large dimensions due to the problem being NP-Hard. Thus, the problem will be solved in small dimensions. The results obtained by comparing ε-constraint, MOHS methods is shown in Table 5.
In this table, the first row on the left gives the problem specifications and the results obtained from ε-constraint method and solution time are given in the next 4 rows. The values for metaheuristic methods are shown in the fifth and sixth rows and the last three rows give the errors from these metaheuristic methods in each of the objective functions.
In order to evaluate the errors in the obtained results using the proposed algorithm (RG), the best results
TABLE 4. Results of parameters setting for MOHS
Number of repetitions Initial
population Harmony
Memory Rate of
step setting Bandwidth
rate
125 30
0.6 0.4
2
TABLE 5. Comparison of the results of procedures MOHS and ε-constraint
Problem
4 3
2 1
147.39 103.85
48.3 23.47 Time
ε-constraint Quality 171.19 383.3 867.9 1340.8
35878 23319
10802 4682
Cost
13613 2183
316 56
Time*
144.3 102.5
48.06 23.47
Time
MOHS
1316.7 849.7
383.3 171.19 Quality
35197 23110
10802 4682
Cost
36.29 28.16
18.32 10.35
Time*
2.1 1.3
0.5 0
Time
Error
(RG)% Quality 0 0 2.1 1.8
1.9 0.9
0 0
Cost
(BR) were first considered for each objective function and then the best responses of each algorithm (RA) were compared. This is shown in Equation (13).
𝑅𝐺 =𝐵𝑅−RA𝐵𝑅 × 100 (13)
As observed in Table 5, the Lingo solving time increases exponentially with increased problem size and then greatly increases following the quantitative increase in the problem size. Therefore, ε-constraint algorithm cannot be applied for average and big problems. The results also indicate that MOHS algorithm has shown the least error in all three objective functions. The average error by this algorithm for the first objective function is less than 2.1% and less than 2.1% for the second objective function.
Ten problems of different dimensions have been considered in this work in which the number of activities, risks and response strategies are in the ranges of 8-50, 3-20, and 4-30, respectively. Prior to the analysis of the results of the criteria obtained for each algorithm, it is notable that higher values are more desirable for the two matrices of the number of non-dominating responses and diversity criteria. For the deviation from the ideal response criterion, higher values are more desirable considering that the objective functions are maximum whereas lower values are more desirable for the spacing criterion. Lower values are more desirable for time criterion. The values of each of the criteria are shown in Table 6. Table 7 gives the statistical specifications of the corresponding five criteria for algorithm.
TABLE 6. Computational results of MOHS for sample problems
Problem MID NOP Time Spacing Diversity
1 6366.04 5 10.35 0.878 38.9
2 17473.08 9 18.32 0.58 74.3
3 40620.1 5 28.16 0.528 80.04
4 65027.8 6 36.29 1.5 135.49
5 114589.74 5 56.5 0.92 72.24
6 314177.65 7 106.5 0.453 156.45
7 684026.48 7 182.1 1.02 237.41
8 1435183.54 7 298.54 0.886 256.34
9 2979159 5 474.11 1.086 281.66
10 1896170 28 882 0.979 1475.26
TABLE 7. Statistical characteristics of the seven criteria for MOHS
N Mean Std. Deviation Std. Error Mean
Spacing 10 0.88 0.31 0.09741
Diversity 10 280.81 428.27 135.43158
MID 10 755279.34 1022637.50 323386.37060
NOP 10 8.40 7.01 2.21711
6. DISCUSSION AND CONCLUSION
An integer linear programming model has been proposed in this work to overcome the problem of selection of risk responses for project risks. This model attempts to choose proper responses for different risks based on optimization of the criteria considered in the objective function. The objective function of this problem is capable of including and optimizing the different desired criteria in the project. Unlike other works, time constraints, quality and the relationships between different risk responses; especially interactions between risks, have been considered in this study. The interactions and relationships are such that a positive or negative synergism between the responses is activated if a known number of responses are selected. Contrary to what is assumed, the interactions between risks were observed to be very effective on this synergism. Assessment of the interactions between risks is performed by Risk Structure Matrix (RSM) method consisting of methods such as Design Structure Matrix (DSM) and Analytic Hierarchy Process (AHP). In addition, limitations due to prerequisites, co-requisites and the balance of selected risk responses have also been considered. ε-constraint and Multi Objective Harmony Search algorithm have been used to solve the model and cost, time and quality criteria have been considered as evaluation criteria in the objective function.
To perform an exact evaluation of the performances of this algorithm and reach a scientific conclusion, hypothesis testing and methods were used next. Hypothesis testing of equality of the average of two bilateral communities has been used such that the null hypothesis is taken for the equality of the averages of evaluation criteria in algorithm with a 95% confidence level. It was finally observed that the responses from Multi Objective Harmony Search algorithm is optimized. The outcomes of the responses show that this model will enable project managers to predict proper responses before execution of the project to increase the desirable effects of these responses as a strong tool.
7. REFERENCES
1. Radovanovic, L.j., Adamovic, Z. and Speight, J., "Risk analysis for increasing safety in power plants", Energy Sources, Part B: Economics, Planning, and Policy, Vol. 10, No. 3, (2015), 263-270.
2. Buchan, D.H., "Risk analysis--some practical suggestions", Cost Engineering, Vol. 36, No. 1, (1994), 29-36.
3. Miller, R. and Lessard, D., "Understanding and managing risks in large engineering projects", International Journal of Project Management, Vol. 19, No. 8, (2001), 437-443.
4. Zou, P.X., Zhang, G. and Wang, J., "Understanding the key risks in construction projects in china", International Journal of Project Management, Vol. 25, No. 6, (2007), 601-614.
5. Ben-David, I. and Raz, T., "An integrated approach for risk response development in project planning", Journal of the Operational Research Society, Vol. 52, No. 1, (2001), 14-25.
6. Mousavi, S., Makoui, A., Raissi, S. and Mojtahedi, S., "A multi-criteria decision-making approach with interval numbers for evaluating project risk responses", International Journal of Engineering-Transactions B: Applications, Vol. 25, No. 2, (2012), 121-129.
7. Fan, M., Lin, N.-P. and Sheu, C., "Choosing a project risk-handling strategy: An analytical model", International Journal of Production Economics, Vol. 112, No. 2, (2008), 700-713. 8. Ren, H., "Risk lifecycle and risk relationships on construction
projects", International Journal of Project Management, Vol. 12, No. 2, (1994), 68-74.
9. Ackermann, F., Eden, C., Williams, T. and Howick, S., "Systemic risk assessment: A case study", Journal of the Operational Research Society, Vol. 58, No. 1, (2007), 39-51.
10. Adner, R., "Match your innovation strategy to your innovation ecosystem", Harvard Business Review, Vol. 84, No. 4, (2006), 98-104.
11. Dikmen, I., Birgonul, M., Anac, C., Tah, J. and Aouad, G., "Learning from risks: A tool for post-project risk assessment",
Automation in Construction, Vol. 18, No. 1, (2008), 42-50.
12. Zoullouti, B., Amghar, M. and Sbiti, N., "Risk analysis of operating room using the fuzzy bayesian network model",
International Journal of Engineering-Transactions B: Applications, Vol. 30, No. 1, (2017), 66-74.
13. Kwan, T.W. and Leung, H.K., "A risk management methodology for project risk dependencies", IEEE Transactions on Software Engineering, Vol. 37, No. 5, (2011), 635-648. 14. Pajares, J. and López, A., "New methodological approaches to
project portfolio management: The role of interactions within projects and portfolios", Procedia-Social and Behavioral Sciences, Vol. 119, (2014), 645-652.
15. Zhang, Y. and Fan, Z.-P., "An optimization method for selecting project risk response strategies", International Journal of Project Management, Vol. 32, No. 3, (2014), 412-422. 16. Datta, S. and Mukherjee, S., "Developing a risk management
matrix for effective project planning--an empirical study, Project Management Institute., (2001).
17. Kujawski, E., "Selection of technical risk responses for efficient contingencies", Systems Engineering, Vol. 5, No. 3, (2002), 194-212.
18. Pipattanapiwong, J. and Watanabe, T., "Multi-party risk management process (MRMP) for a construction project financed by an international lender", in Proceeding of Construction Engineering and Management Symposium., (2000), 85-92.
19. Haimes, Y.Y., Ladson, L. and Wismer, D.A., "Bicriterion formulation of problems of integrated system identification and system optimization", IEEE Transactions on Systems Man and Cybernetics, Vol., No. 3, (1971), 296-304.
20. Klein, J.H., "Modelling risk trade-off", Journal of the Operational Research Society, Vol. 44, No. 5, (1993), 445-460. 21. Chapman, C.B., "Large engineering project risk analysis", IEEE Transactions on Engineering Management, No. 3, (1979), 78-86.
22. Seyedhoseini, S.M., Noori, S. and Hatefi, M.A., "An integrated methodology for assessment and selection of the project risk response actions", Risk Analysis, Vol. 29, No. 5, (2009), 752-763.
23. Ben-David, I., "Economic optimization of project risk management efforts", Tel Aviv University, Israel, (2002),
in concurrent engineering projects", CIRP Annals-Manufacturing Technology, Vol. 56, No. 1, (2007), 167-170.
25. Zhang, Y., "Selecting risk response strategies considering project risk interdependence", International Journal of Project Management, Vol. 34, No. 5, (2016), 819-830.
26. Steward, D., "The design structure matrix: A method for managing the deisgn of complex systems", IEEE Transactions on Engineering Management, Vol. 28, No., (1981).
27. Fang, C. and Marle, F., "A simulation-based risk network model for decision support in project risk management", Decision Support Systems, Vol. 52, No. 3, (2012), 635-644.
28. Fang, C., Marle, F., Zio, E. and Bocquet, J.-C., "Network theory-based analysis of risk interactions in large engineering projects",
Reliability Engineering & System Safety, Vol. 106, (2012), 1-10.
29. Fang, C., Marle, F., Xie, M. and Zio, E., "An integrated framework for risk response planning under resource constraints in large engineering projects", IEEE Transactions on Engineering Management, Vol. 60, No. 3, (2013), 627-639. 30. Saaty, T.L., "The analytic hierarchy process: Planning, priority
setting, resource allocation, McGraw-Hill International Book Company, (1980).
31. Guide, P., "A guide to the project management body of knowledge", in Project Management Institute. Vol. 3, (2004).
32. Marle, F., Vidal, L.-A. and Bocquet, J.-C., "Interactions-based risk clustering methodologies and algorithms for complex project management", International Journal of Production Economics, Vol. 142, No. 2, (2013), 225-234.
33. Soofifard, R. and Khakzar Bafruei, M., "An optimal model for project risk response portfolio selection (p2rps)(case study: Research institute of petroleum industry)", Iranian Journal of Management Studies, Vol. 9, No. 4, (2017), 741-765. 34. Soofifard, R. and Bafruei, M.K., "Fuzzy multi-objective model
for project risk response selection considering synergism between risk responses", International Journal of Engineering Management and Economics, Vol. 6, No. 1, (2016), 72-92.
35. Zegordi, S., Nik, E.R. and Nazari, A., "Power plant project risk assessment using a fuzzy-anp and fuzzy-topsis method",
International Journal of Engineering-Transactions B: Applications, Vol. 25, No. 2, (2012), 107-115.
36. Eppinger, S.D., Whitney, D.E., Smith, R.P. and Gebala, D.A., "A model-based method for organizing tasks in product development", Research in Engineering Design, Vol. 6, No. 1, (1994), 1-13.
37. Geem, Z.W., Kim, J.H. and Loganathan, G., "A new heuristic optimization algorithm: Harmony search", Simulation, Vol. 76, No. 2, (2001), 60-68.
A New Approach to Project Risk Responses Selection with Inter-dependent Risks
R. Soofifarda, M. Gharibb
aTraining and Human Resourse Development Department, Research Institute of Petroleum Industry, Tehran, Iran b Faculty of Fouman, College of Engineering, University of Tehran, Fouman, Iran
P A P E R I N F O
Paper history:
Received 23 January 2017
Received in revised form 22 February 2017 Accepted 10 March 2017
Keywords: Risk Response Project Risk Management Risk Interactions
Multi-objective Harmony Search Algorithm
ديكچ ه
هژورپ یارجا رد دوجو یمیشورتپ و زاگ ،تفن میظع یاه
یگژیو زا کسیر یم اهنآ یعیبط و یتاذ یاه
و هیزجت ماگنه .دشاب
کسیر ًلاومعم ،کسیر خساپ لیلحت یم رظن رد مه زا لقتسم ار اه
کسیر رثکا یعقاو یایند رد هک یتروص رد دنریگ مه هب اه
هتسباو خساپ باختنا یارب یداهنشیپ یلدم هلاقم نیا .دراد دوجو تردنب لقتسم کسیر و دنا م یاه
کسیر بسان دبس زا اه
خساپ یم هئارا اه فده و دهد لدم
هنیهب یزاس رایعم یاه فیرعت هدش یارب هژورپ یژرنا هزوح رد اه یم
رد .دشاب نیا هعلاطم
طابترا نایم خساپ یاه یلع و کسیر کسیر نیب طابترا صوصخلا
رد اه رظن هتفرگ هدش تسا هک نیا عوضوم رد تاقیقحت ریاس
ماجنا هدش رظندم رتمک رارق تسا هدش هتفرگ
.
و کسیر لباقتم تارثا یحطس یسررب ای و هجوت مدع درک ناشن رطاخ دیاب
خساپ هدایپ هنیزه شیازفا و راظتنا دروم تیبولطم شهاک بجوم کسیر یاه هژورپ عون نیا یزاس
یم اه نیا .دوش لدم تیلباق
دراد هک ساسارب هژورپ فیرعت زاگ و تفن یاه هدش
رایعم یاه رد ار یفلتخم عبات
فده هنیهب یزاس زا لدم نیا لح یارب .دیامن
متیروگلا دنچ ینومراه یوجتسج یراکتبا ارف ( هفده
MOHS
یم هدافتسا ) و هیزجت دروم نآ زا لصاح یددع جیاتن و دوش
یم رارق لیلحت .دریگ