Performance Computing
Markus Götz
180 ECTS dissertation submitted in partial fulfillment of a Philosophiae Doctordegree in Computational Engineering
Supervisor Morris Riedel
Doctoral Committee Matthias Book Ólafur Pétur Pálsson
Morris Riedel
Opponents Håkan Grahn Shantenu Jha
Faculty of Industrial Engineering, Mechanical Engineering and Computer Science School of Engineering and Natural Sciences
University of Iceland Reykjavík, December 2017
Copyright cMarkus Götz 2017 All rights reserved
Faculty of Industrial Engineering, Mechanical Engineering and Computer Science School of Engineering and Natural Sciences
University of Iceland Sæmundargata 2 101, Reykjavík Iceland Telephone: +354 525 4000 Bibliographic information:
Markus Götz, 2017,Scalable Data Analysis in High Performance Computing,
PhD dissertation, Faculty of Industrial Engineering, Mechanical Engineering and Computer Science, University of Iceland
ISBN 978-9935-9383-2-9 Printing: Háskólaprent
Abstract
Over the last decades one could observe a drastic increase in the generation and storage of data in both, industry and science. While the field of data analysis is not new, it is now facing the challenge of coping with an increasing size, bandwidth and complexity of data. This renders traditional analysis methods and algorithms ineffective. This problem has been coined as theBig Data challenge. Concretely in science the major data producers are large-scale monolithic experiments and the outputs of domain simulations. Up until now, most of this data has not yet been completely analyzed, but rather stored in data repositories for later consideration due to the lack of efficient means of processing. As a consequence, there is a need for large-scale data analysis frameworks and algorithm libraries allowing to study these datasets. In context of scientific applications, potentially coupled with legacy simulations, the designated target platform are heterogeneous high-performance
computing systems.
This thesis proposes a design and prototypical realization of such a framework based on the experience collected from empirical applications. For this, selected scientific use cases, with an emphasis on earth sciences, were studied. In particular, these are object segmentation in point cloud data and biological imagery, outlier detection in oceanographic time-series data as well as land cover type classification in remote sensing images. In order to deal with the data amounts, two analy-sis algorithms have been parallelized for shared- and distributed-memory systems. Concretely, these are HPDBSCAN, a density-based clustering algorithm, as well
as Distributed Max-Trees, a filtering step for images. The presented
paralleliza-tion strategies have been abstracted into a generalized paradigm, enabling the formulation of scalable algorithms for other similar analysis methods. Moreover, it permits the definition of requirements for the design of a large-scale data analysis framework and algorithm library for heterogeneous, distributed high-performance computing systems. In line with that, the thesis presents a prototypical realiza-tion calledJuelich Machine Learning Library (JuML), providing essential low-level components and readily usable analysis algorithm implementations.
Keywords—Data Analysis, Machine Learning, High-Performance Computing,
Ágrip
Á síðastliðnum áratug hefur orðið mikil aukning í framleiðslu og geymslu gagna í ið-naði sem og rannsóknum. Þrátt fyrir að gagnagreining sé ekki ný af nálinni, stendur hún frammi fyrir þeirri áskorun að ráða við síaukið magn, bandvídd og flækjustig gagna. Þetta gerir hefðbundnar aðferðir óskilvirkar og hefur þetta vandamál verið nefnt gagnagnótt (e.Big Data). Í vísindum koma gögn helst frá umfangsmiklum tilraunum og hermunum. Hingað til hefur ekki verið fyllilega unnið úr gögnunum, heldur hafa þau verið geymd í gagnageymslum fyrir greiningu síðar meir, vegna skorts á skilvirkum úrvinnsluaðferðum. Af þessu má draga þá ályktun að til að greina þessi gögn þurfi víðtæka umgjörð fyrir gagnagreiningu og algrímasöfn og er tölvuumhverfið sem miðað er við, misleit kerfi sem ætluð eru fyrir stórfellda tölvuvinnslu (e.high-performance computing).
Þessi ritgerð leggur til hönnun og frumgerðarútfærslu á slíkri umgjörð sem byg-gir á reynslu sem fengin er úr raunverulegum notkunardæmum, einkum jarðvísin-dum. Sérstaklega voru skoðuð dæmi um merkingu útlína hluta í punktaskýsgögnum og líffræðilegu myndefni, útlagar (e. outliers) í haffræðilegum tímaraðagögnum og flokkun á fjarkönnunarmyndefni. Til að ráða við hið mikla magn gagna voru tvö greiningaralgrím aðlöguð fyrir samhliða vinnslu í kerfum með samnota- og dreift minni. Þetta eru HPDBSCAN, sem er klösunaraðferð byggð á þéttiföllum
og Distributed Max-Trees, síunaralgrím fyrir myndir. Báðar aðferðir voru færðar
yfir í almenna frumgerð sem einfaldar framsetningu skalanlegra algríma fyrir aðrar sambærilegar greiningaraðferðir. Þar að auki gerir þetta kleift að setja fram skil-greiningu á þörfum fyrir hönnun víðtækra gagnagreiningaumgjarðar og söfn algríma fyrir misleit kerfi ætluð til dreifðrar stórtækrar tölvuvinnslu. Að lokum er frumgerð á útfærslu slíkrar umgjarðar kynnt sem nefnd er Juelich Machine Learning
Li-brary (JuML), sem veitir aðgang að lágtæknieiningum og tilbúnum útfærslum á
greiningaralgrímum.
Lykilorð—Gagnagreining, Gagnagreiningaumgjörð, Reiknigreind,
List of Publications
Paper IM. Götz, M. Richerzhagen, C. Bodenstein, G. Cavallaro, P. Glock, M. Riedel, J.
A. Benediktsson, “On Scalable Data Mining Techniques for Earth Science”, in the journalElsevier Procedia Computer Science, 51(C), pp. 2188-2197, 2015.
Paper II
M. Götz, C. Bodenstein, M. Riedel, “HPDBSCAN: Highly Parallel DBSCAN”,
in ACM Proceedings of the Workshop on Machine Learning in High-Performance
Computing Environments, The International Conference for High Performance
Computing, Networking, Storage and Analysis, Austin, USA, pp. 1-10, 2015.
Paper III
M. Götz, M. Kononets, C. Bodenstein, M. Riedel, M. Book, O. P. Palsson,
“Au-tomatic Water Mixing Event Identification in the Koljö Fjord Observatory Data”,
submittedto International Journal of Data Science and Analytics.
Paper IV
C. Bodenstein,M. Götz, A. Jansen, H. Scholz, M. Riedel, “Automatic Object De-tection Using DBSCAN for Counting Intoxicated Flies in the FLORIDA Assay”,
in Proceedings of 15th IEEE International Conference on Machine Learning and
Applications (ICMLA), Los Angeles, USA, pp. 746-751, 2016.
Paper V
M. Götz, G. Cavallaro, T. Géraud, M. Book, M. Riedel, “Parallel Computation of
Component Trees on Distributed Memory Machines”,submittedtoTransactions
on Parallel and Distributed Systems.
Paper VI
M. Götz, M. Book, C. Bodenstein, M. Riedel, “Supporting Software Engineering
Practices in the Development of Data-Intensive HPC Applications with the JuML Framework”, inACM Proceedings of the International Workshop on Software Engi-neering for High Performance Computing in Computational and Data-Enabled Sci-ence and Engineering, The International ConferSci-ence for High Performance
Paper VII
G. Cavallaro, M. Riedel, J. A. Benediktsson,M. Götz, T. Runarsson, K. Jonasson, and T. Lippert, “Smart Data Analytics Methods for Remote Sensing Applications”,
in Proceedings of the IEEE International Geoscience and Remote Sensing
Sympo-sium (IGARSS), Québec, Canada pp. 1405-1408, 2014.
Paper VIII
G. Cavallaro, M. Riedel, M. Götz, C. Bodenstein, M. Richerzhagen, P. Glock, and J. A. Benediktsson, “Scalable Developments for Big Data Analytics in Remote Sensing”, inProceedings of the IEEE International Geoscience and Remote Sensing
Symposium (IGARSS), Milan, Italy, pp. 1366-1369, 2015.
Paper IX
M. Riedel,M. Götz, M . Richerzhagen, P. Glock, C. Bodenstein, A. S. Memon, M. S. Memon, “Scalable and Parallel Machine Learning Algorithms for Statistical Data Mining—Practice & Experience”, in Proceedings of the IEEE 38th Interna-tional Convention on Information and Communication Technology, Electronics and
Software I
M. Götz, C.Bodenstein, “HPDBSCAN”, Parallel and scalable C++
implementa-tion of the density-based spatial clustering for applicaimplementa-tions with noise (DBSCAN) algorithm. Employs the Message-Passing Interface (MPI) and Open Multiprocess-ing (OpenMP) for the parallelization strategy. Data is processed in the Hierarchical Dataformat 5.
https://bitbucket.org/markus.goetz/hpdbscan, 2015. Software II
Christian Bodenstein,M. Götz, “Fly Detector”, GUI program allowing the intox-icated fly count analysis in the FLORIDA assay. It is implemented in C++ using Qt and utilizes a shared-memory OpenMP-parallelized flavor of HPDBSCAN for the segmentation step. The code includes the steering software for the FLORIDA assay hardware setup.
https://github.com/cbodenst/FlyDetector, 2015. Software III
M. Götz, “Koljö Fjord Observatory Analysis”, Analsys script for the detection of
water mixing events in the Koljö fjord observatory time series data. The implemen-tation relies on DBSCAN and confidence interval analysis to detect the events and is implemented in Python. An optional grid search optimizes the model parameters and is parallelized using MPI.
https://github.com/Markus-Goetz/pangaea, 2016. Software IV
M. Götz, G. Cavallaro, “DMT”, This C++ code allows the computation of
large-scale image max-trees. It is hybrid parallelized using threads and MPI and loads and stores its data in the HDF5 format.
https://bitbucket.org/markus.goetz/dmt, 2017. Software V
M. Götz, C. Bodenstein, M. Richerzhagen, P. Glock, “JuML”, The Juelich
Ma-chine Learning Library is a C++ and Python-based framework and data analysis algorithm library for high-performance computing systems. It is able to compute on processor and accelerators. The parallelization of the algorithms is realized through CUDA, OpenCL and MPI.
List of Figures
1.1 BPMN 2.0 diagram depicting the methodological process of the
thesis. . . 4 2.1 Visualization of the major data analysis tasks. . . 10 2.2 Common architectures of high-performance computing systems. . . . 13 3.1 Example point cloud from the old-town of Bremen. . . 18 3.2 ExampleDensity Based Spatial Clustering for Applications with
Noise(DBSCAN) clustering with minP oints= 4. . . 19
3.3 Spatial domain decomposition strategies for parallelizing
DBSCAN. The partition boundary between the processors is shown as a dashed line and the overlapping halo cells in a hatched pattern. 20 3.4 Experimental evaluation ofHighly Parallel DBSCAN
(HPDBSCAN)’s performance. . . 21 3.5 Schematic of theFull Loss Of Righting Reflex InDuced by Alcohol
(FLORIDA) assay experiment’s hardware setup. . . 23 3.6 Processing stages of the FLORIDA assay depth-perception problem. 23 3.7 The Koljö fjord observatory. . . 25 3.8 F1 measure surface for the experimental parametersεand
minP oints. . . 27 3.9 Aerial image of the city of Rome and its land cover types. . . 28 3.10 Example of max-tree representation based on an exemplary image
and its componentsCc
i, with the subscriptcbeing the gray-level
and the superscriptithe canonical point uniquely identifying the
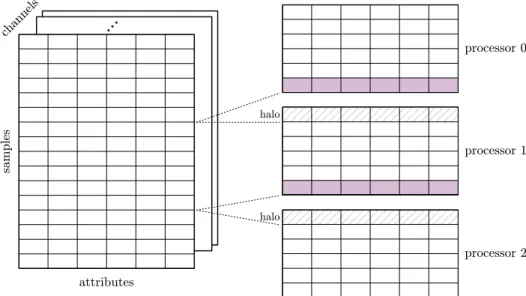
component. . . 30 3.11 Experimental evaluation of the distributed max-tree algorithm. . . . 30 4.1 One-dimensional data decomposition across the samples, including
halo zones in purple and duplicates with a hatched pattern. . . 39 4.2 UML class diagram [1] ofthe Juelich Machine Learning Library
List of Tables
1.1 Relation matrix of publication contributions and research questions. . 7 1.2 Relation matrix of software contributions and publications. . . 8
Abbreviations
API Application Programming InterfaceARIMA Auto-Regressive Integrated Moving-Average
BPMN Business Process Modelling Notation
CRISP-DM CRoss Industry Standard Process for Data Mining
CUDA Compute Unified Device Architecture DAAL Data Analytics Acceleration Library
DBSCAN Density Based Spatial Clustering for Applications with Noise
FLORIDA Full Loss Of Righting Reflex InDuced by Alcohol
FPGA Field Programmable Gate Array
GPGPU General Purpose Graphics Processing Unit
HAF Helmholtz Analytics Framework
HDF5 Hierarchical Data Format 5 HDFS Hadoop Distributed File System
HPC High Performance Computing
HPDBSCAN Highly Parallel DBSCAN
HTC High Throughput Computing
JuML the Juelich Machine Learning Library KDD Knowledge Discovery in Databases MIC Many-Integrated-Cores
MIMD Multiple-Instructions-Multiple-Data MPI Message Passing Interface
OpenACC Open Accelerators
OpenCL Open Computing Language
OpenHMPP Open Hybrid Multicore Parallel Programming
OpenMP Open Multiprocessing
OS Operating System RBF Radial Basis Function
RQ Research Question
SDAP Self-Dual Attribute Profile
SEMMA Sample-Explore-Modify-Model-Assess
SIFT Scale-Invariant Feature Transform SIMD Single-Instruction-Multiple-Data SKA Square Kilometer Array
SOM Self-Organizing Map
SVM Support Vector Machine
TOS Tree Of Shapes
Acknowledgments
I am grateful to my supervisor Prof. Morris Riedel, head of the research group
High Productivity Data Processing at the Federated Systems and Data division of
theJuelich Supercomputing Center, Germany, andSchool of Engineering and
Nat-ural Sciences at the University of Iceland, who trusted in my abilities and made
the doctoral studies possible, as well as for the experiences in last years.
Profound thanks go equally to Prof. Matthias Book and Prof. Ólafur Pétur Páls-son at theFaculty of Industrial Engineering, Mechanical Engineering and Computer
Sciencefor partaking in my doctoral committee and their guidance on the path to
this thesis.
I also would like to thank the Research Center Jülich and the state North-Rhine Westphalia for financially supporting this work.
A special shotout goes to all my collaborators and office mates for an open ear, advise and cooperation. I am looking at you Christian Bodenstein, Philipp Glock, Gabrielle Cavallaro and Mikhail Kononets.
I would also like to thank my friends and Jülich coworkers Paul Baumeister, Salem El-Sayed, Björn Hagemeier, Andreas Herten, Daniel Mallmann, Theodor Nikolov, Lena Oden, Maria Petrova El-Sayed and Rajveer Saini
My good friends Frank and Lysann deserve praise for proof-reading, discussions and taking my mind off at the right times.
I am grateful to my family and especially my mom for believing in me and getting me to the point in my life I am at right now.
Finally, the biggest ‘Thank you!’ is addressed to my wife Ewa, for her support, patience, understanding and love, which helped me enormously in finishing this undertaking and for being at my side no matter my spirit.
Contents
LIST OFPUBLICATIONS . . . v
LIST OFFIGURES . . . ix
LIST OFTABLES . . . xii
ABBREVIATIONS . . . xiv ACKNOWLEDGMENTS . . . xvi 1 Introduction . . . 1 1.1 Motivation . . . 1 1.2 Research Questions . . . 3 1.3 Outline . . . 5 1.3.1 Covering Paper . . . 5 1.3.2 Appended Papers . . . 6 1.4 Contributions . . . 7 2 Background . . . 9 2.1 Data Analysis . . . 9 2.1.1 Learning Approaches . . . 9 2.1.2 Learning Tasks . . . 10
2.1.3 Data Analysis Process . . . 11
2.2 High-Performance Computing . . . 12
2.2.1 System Architectures . . . 12
2.2.2 Programming Models . . . 14
3 Summary of the Publications . . . 17
3.1 Paper I . . . 17
3.2 Paper II . . . 19
3.2.1 DBSCAN . . . 19
3.2.2 Parallelization Strategy . . . 20
3.3 Paper III . . . 22
3.3.1 The FLORIDA Assay . . . 22
3.4.2 Water Mixing Event Detection . . . 26
3.5 Paper V . . . 28
3.5.1 Land Cover Type Classification . . . 28
3.5.2 Feature Engineering and Component Trees . . . 29
3.5.3 Parallelization Strategy . . . 30
3.6 Paper VI . . . 32
4 An HPC Data Analysis Framework . . . 35
4.1 Related Work . . . 36
4.2 Data Analysis Algorithm Parallelization Paradigm . . . 38
4.3 Requirements . . . 40
4.4 Juelich Machine Learning Library . . . 41
5 Conclusions . . . 45 5.1 Future Work . . . 47 REFERENCES . . . 49 APPENDICES . . . 58 A Paper I . . . 61 B Paper II . . . 73 C Paper III . . . 85 D Paper IV . . . 93 E Paper V . . . 109 F Paper VI . . . 127
Introduction
1.1 Motivation
In the last decades business and industry have seen an influx of data-oriented and data-intensive services [2]. Search engines [3], social networks, business intelli-gence [4] and the Internet of Things are just some of the examples for this trend. With an even earlier starting point, science has undergone a process very much alike. Large-scale experiments—exemplified by the TOAR weather and climate re-search database [5], PANGAEA, an environmental science data collection [6], or the planned radio observatorySquare Kilometer Array (SKA) [7]—collect an ex-ponentially growing amount of data in need of analysis. To provide a convenient term for these phenomena, the start of the Big Data era has been announced. This term generally refers to data processing and analysis problems, which cannot be adequately dealt with using conventional technology. Initially, the focus has been put on the so-called threeV’s[8], i.e. keywords starting with the letterV, attempt-ing to deliver a concise description of the involved challenges. These are volume,
velocity andvariety and correspond to the quantity, bandwidth as well as number
of different sources and types of data involved in an analysis problem. Later, addi-tional V’s have been added to better reflect challenges previously unaccounted for, starting at four [9], to seven [10], then ten [11] and ultimately a not quite genuine 42 [12]. They describe related issues, such as how to visualize the data, price them, make data secure against theft or alteration and so forth.
In line with the inevitable expansion of Big Data challenges, technologies at-tempting to overcome them have seen accelerated research and investment. Particu-larly in the industry, the concepts ofHigh Throughput Computing(HTC) andcloud
computing have established themselves as cost-efficient and scalable ways of
pro-cessing data, while also ensuring agreed-upon service levels in terms of availability, redundancy of computation, etc. This infrastructure-centered pursuit has in turn given rise to new technology stacks, such as the Hadoop Distributed File System (HDFS) [13], parallel processing platforms like Hadoop [14] or Spark [15], virtu-alization solutions including CloudStack and Docker, and database management systems like NoSQL or in-memory databases. Most of them, however, have strong
limitations. Computational processing power in HTC is constrained by the com-modity hardware it is run on, along with simple, commercial-grade interconnects and as a result, limited communication bandwidth and basic topological structure. While this is sufficient for industrial applications, mainly focused on simple corre-lated pattern detection in user data, for example, this effectively limits the potential of implementing highly complex, though analytically efficient and accurate models, which are prevalent in scientific research.
Next to traditional simulations, computational data analysis becomes an in-creasingly more frequent application scenario in science. It is used to perform sim-ulation observation data assimilation, augmentation of experimental data and to process results of measurements gathered by sensor systems. However, despite the frequent similarity of high-level analysis tasks compared to the industry, scientific technological implementation aspects differ heavily. Due to precision constraints, such application scenarios require much more complex and computationally inten-sive analysis models. This translates not only to immense computational require-ments and space consumption, but also the need for expertise and efficiency in employing the resources offered by the traditionally usedHigh Performance
Com-puting (HPC) systems. These systems often employ expensive, however
computa-tionally powerful heterogeneous hardware components, which are tightly integrated via high-bandwidth interconnects.
A large base of experience and knowledge in computationally aided natural sci-ence research comes with decades worth of legacy systems that are costly to change. This results in a certain rigidity against attempts at adapting the dynamically de-veloping HTC technologies, from which the sciences would undoubtedly stand to gain. The technology stacks employed in HPC are largely incompatible with new technologies introduced to the HTC area. Their disjunction starts at low levels with the concrete distributed file systems and follows through data formats, schedulers, programming languages and the possibility to exploit heterogeneous computational hardware. As a result, attempts at merging them would entail substantial engineer-ing efforts. Rather than strivengineer-ing to make them perform as interchangeable equiv-alents, the arguably better approach is to identify the core aspects of the rising HTC technologies and to apply and adept them to HPC scenarios.
Given the increased demand for powerful data analysis in science and the ex-plained state of technology, there is an objective need for the design and imple-mentation of parallel and scalable solutions. The common use of legacy HPC tools and increasing need for innovation calls for attention from the computational en-gineering community. To answer this call, this dissertation studies and analyzes a number of different natural science application domains in order to identify novel approaches that are tailored to HPC systems. From the requirements exposed in the studies a generalized parallelization paradigm for HPC data analysis algorithms is derived. It is further implemented in a cohesive prototypical data analysis frame-work, enabling large-scale data analysis and algorithm development for modern, heterogeneous HPC systems.
1.2 Research Questions
This thesis examines the need for HPC-based data analysis in scientific research and proposes a systematic manner of addressing it. Studies of use cases stemming from a number of Earth sciences enable an in-depth investigation of specific requirements imposed by particular research problems. They further result in the identification of commonalities in the demand for powerful data analysis solutions present across domains. Means of addressing the observed research gap are explored based on scientific literature documenting designs and applications of data analysis algo-rithms. Here, performance is of primary interest, both in terms of computational efficiency, as well as the extent in which it succeeds to address the domain-specific challenge. The goal is to identify readily available efficient HPC tools applicable to the examined Earth science problems, or lack thereof. If absent, conventional data analysis algorithms that are best suited for the scientific use cases are se-lected and redesigned to maximize computational performance and optimize the use of HPC resources. Their novel implementations are applied, validated and eval-uated in terms of domain-specific insights and computational performance. With the intention to shrink the mentioned gap, due to the scarce availability of HPC data analysis tools, a framework of such ready-to-use algorithms is proposed. A prototypical candidate, including the collection of pre-implemented algorithms, is published open-source.
In this manner the author addresses the following set of research questions, which interweave the conducted studies:
Research Question(RQ) 1: What is the state of the art in data analysis and
its technologies in the Earth sciences?
RQ 2: How and which parallel and scalable algorithms can support the analysis
of selected Earth science use cases?
RQ 3: Can the identified techniques be applied in a generalized fashion in scientific
domains outside of the Earth sciences?
RQ 4: Are there enough commonalities that would justify the design of a
par-allel and scalable data analysis framework and algorithm library for HPC computing systems?
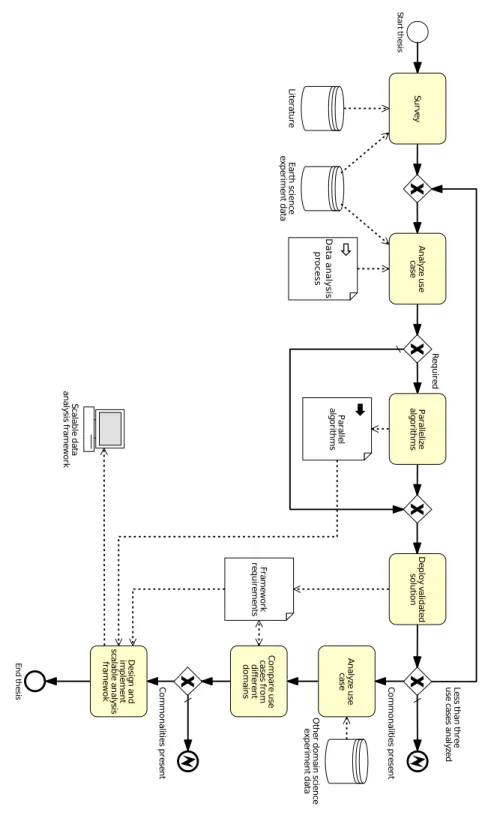
En d th es is St ar t t h es is Ea rth s cie n ce ex p er im en t d at a Fr am ew o rk re q u ire m en ts Sc ala b le d at a an aly sis fr am ew o rk Pa ra lle liz e alg o rit h m s A n aly ze u se ca se D ep lo y v ali d at ed so lu tio n D es ig n a n d im p le m en t sc ala b le a n aly sis fra m ew o k Su rv ey C o m p ar e u se ca se s f ro m d iff er en t d o m ain s A n aly ze u se ca se O th er d o m ain s cie n ce ex p er im en t d at a Lit er at u re Pa ra lle l alg o rit h m s R eq u ire d C o m m o n ali tie s p re se n t C o m m o n ali tie s p re se n t Le ss th an th re e u se c as es a n aly ze d Data an alysis pr ocess Figure 1.1: BP M N 2.0 diagram depicting the metho dological pro cess of the thesis.
Figure 1.1 depicts the method selected for answering these questions in form of
aBusiness Process Modelling Notation(BPMN) [16] diagram. It closely follows the
posed research questions and tries to answer them gradually. First, the literature and the selected use cases are surveyed, including proposed analysis approached in order to determine the state of the art. Then, the use cases are tackled in con-junction with the experts of the particular application domain. The Earth sciences have been selected as the field of choice due to availability, size and characteris-tics of publicly available data sets. Depending on the chosen analysis approach, the parallelization of the used algorithms may be necessary in order to be able to handle the data volume and bandwidth present in the use case. The proposed solution should be so generic that it can also be applied to data sets with simi-lar analysis tasks and scalable enough to handle increased data quantities. This is what Research Question three aims at—the ability to generalize the findings. Given that there are enough commonalities, it is sensible to extract these and use them as a requirements list and potentially paradigm for the design of a parallel and scalable framework and data analysis library on HPC systems. This software artifact should support two major user groups: the developers of data analysis al-gorithms and the actual data analysts. The library should aid the former through the abstraction from underlying hardware features, if possible, while also providing recurring functionality for the implementation of parallel algorithms. In contrast to that, the second group needs a set of reliable and efficient standard algorithms, which require a high-level Application Programming Interface (API) working on abstract entities such as entire data sets and thereby handling the parallelization internally—instead of explicit low-level components such as passed messages.
1.3 Outline
This thesis is composed in a cumulative style. The major findings are therefore presented in form of peer-reviewed conference and journal publications as well as pending submissions, which are to be found in the appendix. Publications to which the thesis author only contributed to a lesser extent are deliberately excluded. For a complete list of all publications, however, please refer to the “List of Publications”.
1.3.1 Covering Paper
The following chapters will provide a brief summary of the results as follows.
Chapter 1—Introduction presents the motivation and research methodology
for answering the research questions posed in this thesis.
Chapter 2—Background provides background on both, data analysis tasks,
methods and the involved process, as well as a background on HPC.
Chapter 3—Summary of the Publications summarizes the appended papers
Chapter 4—An HPC Data Analysis Framework proposes a data analysis framework and algorithm library targeting heterogeneous, distributed high-performance computing systems. For this, related work in the field is intro-duced first, before this thesis’ design concept is presented. Along with this, a generalized algorithm parallelization strategy paradigm, abstracted from the publications in Chapter 3, is suggested. It adds to the definition of a requirements list of essential components of the aforementioned framework. Finally, this chapter is concluded with the introduction ofJuML—this proto-typical realization of a large-scale data analysis framework for HPC systems proposed in line with this thesis.
Chapter 5—Conclusions concludes the thesis and presents perspectives for
fu-ture research opportunities.
1.3.2 Appended Papers
The following papers from the List of Publications can be found in the appendix. Paper I
M. Götz, M. Richerzhagen, C. Bodenstein, G. Cavallaro, P. Glock, M. Riedel,
Morris, J. A. Benediktsson, “On Scalable Data Mining Techniques for Earth Sci-ence”, inElsevier Procedia Computer Science, 2015, pp. 2188-2197.
Paper II
M. Götz, C. Bodenstein, M. Riedel, “HPDBSCAN: Highly Parallel DBSCAN”,
in ACM Proceedings of the Workshop on Machine Learning in High-Performance
Computing Environments, The International Conference for High Performance
Computing, Networking, Storage and Analysis, Austin, USA, 2015, pp. 2:1-2:10.
Paper III
C. Bodenstein,M Götz, A. Jansen, H. Scholz, M. Riedel, “Automatic Object De-tection Using DBSCAN for Counting Intoxicated Flies in the FLORIDA Assay”,
in Proceedings of 15th IEEE International Conference on Machine Learning and
Applications (ICMLA), Los Angeles, USA, 2016, pp. 746-751.
Paper IV
M. Götz, M. Kononets, C. Bodenstein, M. Riedel, M. Book, O. P. Pálsson,
“Au-tomatic Water Mixing Event Identification in the Koljö Fjord Observatory Data”, submitted toInternational Journal of Data Science and Analytics.
Paper V
M. Götz, G. Cavallaro, T. Géraud, M. Book, M. Riedel, “Parallel Computation of
Component Trees on Distributed Memory Machines”, submitted to Transactions
Paper VI
M Götz, M. Book, C. Bodenstein, M. Riedel, “Supporting Software Engineering
Practices in the Development of Data-Intensive HPC Applications with the JuML Framework”, inACM Proceedings of the International Workshop on Software Engi-neering for High Performance Computing in Computational and Data-Enabled Sci-ence and Engineering, The International ConferSci-ence for High Performance
Com-puting, Networking, Storage and Analysis, Denver, USA, 2017, pp. 1-8.
1.4 Contributions
The main contributions of this thesis are subdivided into three major categories. First, the analysis of data-intensive, scientific use cases with an emphasis on Earth sciences. The analysis has contributed to or established the state of the art for the particular analysis problem, e.g.:
• unsupervised object segmentation in point clouds (Paper II), • unsupervised depth-separated object segmentation (Paper III), • semi-supervised classification of water mixing events (Paper IV) and • supervised land cover type classification using attribute filters (Paper V). Second, the parallelization of existing data analysis algorithms that are em-ployed in the use cases, targeting distributed-memory environments and thereby enabling scalability with respect to processing time and memory consumption. In particular, these are:
• the formulation of a parallel DBSCAN (Paper II) and • a parallel min- and max-tree algorithm (Paper V).
Both have outperformed the state of the art—even by orders of magnitudes with respect to memory consumption.
Third, a generalized paradigm for the design of parallel and scalable data analy-sis algorithms suitable for processing a large number of samples has been proposed. Following well-established engineering practices, the algorithmic components have been abstracted and bundled into a prototypical data analysis library, called JuML, aimed for the use in heterogeneous distributed-memory HPC systems, which is pre-sented inPaper VI. An overview of the relation between the contributions and the publications can be found in Table 1.1.
Table 1.1: Relation matrix of publication contributions and research questions. RQ
Paper
Paper I Paper II Paper III Paper IV Paper V Paper VI
RQ 1 X
RQ 2 X X X X
RQ 3 X
In line with the thesis, a number of software artifacts have been created, along with JuML, which has been open-sourced. Table 1.2 shows how the software cre-ation and utilizcre-ation relates to the publiccre-ations. These are already in productive use. A non-exhaustive list includes the FLORIDA assay software, HPDBSCAN on the Blacklight and DEEP-EST supercomputing systems and the distributed max-tree algorithm at the Research Centre Jülich. JuML will serve as the conceptual template for the plannedHelmholtz Analytics Framework(HAF).
Table 1.2: Relation matrix of software contributions and publications. RQ
Paper
Paper I Paper II Paper III Paper IV Paper V Paper VI
Software I - HPDBSCAN X X X X
Software II - FLORIDA X
Software III - PANGAEA X
Software IV - DMT X
Background
2.1 Data Analysis
In this section the methods and processes for analyzing data is presented in de-tail in order to empower the reader to better follow the use cases introduced in Chapter 3. As a matter of fact, the field is so large that only a small portion of it can be represented here. Therefore, the focus is put on data mining approaches, in particular clustering, as well as machine learning approaches, which have di-rectly or indidi-rectly been used in the problems’ analysis. Machine learning enables the purely data-driven construction of systems without explicit programming. This means that the inner workings, or in abstract terms the system’s function, is purely derived from patterns within explanatory data. The process of deriving this func-tion is called training or learning. Generally, learners can be distinguished into a number of categories based the way they learn and the data analysis task. The following sections will introduce both concepts briefly.
2.1.1 Learning Approaches
Supervised learning occurs when the pattern, or in jargon ground truth, is known
and provided as additional training input. That is, the learner is trained based on data samples containing both the attributes, i.e. a vector of descriptive values, and the labels, i.e. the pattern. A graphic example from biology could be a system that divides flowers into different species (the label) based on their color, petal sizes and height (the attribute vector).
Unsupervised learning is performed without any ground truth solely on the
at-tributes of the data samples. This is usually employed for explorative data analysis and machine learning and results in the grouping or clustering of the data. In order to be able to tell whether a number of samples belong into one category, their re-semblance is judged based on a similarity function, which is maximized during the learning. Reusing the flower example mentioned above, each of the species would ideally be part of a separate group after an unsupervised training.
The last category isreinforcement learning. It also does not require any labels. However, in contrast to unsupervised learning, the system would not consider sin-gle instances, but the problem as a whole. A reinforcement learner would simply propose a solution, initially often a random one, that would be assessed using a punishment-and-reward-function. Based on the received feedback, the reinforce-ment learner will memorize good behavior, i.e. the correct parts of the answer, and forget incorrect labeling.
2.1.2 Learning Tasks
−20 20 40 60 1,000 2,000 3,000 4,000 (a) Regression 1 2 3 4 0.4 0.6 0.8 (b) Classification 0.2 0.4 0.6 0.8 1 0.2 0.4 0.6 0.8 1 (c) Clustering Figure 2.1: Visualization of the major data analysis tasks.The second major distinction between different machine learning systems can be made based on the desired output. The most general form of a learning tasks is the so-called regression and refers to learning an arbitrarily shaped function. In line with that, the learning system shall be able to determine for any given domain value xthe respective codomain value Y. In practice this will usually be an approximation, or prediction, and is denoted asYˆ. Typically regression is used in forecasting problems, e.g. stock market or weather prediction. Common models for performing regression are ordinary least squares [17], logistic regression [18], support vector regression [19] and artificial Neural Network (NN) [20]. For time series regression there are additional models such as Auto-Regressive Integrated
Moving-Average (ARIMA) [21] or recurrent neural networks [22].
Classification is a special form of regression problem, in which a function, often
piecewise, has to be found that separates classes of samples from each other, usually based on the provided labels. The simplest form of classification is binary, where only two classes exist—i.e. belongs to a given class or not. This basic classifier can then be extended to perform multiclass classification [23]. There are different approaches to do so, such as one-versus-one or one-versus-all for example. They are founded in building binary classifiers that distinguish one particular against all other available, but differ in the way the victor is selected. Common classification models are decision trees [24], random forests [25] (decision tree ensembles),Support
Vector Machine(SVM) [26] and NN.
Outlier or anomaly detection is a specific form of classification, in which
found. Such a problem can be solved using supervised classification as introduced above, but can also be identified based on the outliers’ dissimilarities towards the other samples. This leads to the third major algorithm group,clustering, which is about identifying groups by maximizing the intra-group similarity and the inter-group dissimilarity. Well-known clustering algorithms are hierarchical clustering, k-means [27], DBSCAN [28] andSelf-Organizing Map (SOM) [29]. Figure 2.1 de-picts all of the introduced learning approaches and tasks graphically.
2.1.3 Data Analysis Process
There are a number of standard processes for approaching data-driven analysis problems. The three major ones areKnowledge Discovery in Databases(KDD) [30],
Sample-Explore-Modify-Model-Assess(SEMMA) [31] andCRoss Industry Standard
Process for Data Mining(CRISP-DM) [32]. Despite small differences, all of these
include the same conceptual steps shown below [33]. Based on these steps, one is able to identify the opportunities assisting the analysis process through technical means, from which requirements for the data analysis framework can be derived.
Selection is the process of understanding the domain problem, the data aspects
and formats involved in the data analysis challenge. Based on this a suitable dataset needs to be obtained through collection or selection of already existing samples.
Exploration is initially required to understand the properties of the data. For this
visualization of the data is necessary as well as the computation of descriptive statistical values. Especially data quality problems need to be uncovered here, such as noise or missing values. Based on that a first model hypothesis can be defined.
Preprocessing is a technical step in which the data quality is improved to the
point it can be utilized for model construction. This involves, among others, data interpolation, outlier removal and noise reduction, duplicate elimina-tion, feature engineering, data augmentation and class imbalance correction through synthetization. In practice, data preprocessing is an iterative ap-proach that is revisited multiple times through the entire analysis.
Analysis is the step of the actual model construction. Due to the identified
analy-sis task an appropriate supervised or unsupervised data analyanaly-sis algorithm is selected and trained to approximate the problem as good as possible. Similar to data preprocessing, this is an iterative step, fine-tuning and optimizing the devised stochastic model.
Evaluation is the step of assessing the model’s performance based on some
mea-sure, like the prediction accuracy for example, compared to the desired anal-ysis task. Based on that, new models or variants of it need to be considered. An essential part of the evaluation is the fine-tuning of hyperparameters as well as the estimation of its generalization.
Deployment is the phase of setting up the selected model for productive use. This is usually a technical process involving the installation of suitable execution environments, development efforts to scale the analysis pipeline to production data sizes and continuous administration and maintenance.
2.2 High-Performance Computing
In this section a background in the field of HPC is introduced. The main focus is put on explaining the technical aspects of modern clusters and supercomputers to explain why parallel and scalable data analysis algorithms have to fulfill certain technical requirements to make them usable and efficient on these systems. There-fore Subsection 2.2.1 introduces hardware related topics, while Subsection 2.2.2 is presenting programming models available for the implementation of algorithms on top of the explained computer systems.
2.2.1 System Architectures
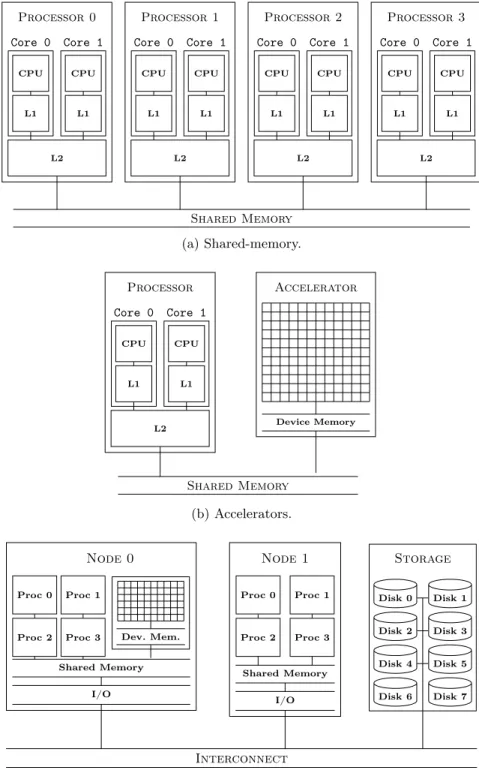
Modern HPC systems and supercomputers are a potpourri of different designs, ar-chitectures and hardware platforms. However, some of these are more wide-spread and dominant than others. In particular, these are usually inherently parallel, het-erogeneous, modularised commodity cluster systems with multi-core processors and optional accelerators. Figure 2.2 depicts these common architectures or their parts schematically.
The most basic component of a cluster is a so-called node. This is a singular multi-core or -processor computer as can be seen in Figure 2.2a. Each node has a number of processors, which in turn have several cores, representing the most basic computation unit. Cores can exchange information with each other via an on-chip network and a shared memory accessible via a hierarchy of intermediary, faster to access caches 1. An arbitrary memory entry can potentially reside in multiple
caches of different cores at once. In order to prevent data races, it must be kept consistent across all cores, realized by a so-calledcache-coherence-protocol. Finally, the shared memory is nowadays often divided into parts that can be either slower or faster accessed by a given core or processor. Such an approach is called
Non-Uniform Memory Access (NUMA), opposed to the traditional Uniform Memory
Access(UMA). Processors in shared memory architectures usually work according
to theMultiple-Instructions-Multiple-Data(MIMD) principle [34]. This means that each processor can execute a different program on different parts of the memory at any given time, consequently allowing efficient execution of task-parallel workloads. Also, there is a trend in the last decade to utilize special accelerator hard-ware. Well-known examples are Field Programmable Gate Array (FPGA),
Many-Integrated-Cores (MIC) or General Purpose Graphics Processing Unit (GPGPU)
technologies. These are usually designed (especially the latter) to work in a
Single-Instruction-Multiple-Data (SIMD) [34] fashion. This means that each of the cores
on the accelerator execute the same operation at the same time, often in a lockstep 1Usually denoted by a capital L for the level and a number for the hierarchy distance to the core.
Processor 0 CPU L1 Core 0 CPU L1 Core 1 L2 Processor 1 CPU L1 Core 0 CPU L1 Core 1 L2 Processor 2 CPU L1 Core 0 CPU L1 Core 1 L2 Processor 3 CPU L1 Core 0 CPU L1 Core 1 L2 Shared Memory (a) Shared-memory. Processor CPU L1 Core 0 CPU L1 Core 1 L2 Accelerator Device Memory Shared Memory (b) Accelerators. Node 0 Proc 1 Proc 0
Proc 2 Proc 3 Dev. Mem.
Shared Memory I/O Node 1 Proc 0 Proc 1 Proc 2 Proc 3 Shared Memory I/O Storage Disk 0 Disk 1 Disk 2 Disk 3 Disk 4 Disk 5 Disk 6 Disk 7 Interconnect (c) Distributed-memory.
mode. In line with that, independent and embarrassingly parallel vector operations, such as for example stencils or tensor operators, are the preferred computational problem to be solved using accelerators. Fitting for this use case, the number of pro-cessing units or cores is usually very high, compared to the previously introduced processor-based shared memory design, with core counts ranging from dozens to hundreds or thousands (depicted as grid in Figure 2.2b), though they are individ-ually less versatile and fast. An accelerator is usindivid-ually fed data from the shared memory via the bus of the so-calledhost processor and has to be explicitly trans-ferred between the two devices. This adds significant overhead due to bus and memory bandwidth limitations, if repeatedly done, and should be avoided in fa-vor of more computations on the accelerator. Distinct accelerator applications in data-analysis include, among others, computation of sample statistics, preprocess-ing and normalization of the datasets and matrix and tensor multiplications in neural networks.
The scalability of shared memory designs or accelerators has inherent bound-aries. This can be attributed, for instance, to overheads in synchronization, physical heat development on the dies, signal conductor delays or, particularly for acceler-ators, unfitting computational problems. Therefore, in order to further increase computational processing performance and capabilities, one needs to scale out hor-izontally. One can usually achieve this in most modern HPC and supercomputer systems by connecting multiple nodes using an interconnect with one another into a computer cluster system. Due to the separate memories this is also called a
dis-tributed memory system (a schematic depiction is displayed in Figure 2.2c). In the
past the individual nodes used to be homogeneous, i.e., of the same kind. However, nowadays systems tend to be heterogeneous, meaning nodes with different capabil-ities are mixed within the system. For example, there could be nodes with more or less local memory, different processor counts or additional built-in accelerators. The storage system, or simply the hard disk, can be either node-local or, especially for larger systems, a separate entity that is attached to the interconnect. This allows the independent scaling of the I/O system and enables parallel data access.
2.2.2 Programming Models
The de-facto standard for programming distributed memory systems in the context of HPC is the Message Passing Interface(MPI) [35]. It is an API with over 500 functions that define a set of communication primitives to pass binary data. They can be roughly divided into two categories.
Firstly, there are point-to-point message passing operations between particular nodes, such as send and receive. Both the sender and recipient are uniquely identi-fied by a contiguously enumerated ID for a node, calledrank, in the interval[0, size[, with sizebeing the total number of nodes. This information is encapsulated into handle for the nodes set that is called acommunicator.
Secondly, there are collective operations. These are one or many-to-many operations that can be implemented efficiently across larger node counts, using communication trees for example, and are the major reason for MPI’s suc-cess in HPC. Examples for collective operations are reduction operations, data
broadcasts or gathering. The actual low-level networking library code needs to be provided by the implenter of the particular MPI stack and needs to be tailored to the used interconnect. Prominent interconnect representatives are for example MyriNet [36], Infiniband [37] or Omni-Path [38].
Parallel programming models for shared memory architectures are slightly more diverse, but have matured to a point that only a small number of major ones exist. First and foremost, there is traditional thread-based parallelization. Being
anOperating System(OS) resource concept, each of them provide their own API
for creating and managing threads. Higher-level languages, such as Python, and as of late also traditional languages such as C++, offer OS-independent abstractions. The typical parallelization approach is to spawn a single thread per core and assign it a part or sub-task of the problem, e.g. chunks of an input vector or tensor an operation needs to be applied to.
Due to the fact that this pattern is so common, another, annotation-based pro-gramming model calledOpen Multiprocessing(OpenMP) [39] has established itself. It encapsulates these patterns usually in a few lines of code annotations, which are in turn translated by the supporting compiler into parallel code, mostly based on threads that are spawned from the main or master execution thread. Moreover, OpenMP also assists with the synchronization by providing atomic variables, bar-riers and so forth. A combination of the OpenMP and MPI programming models in a single application is often referred to as ahybrid.
Lately, OpenMP has also adopted an extension that allows to program ac-celerators. This adds to the large potpourri of programming models and lan-guages designed for these specialized architectures. Alternatives for annotation-based parallelization with OpenMP areOpen Hybrid Multicore Parallel Program-ming (OpenHMPP) [40] and Open Accelerators (OpenACC) [41], following the same API design principles. An programmatic alternative to that isOpen
Comput-ing Language(OpenCL) [42], which allows the implementation of more fine granular
parallelization strategies. In principle it can be used for any kind of acceleration hardware, given that a supporting compiler exists, and is in practice often used for GPGPUs. This makes OpenCL the major alternative to Nvidia’s proprietary
Compute Unified Device Architecture(CUDA) GPGPU [43] programming model.
The latter is highly optimized for, but also restricted to the companies’ hardware. It enjoys widespread use due to its early release, the widespread of Nvidia GPGPUs in HPC and its lean API, compared to OpenCL, because of the narrower focus. However, a number of vendors, e.g. Intel and Altera, have picked up OpenCL as a standard programming model for their MICs [44] and FPGAs respectively, making it highly versatile.
It should have become clear that in order to efficiently exploit the capabilities of modern HPC systems, the development of hybrid applications, employing multiple programming models at once, is necessary. As a result the development time and complexity increases, especially with respect to portability to new HPC systems and technologies. Therefore, a number of wrapper technologies and libraries start to appear. The two major ones being ArrayFire [45] and TensorFlow [46]. These do not only encapsulate the complexity of the different programming models and automatically select the right operation kernel depending on the selected execution device, but are also more abstract in terms of the offered API. This means they include already parallelized, high-level vector operations such as statistics, stencil filters or arithmetical operators. They can be seen as more feature-complete basic linear algebra libraries, which also offers a number of highly optimized routines needed in data analysis. While they are a solid foundation to develop on single heterogeneous nodes, one needs to also take into account that they cannot efficiently exploit distributed computing resources and in line with that the capabilities of modern HPC systems. Therefore, a truly large-scale data analysis framework in the context of HPC needs to push the boundaries further and also utilize MPI to allow stronger, horizontal scaling. As stated in RQ four, one major task is to design and develop such a toolkit, if possible. Therefore, it follows that it also needs to utilize the presented parallel programming models.
Summary of the Publications
3.1 Paper I: On Scalable Data Mining Techniques for Earth
Science
M. Götz, M. Richerzhagen, C. Bodenstein, G. Cavallaro, P. Glock, M. Riedel,
Morris, J. A. Benediktsson, “On Scalable Data Mining Techniques for Earth Sci-ence”, in the journal Elsevier Procedia Computer Science, 51(C), pp. 2188-2197, 2015.
This publication contributes to the first research question by surveying the cur-rent state of the art in parallel libraries and tooling for data analysis with a focus on Earth Sciences.
This paper presents a technology survey of non-commercial, open-source tools and libraries for two different data analysis algorithms: non-linear SVMs and DB-SCAN. In line with that, their suitability to handle current and future Big Data datasets have been evaluated (contribution toRQ 1). This includes, among other things, the possibility to deploy the implementations on HPC systems. Hence, a number of technical capabilities have been evaluated, such as the inclusion of par-allel I/O, the degree of parpar-allelization and the correctness of the computed results. The first part of the publication is concerned with parallel SVMs [26]. Only three out of the twelve evaluated candidate tools have parallel implementations to begin with and were therefore investigated futher. The Apache Spark-based imple-mentation in MLlib [47] is one of them. It is severely limited in analysis capability, due to the fact that it only supports linear kernel functions. This means that clas-sification problems with a non-linearly separable decision boundary, i.e. interlaced instances of different classes, cannot be solved. As a result, MLlib is unable to construct effective classification models for typical real-world applications that are especially predominant in science. The other two candidates are GPU LibSVM [48], which only supports CUDA devices, and an MPI-based solution calledπSVM [49], which is targeting CPUs. Both of them posses the possibility to construct non-linear models through the implementation of advanced kernel functions.
Based on its dissemination, the latter has been selected for further optimiza-tion. In particular, the memory access and communication pattern—and through that workload balancing—were sub-optimal. In the publication an improved access strategy is proposed, so that the number of computations is equal on each of the processing nodes. A detailed explanation of this strategy and an implementation of this concept is given in the bachelor thesis of Matthias Richerzhagen Richerzhagen [50], supervised by the author.
(a) Raw data. (b) Objects segmented using DBSCAN.
Figure 3.1: Example point cloud from the old-town of Bremen.
The second set of surveyed implementation concerns the unsupervised clustering algorithm DBSCAN (see also Section 3.2.1), motivated by an object segmentation use case in multi-dimensional point clouds. Point clouds are point-wise recordings of spatial locations in a given coordinate space, usually the euclidean. They are often used to represent objects or surfaces like landmasses or areas. The recorded values include the spatial three-dimensional vector componentsx,yandz, as well as potentially additional values such as parts of the electro-magnetic spectrum, like heat radiation, for example. Analysis of the data usually try to reconstruct and segment objects present in reality [51]. Figure 3.1 depicts a point cloud of the old town of Bremen, Germany, captured using an aerial drone scan as well as the result of a clustering-based object segmentation of the buildings. The survey shows that only a limit set of data analysis libraries support a DBSCAN-based analysis to begin with, and if so, are not well parallelized. In particular for HPC technology stacks, there is only one implementation available called PDSDBSCAN [52], which has fundamental flaws in the utilization of memory. This was the motivation to review the parallelization strategy, resulting in HPDBSCAN presented in Section 3.2.
The publication concludes that the current situation in availability and stability of scalable data analysis tools needs improvement. Based on the two presented algorithm examples, which are both in widespread use in applications, it is argued that the ability to process large data sets is limited. Even though data analysis is, in terms of resource utilization, still far behind traditional HPC applications, like numerical simulations, one can expect an increasing demand. Therefore, scalable and parallel algorithm implementation are required and engineering and research efforts should be increased in this field.
3.2 Paper II: HPDBSCAN—Highly Parallel DBSCAN
M. Götz, C. Bodenstein, M. Riedel, “HPDBSCAN: Highly Parallel DBSCAN”,
in ACM Proceedings of the Workshop on Machine Learning in High-Performance
Computing Environments, The International Conference for High Performance
Computing, Networking, Storage and Analysis, Austin, USA, pp. 2:1-2:10, 2015.
This publication contributes to the second research questions as it explains a scalable parallelization strategy for DBSCAN, which can be used, for example, for point cloud analysis in the Earth Sciences. Moreover, it contributes to the fourth research question as it utilizes recurring components, which will be explained later in Section 3.5 and Chapter 4, that can be abstracted into a generalized analysis framework.
The following section introduces the original DBSCAN clustering algorithm first. Afterwards, Section 3.2.2 presents the parallelization strategy envisioned in the context of this thesis in details.
3.2.1 DBSCAN
Noise Core ε Border DDR DC DRFigure 3.2: Example DBSCAN clustering withminP oints= 4.
In 1996 Ester et al. [28] introduced a novel density-based clustering algorithm group by formulating DBSCAN. Its main principle is to recursively expand clus-ters through the evaluation of a spatial density criteria. For this, it scans the entire database of points and evaluates for each of them in a search radiusεhow many neighboring points exist using a given distance function dist. If the density crite-ria minP ointsfor the number of neighbors is satisfied, then the current point is a core point of a cluster. This cluster may be an entirely new set or is absorbed by the cluster of a neighboring core point within the search radius. If a point is neither absorbed nor fulfills the core criteria itself, it is marked as noise. DBSCAN has a number of advantageous properties compared to other clustering algorithms,
such as k-means [27]. First, it has a lower number of intuitively selectable parame-ters, which can often be easily determined for lower-dimensional problems. Second, DBSCAN is able to identify a previously unknown number of arbitrarily shaped clusters. This is a powerful analysis property as it reduces the number of potentially hard-to-determine model parameters. Finally, the algorithm is robust towards noise due to a built-in filtering mechanism, enabling the analysis of datasets with strong outliers. Especially the last property is beneficial for actual real-world analysis as the use cases in Section 3.3 and 3.4 are going to demonstrate. Figure 3.2 depicts an exemplary DBSCAN clustering.
3.2.2 Parallelization Strategy
Paper II presents a parallelization strategy for DBSCAN called HPDBSCAN (con-tributing to RQ 2). Its core concept follows a divide-and-conquer-approach: the entire dataset is initially equally divided among all available processing cores, then a local partial DBSCAN result is computed, which can then successively merged into a correct global clustering.
In skewed datasets, the spatial partition should not be carried out in regular intervals, because the point density of the spatial chunks may be highly imbalanced and result in an inferior workload-balance. Therefore, the publication proposes a split heuristic based on the number of compute-intensive evaluations of the dist function. For this, each point is uniquely associated with an ε-sized spatial cell of an overlayed, disjoint hypergrid index structure. Each cell receives a score—the sum of the number of points within the cell and its direct neighbors, equal to thedist invocations—which is instead evenly divided among the available processing cores. This requires to sort and redistribute the dataset in order to maintain full spatial information of a contiguous data chunk. Furthermore, a small overlap (halo) of a single layer of ε-cells is necessary to avoid communication with processing cores, clustering the immediately adjacent chunks of the spatial decomposition. Figure 3.3 shows an example of the explained indexing and score-based decomposition step.
36 16 18 28 92 68 24 54 26 6 1 2 3 2 processor 1 processor 2
∑(Costprocessor 1)=368 ∑(Costprocessor 2)=8
(a) Naïve strategy.
36 16 18 28 92 68 24 54 26 6 1 2 3 2 processor 1 processor 2
∑(Costprocessor 1)=190 ∑(Costprocessor 2)=186
(b) Proposed strategy.
Figure 3.3: Spatial domain decomposition strategies for parallelizing DBSCAN. The partition boundary between the processors is shown as a dashed line and the overlapping halo cells in a hatched pattern.
After locally computing the DBSCAN clustering, the partial results need to be merged. This is achieved by finding differences in the cluster labeling in the halos of the domain decomposition. Through transitive cluster ID remapping rules and
a local recoloring step on each processor, the distributed DBSCAN computation results in an equal result compared to a single-threaded execution.
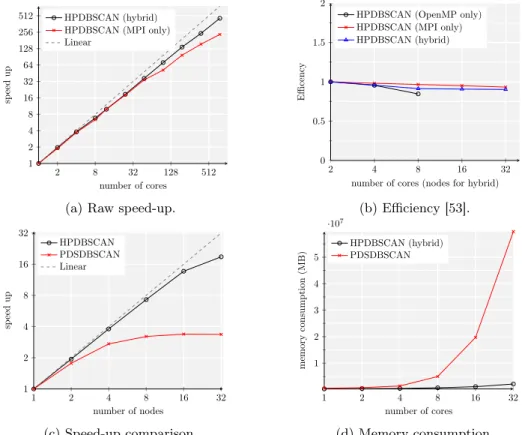
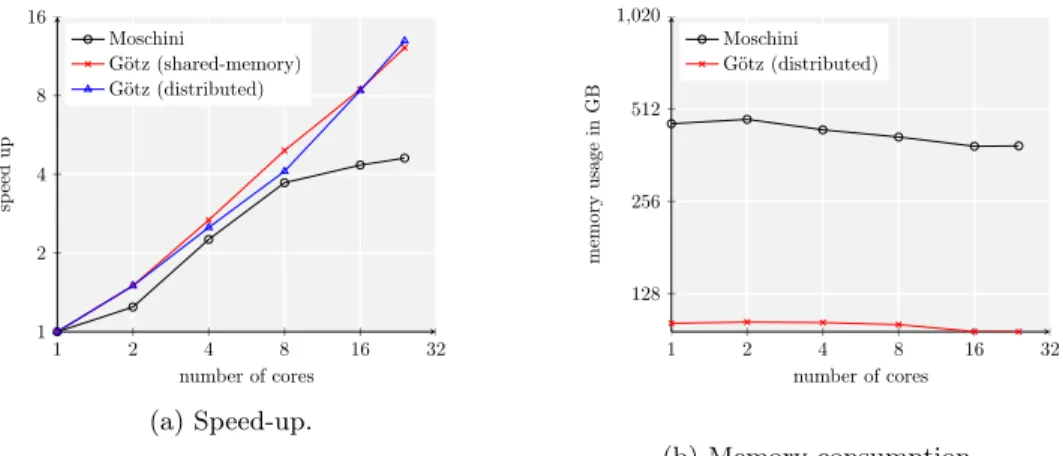
The proposed parallel algorithm is suitable for the execution on both shared-and distributed memory systems shared-and has been implemented as a OpenMP shared-and MPI hybrid in C++. The source code is publicly available and is referenced in the List of Publications. A thorough evaluation of strong and weak scaling properties as well the memory consumption properties of HPDBSCAN has been carried out. The parallelized algorithm outperforms the then state-of-the-art alternative PDS-DBSCAN [52] in terms of computation time, strong and weak scaling and most importantly memory consumption. Figure 3.4 depicts the obtained experimental results. 2 8 32 128 512 1 2 4 8 16 32 64 128 256 512 number of cores sp eed up HPDBSCAN (hybrid) HPDBSCAN (MPI only) Linear
(a) Raw speed-up.
2 4 8 16 32 0 0.5 1 1.5 2
number of cores (nodes for hybrid)
Efficency
HPDBSCAN (OpenMP only) HPDBSCAN (MPI only) HPDBSCAN (hybrid) (b) Efficiency [53]. 1 2 4 8 16 32 1 2 4 8 16 32 number of nodes sp eed up HPDBSCAN PDSDBSCAN Linear (c) Speed-up comparison. 1 2 4 8 16 32 1 2 3 4 5 ·107 number of cores memory consumption (MB) HPDBSCAN (hybrid) PDSDBSCAN (d) Memory consumption. Figure 3.4: Experimental evaluation of HPDBSCAN’s performance.
3.3 Paper III: Automatic Object Detection Using DBSCAN
for Counting Intoxicated Flies in the FLORIDA Assay.
C. Bodenstein,M Götz, A. Jansen, H. Scholz, M. Riedel, “Automatic Object De-tection Using DBSCAN for Counting Intoxicated Flies in the FLORIDA Assay”,in Proceedings of 15th IEEE International Conference on Machine Learning and
Applications (ICMLA), Los Angeles, USA, pp. 746-751, 2016.
This publication contributes to the third research question in that it demon-strates the applicability of HPDBSCAN for problems outside the Earth Sciences. Furthermore, the reoccurring usage of grid search hyper parameter optimization demonstrates the need for an abstracted implementation in a data analysis library, directly contributing to Research Question Four.
The FLORIDA assay is an experiment currently researched on by the Biological Department at the University of Cologne. In order to be able to understand the involved data analysis problem, the assay is introduced first, before the proposed analysis pipeline is presented later in Section 3.3.2.
3.3.1 The FLORIDA Assay
The FLORIDA assay is concerned with identifying the impact of genetic code and brain structures responsible for alcohol tolerance and, by extension, abuse [54]. Due to similarities in behavior and genetic code compared to humans, the common vinegar fly is used as experimental animal [55]. Genetically altered individuals are exposed to vaporized alcohol before their loss of righting reflex, an indicator for intoxication, is tested. For this, the flies’ experimentation container is shaken and observed over time. Vinegar flies with an intoxication level below a certain threshold will automatically fly up towards the lid. Individuals too heavily affected by the alcohol instead are going to gather at the bottom of the container. Based on these two behaviors, a correlation between gene alterations and alcohol tolerance can be derived.
3.3.2 Depth-Separated Image Segmentation
Until recently, these experiments have been conducted manually by laboratory assistants counting the sober and intoxicated flies. This is a error prone and expen-sive process, which this publication tries to overcome. In this work, an automatic hard- and software pipeline testing the righting reflex in addition to segmenting and counting the intoxicated individuals is proposed. The experimentation appa-ratus consists of a suspended, perforated plate for the vials, an SLR camera taking images, an electric engine instigating the righting reflex, a backlight and finally a computer connecting the individual parts. Figure 3.5 depicts a schematic overview of the proposed experimentation apparatus.
A software specifically designed for the experiment performs the actual analysis. It can be summarized as an image recognition and segmentation problem with scale
1 2 3
4
5
6
Figure 3.5: Schematic of the FLORIDA assay experiment’s hardware setup. variance—i.e. distance to the focus and image depth separation matters. Traditional techniques likeScale-Invariant Feature Transform (SIFT) [56] are not applicable, as they would not be able to distinguish flies at the top from the ones at the bottom of the container due to the scale invariant properties of the algorithm. Fully supervised learning approaches, based on neural networks for example [57], are possible but require a labor-intensive and tedious label creation process.
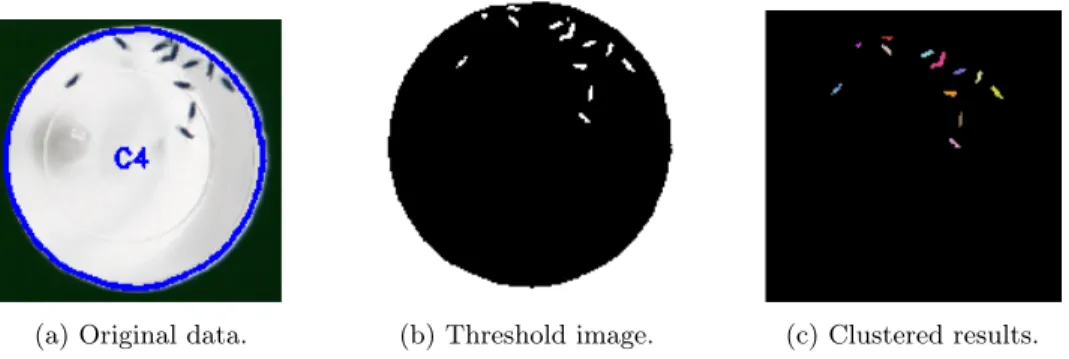
(a) Original data. (b) Threshold image. (c) Clustered results.
Figure 3.6: Processing stages of the FLORIDA assay depth-perception problem. Therefore, Paper III proposes a semi-supervised approach, estimating fly count within the experimentation vials using clustering approaches. For this, the vials are first green-screened, then a binary threshold image is calculated and finally the pixels clustered using HPDBSCAN (contribution toRQ 3). Only flies that are close to the camera will appear as a distinct cluster due to their size (and therefore pixel density) and result in a counted fly. In comparison to existing image segmentation solutions based on clustering [58], this has the major advantage of being robust to noise, not having to know the cluster count—i.e. the analysis task.
The parameters for the analysis model can in principle be set in the software’s interface along other experimentation parameters, such as the vial shaking time and so forth. However, they have been optimized through a MPI-parallelized hyper parameter search (contribution toRQ 4), resulting in the experiments default
set-tings. Thereby, the analysis has achieved a mean-squared-error of 1.745, i.e. it is on average off by 1.745 flies in comparison to reality. Figure 3.6 depicts the described analysis stages, which are also visualized for the analysts in the software’s graphical user interface. The collaboration partner, the Biological Department at the Uni-versity of Cologne, has deployed the hardware and analysis script for production in the FLORIDA assay and is using it on a daily basis for months now.
3.4 Paper IV: Automatic Water Mixing Event Identification
in the Koljö Fjord Observatory Data
M. Götz, M. Kononets, C. Bodenstein, M. Riedel, M. Book, O. P. Pálsson,
“Au-tomatic Water Mixing Event Identification in the Koljö Fjord Observatory Data”, submitted toInternational Journal of Data Science and Analytics.
This publication contributes to the second research questions as it shows the vi-ability for an abstracted, parallel grid search optimizer for Earth Science models. In addition to that, it shows that standard analysis algorithm, in this case DBSCAN, should be bundled in a data analysis library.
The Koljö fjord observatory is an oceanographic experiment hosted by the Uni-versity of Gothenburg, Sweden. Section 3.4.1 will introduce its structure and ob-servation task, before the proposed analysis solution envisioned in this paper is presented in Section 3.4.2.
3.4.1 Koljö Fjord Observatory
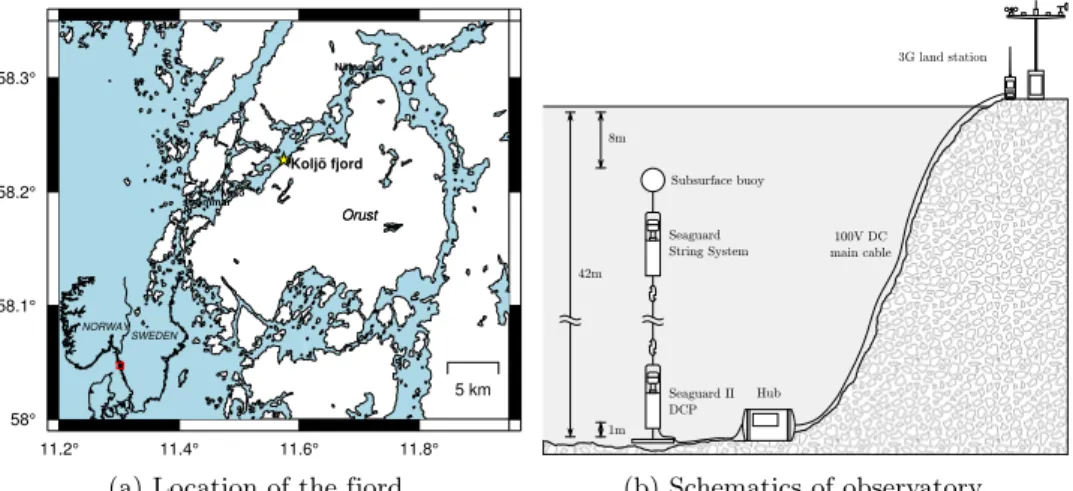
The Koljö fjord observatory [59] is located in the eponymous waterway in Sweden. It has a threefold objective. First, testing prototypical measurement technology, sec-ond, monitoring of the fjord’s health, and third, the study of oceanographic cycles of water exchange between the ocean and rivers. Using anchored underwater sen-sor equipment the observatory measures various properties of the contained water, such as temperature, salinity, oxygenation and others, which allow the subsequent analysis. One particular problem of interest are so-called water mixing events, i.e. periods of time when water from the ocean or the connected rivers flow into the fjord and change its water properties.
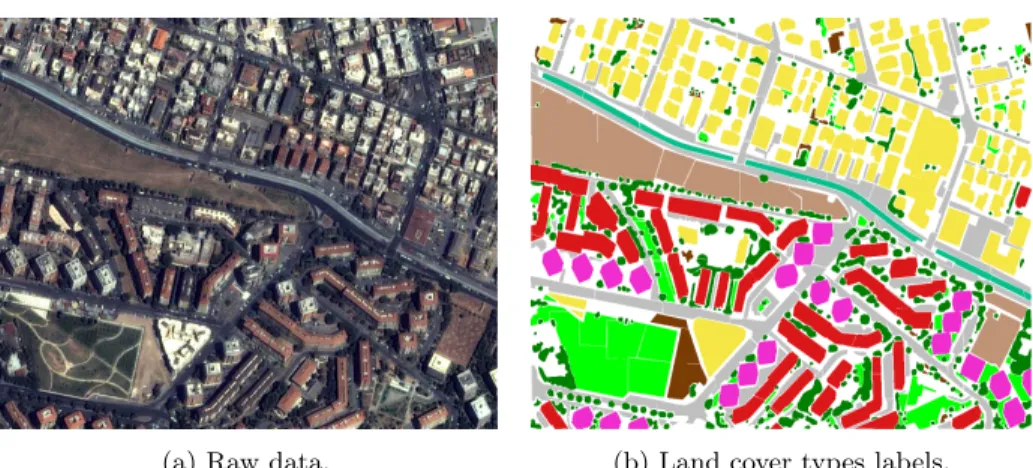
11.2° 11.4° 11.6° 11.8° 58° 58.1° 58.2° 58.3° 5 km Malö strömmar Nötesund Koljö fjord Orust Orust SWEDEN NORWAY
(a) Location of the fjord.
42m 8m 1m 3G land station Hub 100V DC main cable Subsurface buoy Seaguard II DCP Seaguard String System (b) Schematics of observatory. Figure 3.7: The Koljö fjord observatory.
Every half hour the sensors are being read out, resulting in a multi-variate time series data set that has started collection in 2011. Figure 3.7 depicts the loca-tions and a schematic overview of the Koljö fjord observatory including the sensors attached to the string system. This analysis is the first to consider open water mix-ing event detection, a much more difficult analysis task due to the dynamic system and amounts of noise, compared to that of the previously investigated closed water systems [60, 61].
3.4.2 Water Mixing Event Detection
The analysis goal is basically an outlier detection problem in multi-variate time series data. A supervised learning approach is not feasible, because there are no exact per-sample labels. There is still no consensus among domain scientists about how to define a water mixing event start and end. Instead, only the fuzzy center points of the events are known and can be used for validation. This has resulted in the utilization of an unsupervised learning models based on clustering.
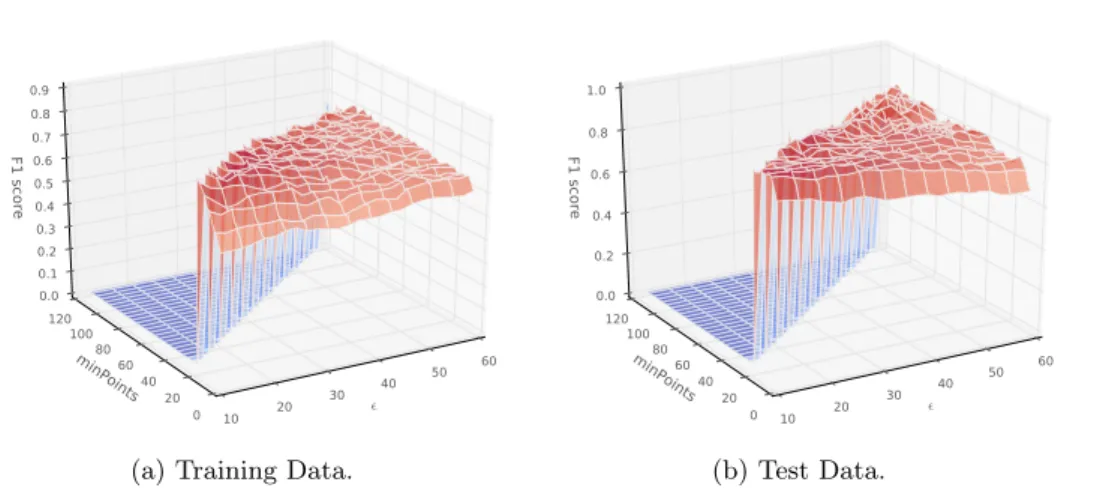
After extensive preprocessing, in which the data gaps have been interpolated and smoothed using median and moving-average filters [62], the model suggested in Equation (3.1) has been applied, with∆d being thed-step discrete gradient [63],σ the standard deviations,ca confidence interval factor andX the signals. It detects strong peaks or drops in the signals via the discrete time gradient, marks them as univariate outliers if outside a certain confidence interval and subsequently clusters them using HPDBSCAN (contribution to RQ 2). Given that a cluster spans a water mixing event’s center point, the event is considered detected.
Due to the high imbalance of false-negatives (regular days) compared to true-positives (actual mixing events) the model’s performance needs to be measured accordingly. For this, the F1-measure [64] has been selected, as can be seen in Equation (3.2), the harmonic mean ofprecision andrecall [65]. The model�
![Figure 4.2: U ML class diagram [1] of JuML’s system structure.](https://thumb-us.123doks.com/thumbv2/123dok_us/56500.2506727/62.748.207.516.123.943/figure-u-ml-class-diagram-juml-system-structure.webp)
