Modeling and Simulation of Controller for Solar Photovoltaic System
Manish Kumar1,Y. K. Vijay2, M. Rizwan3
1Department of Electrical Engineering, VGU Jaipur, [email protected]
2Department of Physics, VGU Jaipur
3Department of Electrical Engineering, DTU Delhi
Abstract— Solar energy photons incident on the earth surface are variable in nature. So to achieve maximum power from the PV module is necessary, which can only be achieved by MPPT applied to the boost converter. To track the MPP, there are some specific approaches like: P&O, incremental conductance and open circuit voltage. They all have their specific qualities and used as per requirements. But in this research work P&O technique is used for MPPT. The DC output voltage is converted to AC voltage using inverter. The technique used in inverter is as current control technique for voltage source inverter. From this inverter rectangular pulse supply is generated, which further filtered by LC or LCL filters as per requirement. But in this paper a normal LC filter is used. This complete design is installed in MATLAB/SIMULINK for simulate the designed models and the results are verified at many operating points to check the system stability, quality and effectiveness. Keywords: — MPPT, Boost Converter, Inverter, Filter and Photovoltaic.
I. INTRODUCTION
India is a densely populated and developing country. The factors influencing its status are very common but lack of electricity is also a big issue in the development of this country. This factor can be eliminated by providing estimated electricity to the increasing load demands. In rural areas where power supply is very unstable due to lack of quantity, there renewable power generation takes place for that small need. Solar power generation also generates by two ways: solar photo voltaic and solar thermal. The power generation from solar photo voltaic depends upon external parameters as irradiance and temperature. These two parameters are almost variable in nature at every instant. So it is hard to get stable output voltage from the cell. The efficiency of conversion is also very low and the signal converters make the voltage worst. To get constant voltage at any time the maximum power point tracking techniques are used.
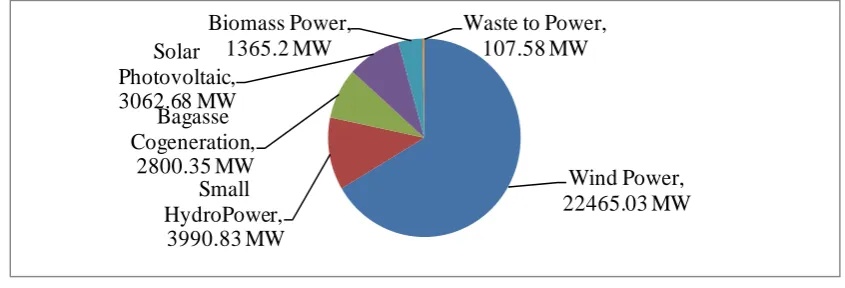
Figure 1. Renewable energy by installed capacity in India
As the latest trend of electricity generation is concentrated on renewable energy source. At present the installed capacity of renewable energy has touched 32,269.6 MW, as on March 31, 2014. The
Wind Power, 22465.03 MW Small
HydroPower, 3990.83 MW Bagasse Cogeneration,
2800.35 MW Solar Photovoltaic, 3062.68 MW
Biomass Power, 1365.2 MW
International Journal of Modern Trends in Engineering and Research (IJMTER)
Volume 02, Issue 07, [July– 2015] ISSN (Online):2349–9745 ; ISSN (Print):2393-8161
overall renewable energy installed capacity of 41,400 Mw by 2017. So the growing contribution of those resources as on December 2014 is given in figure 1. In this research work the proper use of inverter current control technique is used. This makes the output voltage more accurate to AC.
II. MODELING AND SIMULATION OF PV ARRAY
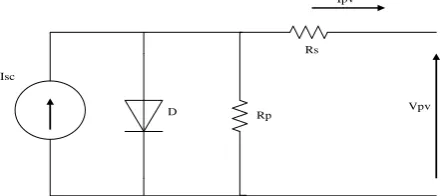
A typical PV cell generates around 1 Volt depending on the type of semiconductor material used and its make technology. To increase this voltage, several cells are connected in series or parallel to form PV module and many such arrays forms an array. The working principle of a PV cell is based on the photovoltaic effect. The circuit diagram is presented in figure 2.
Rp
Rs
D
Isc
Ipv
Vpv
Figure 2. Circuit model for solar cell module
The mathematical equations of SPV system on the basis of which this complete analysis can be done in MATLAB/SIMULINK software. The photocurrent equation is the module photocurrent of the photovoltaic module depends linearly on the solar irradiation and is also influenced by the temperature according to the following equation
Iph = [Isc + Ki * (Tk – Tref)] ∗ λ/1000 (1)
Reverse saturation current equation is given as
Irs = Isc/[exp(qVoc/NskAT)-1] (2)
Module saturation current varies with the variation in cell temperature, which is given as
Io = Irs (T/Tref )^(3) exp[qEg0/Ak*(1/Tref -1/T)] (3)
The basic equation which describes the output current of the PV module of single-diode model is given as
(4)
2.1. PV Array Simulation Analysis
International Journal of Modern Trends in Engineering and Research (IJMTER)
Volume 02, Issue 07, [July– 2015] ISSN (Online):2349–9745 ; ISSN (Print):2393-8161
Figure 3. MATLAB/SIMULINK model for P-V and I-V characteristics
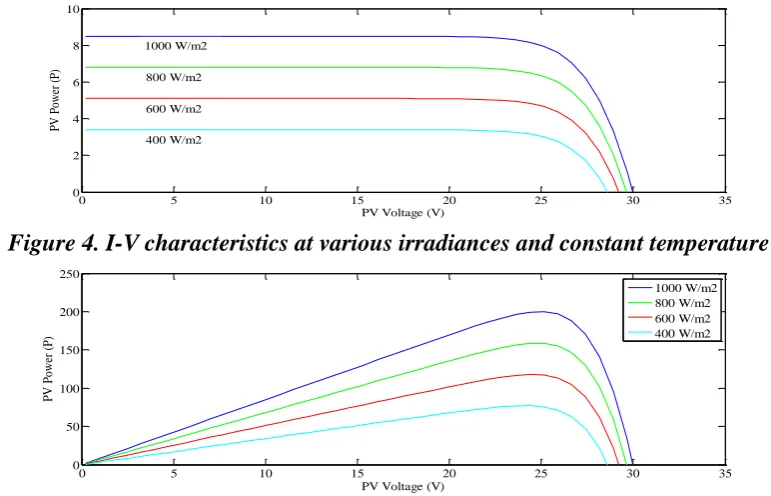
2.1.1. Performance Analysis of PV Array at Different Solar Irradiance
The flux of incident light per unit area considered as irradiance. With the increasing solar irradiance both the open circuit voltage and the short circuit current increases and hence the maximum power point varies. The solar irradiance or insolation is varying continuously, so the characteristics changes continuously. At different locations this data also changes with time.
0 5 10 15 20 25 30 35
0 2 4 6 8 10
PV Voltage (V)
P
V
P
ow
er
(
P
)
400 W/m2 600 W/m2 800 W/m2 1000 W/m2
Figure 4. I-V characteristics at various irradiances and constant temperature
0 5 10 15 20 25 30 35
0 50 100 150 200 250
PV Voltage (V)
P
V
P
ow
er
(
P
)
1000 W/m2 800 W/m2 600 W/m2 400 W/m2
Figure 5. P-V characteristics at various irradiances and constant temperature
2.1.2. Performance analysis of PV array at different temperature
International Journal of Modern Trends in Engineering and Research (IJMTER)
Volume 02, Issue 07, [July– 2015] ISSN (Online):2349–9745 ; ISSN (Print):2393-8161
0 5 10 15 20 25 30 35
0 2 4 6 8 10
PV Voltage (V)
P
V
C
ur
re
nt
(
I)
25 C 35 C 45 C 55 C
Figure 6. I-V characteristics at various temperatures and constant irradiance
0 5 10 15 20 25 30 35
0 50 100 150 200 250
PV Voltage (V)
P
V
P
ow
er
(
P
)
25 C 35 C 45 C 55 C
Figure 7. P-V characteristics at various temperatures and constant irradiance
III. CONTROLLERS FOR PV SYSTEM
The proposed system mainly consists of PV array, DC-DC converter with MPPT control and a single phase inverter along with control algorithm. This proposed system is defined as below-
PV ARRAY DC/DC INVERTER
CONVERTER
MPPT
CONTROL CONTROLLER
LOAD
Figure 8. Block diagram of Single phase PV system
International Journal of Modern Trends in Engineering and Research (IJMTER)
Volume 02, Issue 07, [July– 2015] ISSN (Online):2349–9745 ; ISSN (Print):2393-8161
0 0.05 0.1 0.15 0.2 0.25 0.3 0.35 0.4 0.45 0.5
0 50 100 150 200 250 300 350 400 450
Time
O
ut
put
V
ol
ta
ge
Figure 10. Boost Converter output voltage characteristics
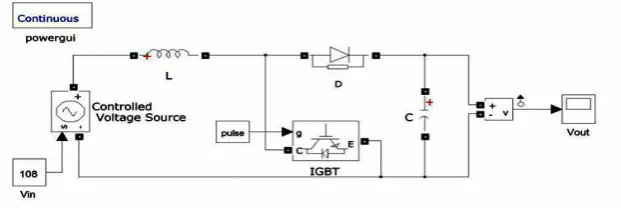
This inverter topology is modeled in simulation software and detailed diagram is shown in figure 11. In this figure LC filter is also attached to filter out the harmonics. This arrangement gives the sinusoidal supply to the load connected.
Figure 11. Simulink model of inverter
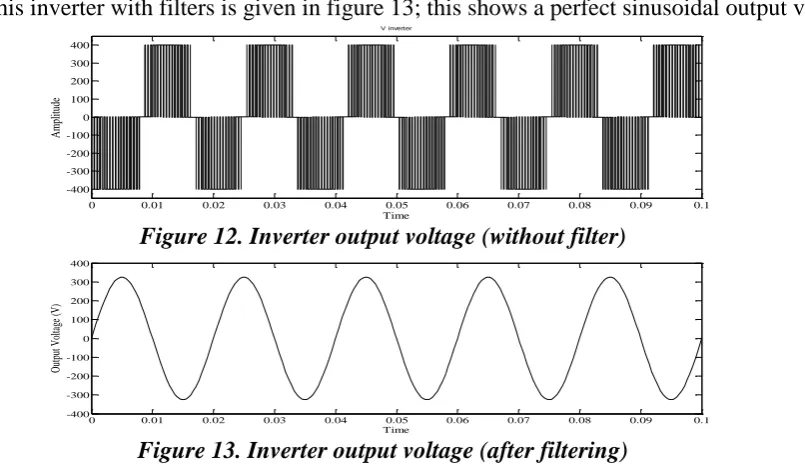
Inverter output voltage is shown in figure 12. This is the voltage signal without applying filter. The output of this inverter with filters is given in figure 13; this shows a perfect sinusoidal output voltage.
0 0.01 0.02 0.03 0.04 0.05 0.06 0.07 0.08 0.09 0.1
-400 -300 -200 -100 0 100 200 300 400
Time
A
m
pl
itude
V inverter
Figure 12. Inverter output voltage (without filter)
0 0.01 0.02 0.03 0.04 0.05 0.06 0.07 0.08 0.09 0.1
-400 -300 -200 -100 0 100 200 300 400
Time
O
ut
put
V
ol
ta
ge
(V
)
Figure 13. Inverter output voltage (after filtering) 3.1. Standalone System
International Journal of Modern Trends in Engineering and Research (IJMTER)
Volume 02, Issue 07, [July– 2015] ISSN (Online):2349–9745 ; ISSN (Print):2393-8161
Discrete, Ts = 3e-06 s.
powergui + -in+ -in inverter 1000 inso v + v -+ -filter v + v -+ -booster v +-25 T Irr Tcell V I solar Solar cell P + Load s - + V I v + i +
Figure 14. Simulation model for single phase standalone system
IV. RESULTS
The complete modeling of solar photovoltaic system cosists different voltage profiles. The PV panel output voltage is the main factor to make the further components to design in that manner, in which the exact correlation meets the desired output from the complete system. The PV voltage is given in Figure 15.
0 0.01 0.02 0.03 0.04 0.05 0.06 0.07 0.08 0.09 0.1
0 50 100 150 200 250 300 Time PV V ol ta ge (V )
Figure 15. Output voltage waveform of PV panel
The current drawing by the load from PV panel is varied in a range, and the PV panel output power is also monitored for the perfect system health. That power graph should be in a well planed shape, which is given in Figure 16.
0 0.01 0.02 0.03 0.04 0.05 0.06 0.07 0.08 0.09 0.1
0 100 200 300 400 500 600 Time Pow er (W ) Uout
Figure 16. Waveform of output power for PV panel
International Journal of Modern Trends in Engineering and Research (IJMTER)
Volume 02, Issue 07, [July– 2015] ISSN (Online):2349–9745 ; ISSN (Print):2393-8161
0 0.01 0.02 0.03 0.04 0.05 0.06 0.07 0.08 0.09 0.1
-8 -6 -4 -2 0 2 4 6 8
Time
Loa
d
C
ur
re
nt
(I
o)
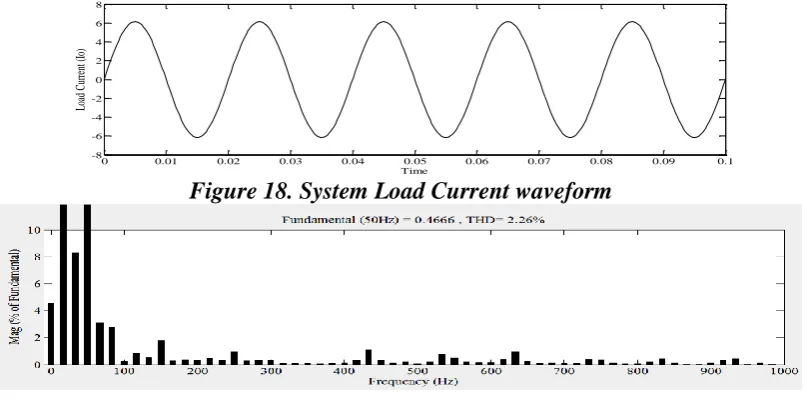
Figure 18. System Load Current waveform
Figure 19. Total harmonic distortion in load current
THD analysis of inverter output current of the developed system has been done and it is found 2.26%, which is in permissible limit.
V. CONCLUSION
The objective of this project is to design, modeling and simulation of standalone PV system. Modeling & simulation of the proposed system has been done using MATLAB/SIMULINK platform. Standalone SPV system consists of solar PV array, DC/DC boost converter with MPPT controller and a single phase H-bridge inverter. P-V and I-V characteristics are obtained for the developed PV array (1000W) with different solar irradiance and temperature conditions. The simulated results for single phase standalone PV system clearly shows the ability of the proposed control schemes to track MPP power from the PV module. The current controller provides robust controlling method for the inverters as well as protects the PV system. The implemented schemes derive the advantage of simplicity and are capable of delivering power effectively.
REFERENCES
[1] Natarajan Pandiarajan, Ramabadran Ramaprabha, and Ranganath Muthu, “Application of Circuit Model for Photovoltaic Energy Conversion System”, International Journal of Photo-energy, 2012.
[2] A.V. Pavan Kumari, Alivelu M. Parimi and K. Vma Rao, “Performance Analysis of a Two Diode model of PV cell for PV based generation in MA TLAB”, IEEE International Conference on Advanced Communication Control and Computing Technologies (lCACCCT), pp. 68-72, 2014.
[3] Cemal Keles, B. Baykant Alagoz, Murat Akcin, Asim Kaygusuz and Abdulkerim Karabiber, “A Photovoltaic System Model for MATLAB/SIMULINK Simulations”, 4th International Conference on Power Engineering,
Energy and Electrical Drives, pp. 1643-1647, 2013.
[4] Narottam Das,Hendy Wongsodihardjo and Syed Islam, “Photovoltaic Cell Modeling for Maximum Power Point Tracking using MATLAB/SIMULINK to Improve the Conversion Efficiency”, IEEE Power and Energy Society General Meeting (PES), pp. 1-5, 2013.
[5] Ali F Murtaza, Hadeed Ahmed Sher, Chiaberge M, Boero D, De Giuseppe M and Khaled E Addoweesh, “A Novel Hybrid MPPT Technique for Solar PV Applications Using Perturb & Observe and Fractional Open Circuit Voltage Techniques”, 15th International symposium MECHATRONICA, pp. 1-8,2012.
[6] R. Chedid, R. Tajeddine, F. Chaaban and R. Ghajar, “Modeling and Simulation of PV Arrays under Varying Conditions”, 17th IEEE Mediterranean Electro-technical Conference, pp. 536-542, 2014.
[7] Jacob James Nedumgatt, Jayakrishnan K. B., Umashankar S., Vijayakumar D. and Kothari D P, “Perturb and Observe MPPT Algorithm for Solar PV Systems-Modeling and Simulation”, annual IEEE India conference (INDICON), pp. 1-6, 2011.
International Journal of Modern Trends in Engineering and Research (IJMTER)
Volume 02, Issue 07, [July– 2015] ISSN (Online):2349–9745 ; ISSN (Print):2393-8161
[9] J. S. Christy Mano Raj and A. Ebenezer Jeyakumar, “A Novel Maximum Power Point Tracking Technique for Photovoltaic Module Based on Power Plane Analysis of I–V Characteristics”, IEEE transactions on industrial
electronics, vol. 61, no. 9, pp. 4734 – 4745, 2014.
[10] Moein Jazayeri, Sener Uysal and Kian Jazayeri, “Evaluation of Maximum Power Point Tracking Techniques in PV Systems using MATLAB/SIMULINK”, Sixth Annual IEEE Green Technologies Conference, pp. 54-60, 2014.
[11] Naoufel Khaldi, Hassan Mahmoudi, Malika Zazi and Youssef Barradi, “The MPPT Control of PV System by Using Neural Networks Based on Newton Raphson Method”, International Conference on Renewable and Sustainable Energy (IRSEC), pp. 19-24, 2014.
[12] Sarina Adhikari and Fangxing Li, “Coordinated V-f and P-Q Control of Solar Photovoltaic Generators With MPPT and Battery Storage in Micro-grids”, IEEE transactions on smart grid, Vol. 5, No. 3, pp. 1270-1281, 2014.
[13] Fei Ding, Peng Li, Bibin Huang, Fei Gao, Chengdi Ding and Chengshan Wang, “Modeling and Simulation of Grid-connected Hybrid Photovoltaic/Battery Distributed Generation System”, China International Conference on Electricity Distribution (CICED), pp. 1-10, 2010.
[14] Tahsina Hossain Loba and Khosru M. Salim, “Design and Implementation of a Micro-Inverter for Single PV Panel based Solar Home System”, International Conference on Informatics, Electronics & Vision (ICIEV), pp. 1-5, 2013.