Munich Personal RePEc Archive
A note on the estimation of
competition-productivity nexus: A panel
quantile approach
Polemis, Michael
University of Piraeus
1 October 2019
1
A note on the estimation of competition-productivity nexus: A panel quantile approach
Michael L. Polemisa,b
a University of Piraeus, Department of Economics, Piraeus, Greece b Hellenic Competition Commission, Greece.
Abstract
We study the impact of product market competition on productivity in 462 US
manufacturing sectors for the period 1958-2009 through the lens of a panel quantile
regression analysis. We confirm that there is a nonmonotonic inverse-U relationship
between competition and total factor productivity. We argue that the turning point increases
substantially as we move to the higher quantiles of the productivity distribution function.
Our findings survive robustness checks under alternative competition measure and quantile
estimator.
Keywords: Quantile regression; Competition; Nonlinearities; Manufacturing; US
2 1. Introduction
The effect of product market competition (PMC) on productivity dates back in the
pioneering work of Sir John Hicks (1935) arguing that “the best of all monopoly profits is
a quiet life”. Since then several theories have brought to light different arguments.
Schumpeter, (1943) claims that there is a positive linear relationship between market power
and productivity appraising the ability of the monopolies to stimulate productivity and
growth, while Arrow (1962) suggests that there is a nonmonotonic convex relationship
between PMC and productivity.
With theory providing mixed results, researchers relied on empirical analysis
(pooled OLS, IV/GMM) to uncover that the effect of competition on productivity and
innovation has an inverse U-shape (Aghion et al, 2005; Van Reenen, 2011; Marshall and
Parra, 2019). These studies apply several techniques which estimate the parameters of
interest at the mean of the conditional distribution of the dependent variable. However, this
is a strong simplification, since explanatory variables may not only affect the mean but
other parameters as well such as the median or other quantiles. Another limitation of the
existing studies is to pool potentially heterogeneous industries/firms as if their data were
generated according to the same process (Distante et al., 2018).
To overcome these problems, we employ the Method of Moments Quantile
Regression (MM-QR) analysis developed in Machado and Silva (2019). By using this
nonparametric approach, we are able to study the effect of competition at different
quantiles of the productivity distribution function, while we also account for the presence
of fixed effects.
The rest of this note proceeds as follows. Section 2 describes the data and the
empirical methodology applied. Section 3 discusses the empirical results along with the
3 2. Data and empirical framework
The sample consists of an annual balanced data set of 462 US manufacturing sectors
broken down at the six-digit NAICS level over the period 1958-2009. All variables are
taken from the National Bureau of Economic Research and the U.S. Census Bureau (see
[image:4.595.56.566.226.452.2]Table 1 for description and statistics).
Table 1: Descriptive statistics
Variables Description Mean Standard
deviation Min Max
TFP Five-factor TFP
(annual growth rate) 0.938 0.257 0.0120 13.15
CR4 Sum of market shares of the four largest firms 28.26 6.378 7.890 98.00
HHI50 Squared sum of market shares of the fifty
largest firms 935.4 233.9 12 9,406
SHIP Total value of shipments
(million USD) 6,291 17,650 3.041 898,019
INV Total capital expenditure
(million USD) 200.4 500.9 0.184 15,555
MAT Total cost of materials
(million USD) 3,252 8,348 10.37 296,857
ENER Electricity and fuels cost
(million USD) 128 394.6 0.149 8,052
The quantile fixed effects approach is given by the following equation:
21 2
4 , ( ) 4 ( ) 4 ( )
( ) ( ), (0,1)
it
TFP j it it j it j it it j
i j t j j
Q CR Z CR a CR Z
(1)
where subscript i = 1, . . ., N represents the industry and t = 1, . . . , T indexes the
time. TFPit is the growth rate of total factor productivity, CR4it denotes the market
concentration. Zdenotes the vector of covariates, including market size (SHIP), capital
(INV), intermediate inputs (MAT) and energy cost (ENER) expressed in real terms, while
φi and μt are unobserved industry and year fixed effects to address potential endogeneity
(Baryshnikova and Pham, 2019). We use TFP as a proxy for productivity since it is the
most important driver of economic growth (Prescott, 1998; Mastromarco and Simar, 2018).
The reason for employing MM-QR analysis is twofold. First, although it is being
4
Chernozhukov and Hansen, 2008), it is computationally much simpler (Machado and Silva,
2019). Second, it allows for fixed effects as in this case.
We notice though that we have a large N = 462 and small T = 52, which results in
too many dummies and renders the MM-QR inconsistent. To deal with this problem, we
use the simple split-panel jackknife bias correction described in Dhaene and Jochmans
(2015).1 Moreover, we supplement our analysis with the panel quantile estimator proposed
by Canay (2011).
A possible threat to identification strategy is that our basic variable (CR4) could be
endogenous due to reverse causality since the level of productivity in an industry could
determine its market structure and the subsequent level of competition according to
Structure-Conduct-Performance paradigm (Bain, 1956). Similarly to other studies
(Polemis and Stengos, 2015; Altunbaş and Thornton, 2019), we address possible
endogeneity by using lagged values of the competition variable.
3. Results and discussion
3.1. Main findings
Table 2 displays the estimated parameters in the location and scale functions drawn
from the OLS model (see column 1) and the regression estimates obtained with the
MM-QR model (see columns 2-6).
It is shown that CR4 has effects with opposite signs on the location and scale
suggesting that increasing the level of concentration increases the average productivity
(location shift), but also decreases the dispersion of observed productivity (scale shift). The
rest of the covariates when significant are properly signed.
1 As argued in Machado and Silva, (2019), the confidence intervals obtained by MM-QR have poor coverage
5 Table 2:OLS and quantile regression results
(1) OLS Mean
(2)
Q(0.10) Q(0.25) (3) Q(0.50) (4) Q(0.75) (5) Q(0.90) (6)
Variables Location Scale
Competition 0.0456***
(0.00423) -0.00267 (0.0026) 0.0481
***
[0.00503] 0.0464
***
[0.0035] 0.0447
***
[0.003] 0.0429
***
[0.004] 0.0412
***
[0.005]
Competition (squared) 0.00036***
(0.000082) 0.000072
*
(0.000047) -0.000459
***
[0.00008] -0.000406
***
[0.00006] -0.00036
***
[0.00004] -0.000295
***
[0.00006] -0.000242
*** (0.00009]
Market size 0.000012***
(0.0000019) 0.0000013
***
(0.00000019) 0.0000104
***
[0.0000019] 0.0000113
***
[0.0000013] 0.000012
***
[0.000001] 0.000013
***
(0.0000014] 0.000014
*** (0.000002]
Intermediate inputs -0.000011***
(0.0000024) -0.0000016
*
(0.0000009) -0.000008
***
[0.0000031] -0.000009
***
[0.000002] -0.000011
***
[0.000001] -0.000012
***
[0.000003] -0.000012
*** [0.000003]
Energy cost -0.000037
(0.000024) (0.0000064) -0.0000064 [0.000028] 0.0000022 -0.000015 [0.00002] -0.000033
**
[0.000016] -0.00005
**
[0.00002] -0.000068
** [0.00003]
Capital -0.000049*
(0.00003) 0.000019
***
(0.0000073) -0.000079
*
[0.000043] -0.000066
**
[0.00003] -0.000052
**
[0.00003] -0.000037 [0.00003] [0.00004]-0.000024
Observations 24,023 24,023 24,023 24,023 24,023 24,023 24,023
Industry FE Yes Yes Yes Yes Yes Yes Yes
Year FE Yes Yes No No No No No
Turning point (CR4) 63 52 57 63 73 85
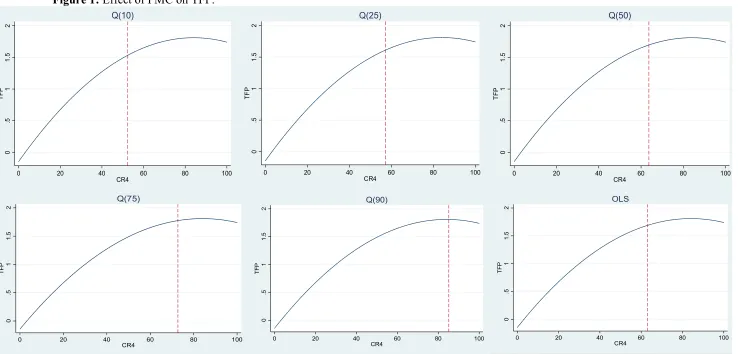
6 Figure 1: Effect of PMC on TFP.
Notes: The dotted dashed line indicates the turning point.
0 .5 1 1. 5 2 TF P
0 20 40 60 80 100
CR4 Q(25) 0 .5 1 1. 5 2 TF P
0 20 40 60 80 100
CR4 Q(10) 0 .5 1 1. 5 2 TF P
0 20 40 60 80 100
CR4 Q(50) 0 .5 1 1. 5 2 TF P
0 20 40 60 80 100
CR4 Q(75) 0 .5 1 1. 5 2 TF P
0 20 40 60 80 100
CR4 Q(90) 0 .5 1 1. 5 2 TF P
0 20 40 60 80 100
CR4
7
Concerning the quantile results, we observe that in all of the specifications the
linear term is positive (aˆ1 0), while the quadratic term (aˆ2 0) is always negative
indicating an inverse U-shaped curve. We notice though that the magnitude of the linear
estimate is essentially the same across the five quantilies. However, the turning point
varies in its magnitude across the conditional distribution function (CDF), reaching its
peak (CR4 = 95) at the 90th quantile (see Figure 1).
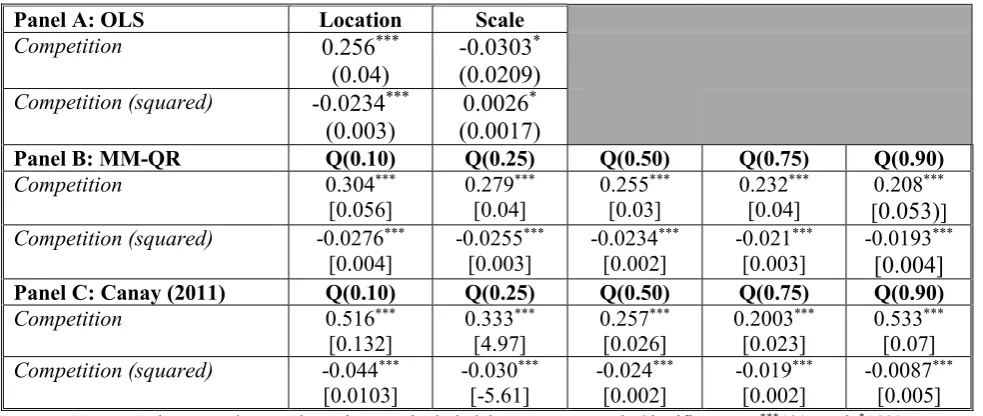
3.2. Robustness cheeks
To check for robustness, we re-estimate the MM-QR model by using an
alternative measure of PMC namely the Hirschman-Herfindahl index of the 50 largest
firms in the industry (HHI50).2 The latter, is widely used in the literature as a proxy for
competition (see for example Dai et al, 2014; Polemis and Tzeremes, 2019). We also
apply the panel quantile regression estimator obtained by Canay (2011).
Indeed, the results obtained with the Canay and MM-QR estimators (see Table
3; Panel B and C) suggest that an increase in competition is associated with greater
productivity in concentrated industries (HHI is high) but with less productivity in
competitive markets (HHI is low), justifying an inverse-U relationship across the CDF.3
We observe though, that the magnitude of Canay estimates differs substantially across
the quantiles (especially at the extreme ones) compared to MM-QR estimates, which
seem to be relatively stable.
2 The relevant indicator is calculated as: 50 2
1
50 it 10, 000
i
HHI s
where s denotes the market shareof each firm in industry i at time t.
8 Table 3:Robustness checks results
Panel A: OLS Location Scale
Competition 0.256***
(0.04) -0.0303
*
(0.0209)
Competition (squared) -0.0234***
(0.003) 0.0026
*
(0.0017)
Panel Β: ΜΜ-QR Q(0.10) Q(0.25) Q(0.50) Q(0.75) Q(0.90)
Competition 0.304***
[0.056] 0.279
***
[0.04] 0.255
***
[0.03] 0.232
***
[0.04] 0.208
***
[0.053)]
Competition (squared) -0.0276***
[0.004] -0.0255
***
[0.003] -0.0234
***
[0.002] -0.021
***
[0.003] -0.0193
*** [0.004]
Panel C: Canay (2011) Q(0.10) Q(0.25) Q(0.50) Q(0.75) Q(0.90)
Competition 0.516***
[0.132] 0.333
***
[4.97] 0.257
***
[0.026] 0.2003
***
[0.023] 0.533
***
[0.07]
Competition (squared) -0.044***
[0.0103] -0.030
***
[-5.61] -0.024
***
[0.002] -0.019
***
[0.002] -0.0087
***
[0.005]
Notes: Industry and year dummies are included but not reported. Significant at ***1%, and *10%
respectively.
4. Conclusion
This note studies the impact of PMC on productivity growth in 462 US
manufacturing sectors for the period 1958-2009 using panel quantile regression. The
empirical findings justify a “hump-shaped” nonlinear effect of competition on
productivity lending support to Aghion et al., (2005). On one hand, competition may
stimulate the incremental profit from innovating (“escape-competition effect”), while
on the other hand, it may diminish innovative activity for smaller firms
(“Schumpeterian effect”). The turning point increases substantially for higher quantiles
of the productivity distribution function. The findings survive robustness checks under
alternative competition measure and quantile estimator. Future studies could use our
results to shed light on the impact of competition on consumer welfare.
Acknowledgements
I would like to thank Professor Santos Silva for his constructive comments along with
9 References
Aghion, P., Bloom, N., Blundell, R., Griffith, R., Howitt, P., 2005. Competition and
innovation: An inverted-U relationship. Quarterly Journal of Economics. 120, 701–
728.
Altunbaş, Y., and Thornton, J. (2019). The impact of financial development on income
inequality: A quantile regression approach, Economics Letters, 175: 51-56.
Arrow, K. J., (1962). Economic Welfare and the Allocation of Resources for Invention,
in Nelson, R. R. (ed), The Rate and Direction of Inventive Activity, 609–625. Princeton
University Press, Princeton, New Jersey, U.S.A.
Bain, J.S. (1956) Barriers to New Competition: Their Character and Consequences in
Manufacturing Industries. Cambridge: Harvard University Press.
Baryshnikova, N.V., and Pham, N. (2019). Natural disasters and mental health: A
quantile approach, Economics Letters, 180: 62-66.
Canay, I.A., (2011). A simple approach to quantile regression for panel data.
Econometrics Journal 14: 368–386.
Chen, C., Polemis, M.L. and Stengos, T. (2018). On the examination of non-linear
relationship between market structure and performance in the US manufacturing
industry, Economics Letters, 164(C): 1-4.
Chernozhukov, V., and Hansen, C., (2008). Instrumental variable quantile regression:
a robust inference approach. Journal of Econometrics 142: 379–398.
Dai, M., Liu, Q., Serfes, K., 2014. Is the effect of competition on price dispersion
nonmonotonic? Evidence from the U.S. airline industry. Review of Economics and
Statistics. 96 (1): 161–170.
Dhaene, G., and Jochmans, K., (2015). Split-panel jackknife estimation of fixed-effect
10
Distante, R., Petrella, I., and Santoro E. (2018), Gibrat’s law and quantile regressions:
An application to firm growth, Economics Letters, 164: 5-9.
Hicks, J. R., (1935). Annual Survey of Economic Theory: The Theory of Monopoly,
Econometrica 3: 1-20.
Machado, J.A.F., and Silva, S. (2019). Quantiles via moments, Journal of
Econometrics, 213 (1): 145-173.
Marshall, G., and Parra, A (2019). Innovation and competition: The role of the product
market, International Journal of Industrial Organization, 65: 221-247.
Mastromarco, C., and Simar, L. (2018). Globalization and productivity: A robust
nonparametric world frontier analysis, Economic Modelling, 69: 134-149.
Polemis, M.L. and Tzeremes, N (2019). Competitive conditions and sectors’ productive
efficiency: A conditional non-parametric frontier analysis, European Journal of
Operational Research, 276(3): 1104-1118.
Polemis, M.L., and Stengos, T. (2015). Does market structure affect labour productivity
and wages? Evidence from a smooth coefficient semiparametric panel model,
Economics Letters, 137(C): 182-186.
Prescott, E., (1998). Needed: a theory of total factor productivity. International
Economic Review, 39: 525–551.
Schumpeter J., (1943). Capitalism, Socialism and Democracy, London: Allen Urwin.
Van Reenen, J., (2011). Does Competition Raise Productivity through Improving
Management Quality? International Journal of Industrial Organization, 29(3): 306–