Selecting the Best Index for Following the
Temporal Evolution of Apparent
Diffusion Coefficient and Diffusion Anisotropy
After Hypoxic-Ischemic White
Matter Injury in Neonates
Carola van Pul, Jan Buijs, Maurice J. A. Janssen, George F. Roos, Marinus T. Vlaardingerbroek, and Pieter F. F. Wijn
BACKGROUND AND PURPOSE:Diffusion-weighted (DW) MR imaging is a useful technique for detecting ischemia. In adults and neonates, however, temporal changes on DW images after ischemia complicate interpretation. Our purpose was to investigate the temporal evolution of the apparent diffusion coefficient (ADC), diffusion-tensor (DT) imaging components, and anisotropy in neonatal brain after hypoxic-ischemic white matter injury and to determine which anisotropy index is preferable.
METHODS:DT images were obtained with single-shot echo-planar imaging, by using pulsed field gradients in six directions. Sixteen volunteers and 10 term neonates with normal MR images were evaluated to obtain reference values. Among the anisotropy indexes of fractional anisotropy (FA), relative anisotropy (RA), volume ratio (VR), linear (CI) and planar (Cp) diffusion, and axial anisotropy (Am), simulations were performed to select the most appropriate indexes for clinical practice. The ADC, DT imaging components, and anisotropy were evaluated as a function of time after onset of symptoms in 11 neonates with hypoxic ischemia.
RESULTS: In neonates, changes in lesions were characterized by a large decrease (40%) in all eigenvalues, with a stronger decrease in the direction perpendicular to the fibers, resulting in increased anisotropy indexes. The temporal evolution of the relative change in ADC did not show a significant trend (P> .05). The relative change in anisotropy decreased linearly with time (P< .05), with the strongest trend in anisotropy index Am.
CONCLUSION:In clinical practice, anisotropy indexes FA, RA and Amappear to be useful. Am is the best index to monitor anisotropy changes. DT imaging provides information about diffusion parallel and perpendicular to white matter fibers, which helps the interpretation of physiologic changes after hypoxic-ischemic injury.
Pathophysiologic changes due to perinatal hypoxic ischemia can result in structural and functional dam-age to the brain of the neonate, and detecting these
changes in an early stage is important. Diffusion-weighted (DW) imaging has been applied successfully in the detection of ischemic injury; the apparent dif-fusion coefficient (ADC) decreases in ischemic areas to about 40 –50% of its original value. This effect was first seen in animal studies (1) and later in human stroke studies (2) and in children with ischemic white matter injury as well (3– 8). The decrease in ADC to about 50% of its original value occurs 3– 6 hours before changes in T2 and T1 are visible and might reflect tissue at risk for damage (9, 10). The DW imaging technique and its quantitative ADC map are considered to be important tools for diagnosis of ischemia (9, 10).
Diffusion tensor (DT) imaging is an extension of DW imaging and measures diffusion in six or more
Received February 9, 2004; accepted after revision June 14. From the Department of Applied Physics, Eindhoven University of Technology, Eindhoven, The Netherlands (C.v.P., M.J.A.J., M.T.V., P.F.F.W.); the Departments of Neonatology (J.B.), Radi-ology (G.F.R.), and Clinical Physics (C.v.P., P.F.F.W.), Maxima Medical Center, Location Veldhoven, The Netherlands; and the Department of Biomedical Engineering ORL, University Hospital Maastricht, The Netherlands (M.J.A.J.).
Address correspondence to Carola van Pul, PhD, Ma´xima Med-ical Center, Veldhoven, Department of ClinMed-ical Physics, P.O. Box 7777, 5500 MB Veldhoven; e-mail: [email protected]
©American Society of Neuroradiology
directions to obtain information about the tissue structure, as the main direction of diffusion in white matter is assumed to coincide with the direction of the fiber bundle of axons (11, 12). The DT imaging information can be used to determine the main direc-tion of diffusion by calculadirec-tion of the eigenvalues and eigenvectors of the DT, and it can be visualized by using various visualization techniques, usually based on anisotropy indexes. Various anisotropy indexes exist to describe the ratio between the eigenvalues of the DT (11–14).
Compared with adult white matter, neonatal white matter is less structured and contains more water. This is reflected by a 30 –50% higher ADC in neo-nates than in adults and by a 40 – 60% lower anisot-ropy. Both values depend on the gestational age (15– 18). Anisotropy measurements are promising for the early detection of impaired brain development in ne-onates (17, 19).
The temporal evolution of the effect of ischemic changes on the ADC is quite well known from animal studies, as reviewed by Hoehn et al (20), but anisot-ropy changes have not often been taken into consid-eration. A limited number of studies have investi-gated the temporal evolution of anisotropy after ischemia in animal studies and in humans (21–23). The characterization of the temporal evolution is im-portant to improve interpretation and diagnosis.
The first studies in neonates show that the time evolution of the ADC follows more closely the pat-tern of adult stroke than that of rodents (6, 8). How-ever, to our knowledge, no data on the temporal evolution of anisotropy changes after neonatal brain injury are available yet. We hypothesized that differ-ences in the temporal evolution of anisotropy be-tween adults and neonates might occur due to the differences in brain development, myelination state, and pattern of injury.
Although many different kinds of anisotropy in-dexes exist, it remains unclear which index is most sensitive to detect changes in anisotropy in the neo-natal brain. Among other characteristics, the anisot-ropy index in the neonatal brain should be sensitive to relevant changes in tissue structure, but insensitive to noise effects (24).
The purposes of this study were to investigate the temporal evolution of the ADC, the three eigenvalues of the DT, and the anisotropy in the neonatal brain after focal hypoxic-ischemic white matter injury and to evaluate which anisotropy index is preferable for the characterization of ischemic lesions in the neo-nate. In the process of selecting an appropriate an-isotropy index, a study in adult volunteers and in neonates with normal MR images was performed to compare several well-known anisotropy indexes, and simulations were used to investigate the reliability and the sensitivity to noise of these indexes. Finally, the usefulness of the three most promising indexes for the detection of ischemic lesions in the neonatal brain was evaluated.
Methods
MR Imaging Protocol
A 1T whole-body system (Gyroscan; Philips Medical Sys-tems, Best, the Netherlands) was used, with a gradient system that can reach a maximum gradient strength of 21 mT/m in each main direction. Besides the DT imaging series discussed below, the imaging protocol consisted of a spin-echo T1-weighted series (568/18 TR/TE), a turbo spin-echo T2-weighted series (4381/120), and an inversion-recovery series (3436/18/400 TR/TE/IR). The neonatal patients were sedated with chloralhydrate (50 mg/kg 1 hour before MR imaging and again 50 mg/kg 1/2 hour before MR imaging) and fixated by using a vacuum pillow. For all brain imaging, the standard birdcage head coil was used.
DT images were obtained by using pulsed field gradients in six directions with single-shot echo-planar imaging. Eighteen sections were recorded within 2 minutes (3595/94 TR/TE). The voxel size was 1.2⫻1.2⫻4 mm. The sensitivity to diffusion is expressed by the b value, as introduced by Stejskal and Tanner (25), which depends on the gradient strength G, gradient lobe duration␦, and time between the onsets of the gradient lobes
⌬. Three b values (0, 400, and 800 s/mm2) were used to
calcu-late the ADC, with␦⫽20.06 ms,⌬ ⫽40.5 ms, and G⫽19.6 mT/m for b⫽400 s/mm2and G⫽27.8 mT/m (by combining x,
y, and z gradients) for b⫽800 s/mm2. We chose to use lower
b values than those used in the adult brain (typically 1000 s/mm2), because the ADC in neonatal white matter is higher
than that in adults. The optimal b value was calculated as indicated by Jones et al (26).
Adult Volunteer Group
The volunteer group consisted of 16 healthy adult volunteers (eight men and eight women) between the ages of 18 and 47 years. All volunteers gave written informed consent for MR imaging measurements. The voxel size in the adult brain was 1.8⫻1.8⫻5 mm.
Neonatal Patient Group
The study group was recruited from a group of asphyxiated neonates born at term age with perinatal hypoxic-ischemic encephalopathy (HIE), who were treated in our neonatal in-tensive care unit (level 3). Perinatal hypoxic ischemia was diagnosed when clinical symptoms of neonatal encephalopathy were present in the first days of life together with two or more of the following risk factors: fetal heart rate abnormalities, umbilical artery pH less than 7.10, meconium stained fluid, APGAR score after 5 minutes of less than 7 (27). Included in our study group were neonates with focal white matter injury due to perinatal hypoxic ischemia. Excluded from evaluation were infants with congenital abnormalities, neurometabolic disease, or perinatal infection.
In total, 22 term neonates with HIE underwent DT imaging between July 2002 and November 2003 as part of a normal clinical examination. Parental informed consent was always obtained before the MR imaging. The data were evaluated retrospectively by two of the authors (J.B., G.F.R.).
Eleven neonates had focal white matter injury (one neonate was imaged at two different time points). All 11 included neonates born after an uneventful pregnancy; the onset of symptoms could be timed to the day of birth. The neonates had an average gestational age of 39.5 ⫾ 1.6 weeks and were imaged within 10 days after birth. The white matter injury could be subdivided into an arterial infarct related to the asphyxia (n⫽5), a typical pattern of asymmetrical multifocal lesions in the white matter as described by Volpe (28) (n⫽4), or parasagittal infarcts, bilateral (n⫽2).
(J.B., G.F.R.) to determine the extent of the injury. Neurode-velopmental examination was performed at 1 year (n⫽7), at 6 months (n ⫽ 2), and at 3 months (n ⫽ 2). Infants with a follow-up at 3 months were included in the study only if a follow-up MR study at 3 months was available.
As we did not have a control group of healthy neonates, we obtained reference values from 10 full-term neonates who had clinical symptoms of asphyxia with Sarnat 1–2 in eight neo-nates, perinatal infection in one neonate, and persistent pul-monary hypertension in one neonate. All neonates had normal MR images (n⫽7) or an MR image with only minor abnor-mality in the basal ganglia (n⫽1), in the cerebellum (n⫽1), or in occipital white matter (n⫽1). Brain development and myelination in the frontal white matter was assessed to be normal by two of the authors (J.B., G.F.R.), based on T1- and T2-weighted images, and it was verified that no abnormality was visible on the DW images. All infants were developmen-tally normal at very short-term follow-up (2–3 months). Neu-rodevelopmental examinations were performed in seven of the 10 children, at the age of 1 year (n⫽3), 6 months (n⫽2), and 3– 4 months (n⫽2). These children were all mentally normal. For three children who were neurodevelop-mentally normal at short term, long-term follow-up was not available.
The control group (n⫽10) consisted of neonates born at term age (average gestational age, 39.3⫾1.8 weeks).
Postprocessing, Image Analysis, and Statistics
ADC maps were calculated with the imager software. De-tailed analysis of the DW imaging and ADC data and calcula-tion of the eigenvalues, eigenvectors, and anisotropy indexes were performed by using Mathematica 4.2 (Wolfram Research, Inc., Urbana, IL). The three eigenvalues are called1,2, and
3, from largest value to smallest value, respectively. The ADC
parallel to the structure is reflected by1, and the ADC
per-pendicular by the average of2and3(11).
Normal ADC and anisotropy values in volunteers and neo-nates with a normal MR imaging study were evaluated in the corpus callosum and white matter (Fig 1). The corpus callosum was chosen because this is structure contains compact white matter, which has already completed a greater percentage of myelination compared with frontal lobe white matter, a non-compact white matter structure (29). The neonatal values were
compared with the adult values by calculating the difference between both values divided by the adult value.
In neonates with white matter lesions, the largest lesion was selected, if reliable ADC and anisotropy calculation was pos-sible and without artifacts in the region of the lesion. The region of interest was drawn manually around the lesion, fol-lowing the boundary of the lesion but including only white matter, and had the same volume in the contralateral measure-ment. Most of the neonates in our study group had asymmetric lesions (n ⫽9), making contralateral measurements possible. The contralateral tissue was assessed to be normal, based on T1- and T2-weighted images. In two children, the injury was bilateral and in this case, the ‘contralateral’ measurement was obtained from normal-appearing white matter in a nearby re-gion. The region of interest was used for ADC and anisotropy calculations.
The relative change in the lesion compared with the con-tralateral tissue, contra, was determined by the following equation:
Change⫽100[(Valuelesion⫺Valuecontra)/Valuecontra].
The two control groups (adult volunteers and full-term neo-nates with normal MR images) were compared by using the Studenttdistribution to evaluate the hypothesis that the means of the two populations are equal.
The data points of the temporal evolution in the neonatal patient group with white matter injury were fitted by using a least squares fitting algorithm, and Pearson correlation coeffi-cient was calculated by using Mathematica (Wolfram Research, Inc.). To determine whether a trend was significant, a Student
t test was used (30). A test result with P less than .05 was considered to indicate a statistically significant difference.
Anisotropy Indexes
In the volunteer study, various anisotropy indexes were in-vestigated (Table 1). The equations for all indexes are scaled to make isotropic diffusion 0 and anisotropic diffusion 1. Frac-tional anisotropy (FA) measures the fraction of the magnitude of the diffusion tensor that can be ascribed to anisotropic diffusion (11). Relative anisotropy (RA) is the normalized standard deviation (11). Volume ratio (VR) is the ratio of the ellipsoid volume to the volume of a sphere with radius ⫽ (1⫹2⫹3)/3 (14). In the linear and planar diffusion cases
(Cland Cp), as the names suggest, the index is high in regions where diffusion is linear or planar, respectively (31). Linear diffusion (CI) means that the diffusion ellipsoid is cigar-shaped; in this case the diffusion along the white matter fiber structure is much larger than that perpendicular to the fibers. Planar diffusion (Cp) means that the diffusion ellipsoid is pancake-shaped, which can occur in areas where fibers are crossing. Axial anisotropy (Am[also called Amajor]) is similar to
Cl, but also takes3into account (32). The concept of intra-voxel indexes can be extended to interintra-voxel indexes, based on eigenvectors and eigenvalues of the reference voxel and adja-cent voxels, for which lattice indexes are used, as introduced by Pierpaoli and Basser (13). However, due to the relatively low imaging matrix that we use (128 ⫻128), the lattice indexes suffer from partial volume effects. As the lattice indexes did not give reliable additional information in our clinical situation, their characteristics were not investigated further.
Visualization of Index Characteristics and Simulations Eigenvalue Space Plots.The intrinsic characteristics of each anisotropy index can be visualized by using normalized eigen-value space plots, as introduced by Bahn (33). This method of visualization gives insight into the sensitivity of the investigated anisotropy index to linear (prolate or cigar-shaped) and planar (oblate or pancake-shaped) diffusion. For each index, this method was used to determine whether linear and planar FIG 1. Definition of the regions of interest in the adult brain.1
diffusion could be distinguished from each other. More details on the eigenvalue space can be found in Bahn (33). The value of the anisotropy index under investigation was calculated as a function of3/1and2/1and displayed in corresponding gray
level (Fig 2), as it is used in anisotropy maps. The combination of both a small2and3with respect to1resembles a more
prolate (cigar)-shaped diffusion ellipsoid, whereas the combi-nation of a relatively small3with a2and1in the same range
means that the diffusion is more oblate (pancake) shaped.
Noise Simulations.Because anisotropy values are known to be lower in the neonatal brain owing to the lower degree of myelination (18), it is important to know the noise sensitivity of each index. Numerical simulations were performed to estimate the accuracy of the diffusion scheme and postprocessing pro-cedure, by using a similar method as introduced by Basser and Pajevic (34).
For several sets of eigenvalue and eigenvector distributions and two noise levels, the DT was calculated. The six ADC components (because of six pulsed field gradient directions) were determined. Gaussian-distributed noise was added to
these ADC components, and next the noise-affected compo-nents of the tensor were calculated. They are the basis of the noise-affected anisotropy indexes. All calculations were per-formed in Mathematica (Wolfram Research, Inc.), and to ob-tain precise estimates of values derived from the calculated DT, the calculations were repeated 10,000 times.
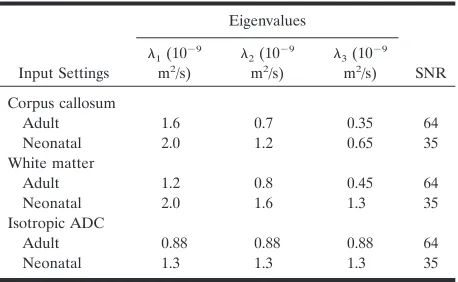
The input eigenvalues shown in Table 2 are in the same range as the values that we found for white matter and corpus callosum in both neonatal and adult brain. Also, an isotropic case was simulated. The noise levels used were derived from water phantom measurements on our 1T system. The average signal-to-noise ratio (SNR) in the ADC maps of 18 measure-ments by using the adult protocol was 64 and by using the neonatal protocol it was 35.
Sensitivity to Changes
In clinical practice, the changes in a parameter are usually expressed as the relative change with respect to the contralat-eral tissue; for example, the ADC after ischemia is decreased with about 50%. However, the sensitivity of these relative changes in each anisotropy index to changes in the eigenvalues is unknown. We visualized the relative change in the index (defined by the Change equation) as a function of a change in one of the eigenvalues (‘factor’ times the eigenvalue). In this way, it can be visualized that some indexes are more sensitive to changes than others. Three input eigenvalue sets were used: the settings for adult and neonatal white matter, as defined in Table 2, and a nearly isotropic situation, arbitrarily chosen with 1⫽1.6 10⫺9m2/s,2⫽1.5 10⫺9m2/s, and3⫽1.4 10⫺9m2/s.
FIG 2. Eigenvalue space plots as defined by Bahn (33), plotted for anisotropy index FA. FA is high (bright) for both3/1and
2/1close to zero, which corresponds to a cigar-shaped
diffu-sion ellipse. But FA is still relatively large for2/1close to 1, the
[image:4.585.53.533.70.254.2]pancake-shaped diffusion ellipse.
TABLE 1: Equations for the anisotropy indexes evaluated in this study and the authors who introduced them
Index
Introducing Authors
(reference no.) Equation
FA Basser and Pierpaoli (12) 1 2冑2
冑
共1⫺2兲2⫹共2⫺3兲2⫹共3⫺1兲2 12⫹22⫹32
RA Basser and Pierpaoli (12) 1 2冑2
冑
共1⫺2兲2⫹共2⫺3兲2⫹共3⫺1兲2 共1⫹2⫹3兲2
VR Le Bihan et al (14) 1⫺27共1•2•3 1⫹2⫹3兲3
Cl Peled et al (31) 1⫺2
1⫹2⫹3
Cp Peled et al (31) 2共2⫺3兲 1⫹2⫹3
Am Conturo et al (32)
1⫺共2⫹3兲/2 1⫹2⫹3
[image:4.585.54.282.280.478.2]Note.—All indexes are scaled to make isotropic diffusion 0 and anisotropic diffusion 1.1is the largest eigenvalue,3the smallest.
TABLE 2: Input eigenvalues for noise simulations
Input Settings
Eigenvalues
SNR 1(10⫺
9
m2/s)
2(10⫺ 9
m2/s)
3(10⫺ 9
m2/s)
Corpus callosum
Adult 1.6 0.7 0.35 64 Neonatal 2.0 1.2 0.65 35 White matter
Adult 1.2 0.8 0.45 64 Neonatal 2.0 1.6 1.3 35 Isotropic ADC
[image:4.585.306.535.291.432.2]It is not possible to investigate an isotropic situation in this way, because a change in anisotropy would result in a division by zero.
Choice of Three Anisotropy Indexes
The three most promising anisotropy indexes to use in our clinical study were to be selected from the six indexes (Table 1) according to the following criteria: in our opinion, an anisot-ropy index should meet the requirements of 1) being sensitive to relevant changes in tissue structure, 2) showing good con-trast between isotropic tissue (e.g., gray matter) and anisotro-pic tissue (e.g., white matter), 3) being distinguishable from noise, and 4) having a low interpatient variability relative to the average value.
Results
Volunteers and Neonates with Normal MR Images
Volunteers.The average ADC, eigenvalues (1,2, 3), and six anisotropy values in 16 volunteers are
shown in Figure 3A and B, for corpus callosum and white matter. The difference between tissue in corpus callosum and frontal white matter can be clearly seen. The ADC parallel (1) was larger in the corpus
cal-losum (1.63 ⫾ 0.11 10⫺9 m2/s) than in the white matter (1.20⫾0.06 10⫺9m2/s), whereas for the ADC
perpendicular, (2⫹3)/2, no significant differences
between corpus callosum and white matter were seen (0.52⫾0.07 and 0.61⫾0.06 10⫺9m2/s, respectively). For most anisotropy indexes, the difference between corpus callosum and white matter was about 30%, although for the planar case (Cp), the index was the
same for corpus callosum and white matter, which means that the planar component of the diffusion was the same in both regions. The error bars in Figure 3 show the standard deviation (variability) between subjects. The intervolunteer variability with respect to the average value was smallest for FA (10%) and largest for VR (22%).
Neonates. In Figure 3C and D, the average values
for neonates with normal MR images are shown. The average ADC in neonatal corpus callosum was 1.25⫾ 0.13 10⫺9 m2/s and 40% larger than that in adult
corpus callosum. The ADC in neonatal white matter was 1.58⫾0.19 10⫺9m2/s and 94% larger than that in
adult white matter. The ADC parallel was about the same for corpus callosum and white matter (1.85 ⫾ 0.24 and 1.94⫾0.22 10⫺9m2/s, respectively) and 14% and 61% larger than that in adult corpus callosum and white matter, respectively. The ADC perpendic-ular was smaller in corpus callosum than in white matter (0.95 ⫾0.12 and 1.39⫾ 0.18 10⫺9m2/s) and 83% and 127% higher than that in adult white matter and corpus callosum, respectively.
The anisotropy in the corpus callosum was about 32– 48% lower than that in adults for all indexes, except Cp (1%), whereas in the white matter, the anisotropy was about 47–53% lower for all indexes, except VR (70%).
As for the anisotropy indexes, the average value for FA was relatively large compared with other indexes and showed the smallest interpatient variability (15% in corpus callosum and white matter). Indexes with the highest interpatient variability were VR (up to 40% in white matter), Cl (27% in corpus callosum), and Cp(27% in corpus callosum).
Visualization of Index Characteristics and Simulations
Eigenvalue Space Plots.One of the characteristics of
an anisotropy index should be that the contrast be-tween isotropic and anisotropic diffusion is large, as the main interest is the fiber structure in the white matter. The contrast is high if the index is sensitive to linear (cigar-shaped) diffusion. This can be visualized qualitatively by using the normalized eigenvalue space, as introduced by Bahn (33). The eigenvalue space is shown in Figure 4 for FA, RA, and Am. In the
eigenvalue space plots, differences between FA and RA with respect to the sensitivity to the shape of the diffusion ellipse were small: the gray-scale patterns in the eigenvalue space were almost similar. Clear dif-ferences between the patterns of FA and Am were
visible. The anisotropy index Amwas high for prolate
(linear) diffusion and low for oblate (planar) or iso-tropic diffusion, whereas FA and RA were already
relatively high for oblate diffusion as well. This means that these indexes had a relatively high value in areas where fibers might be crossing.
The anisotropy maps for FA, RA, and Am in a
neonatal patient with hypoxic-ischemic lesions are shown in Figure 4, together with their corresponding T2-weighted, IR-weighted, and ADC image. The largest lesion in the white matter, as indicated by the arrow, was evaluated in the patient study. The regions where only linear diffusion occurs can be best seen on the Amanisotropy map (Fig 4). On FA and RA maps (Fig 4), values with oblate (planar) diffusion also had brighter signal intensity.
Noise SimulationsIt is important to distinguish true anisot-ropy from noise artifacts. Special attention to noise sensitivity was necessary, because we used a 1.0-T system, resulting in a relatively low SNR. The influence of noise on the anisotropy measurements was investigated by using simulations, with input values as discussed in Table 2. The results of the simulations are shown in Figure 5, for input values comparable to adult values (Fig 3) in Figure 5A and B and for input values com-parable to neonatal values (and lower SNR) in Figure 5C and D. The error bars show the standard deviation of the 10,000 simulations. For the anisotropic case, no significant differences between the input value and the simulated values were ob-served, both for the adult case with high SNR and the neonatal case with lower SNR.
For the isotropic case, however, the highest (1) and the lowest (3) eigenvalues deviate from their input value (110%
and 91% of the input value, respectively, both for SNR⫽64 and SNR ⫽35). This means that isotropic diffusion can be erroneously interpreted as anisotropic, which can be clearly seen for FA, which has the largest anisotropy for the isotropic case. However, the contrast between the ‘false’ anisotropy (‘iso’ case in Fig 5) and the simulated anisotropy in white matter is still large for FA. For all indexes except Cp, the white matter case still differed significantly from the ‘iso’-case (P⬍ .05), although for Cl, it is hardly significant.
Sensitivity to Changes
To be able to interpret the relative changes with respect to the contralateral tissue in an anisotropy index, the relative change (Change equation) was plotted as a function of changes in 1, 2, and 3,
defined by a ‘factor’ times the original value. This method of showing the sensitivity to changes was applied for three settings, corresponding to adult white matter, neonatal white matter, and settings close to the isotropic case. Showing all indexes would make the figure unclear, and therefore we have cho-sen to show only the cho-sensitivity to changes in FA, RA, and Am. Note that the equations describing all in-FIG 4. A–C, Eigenvalue
space plots, as introduced by Bahn (33) (explained in Fig 2), for FA, RA, and Am. In the
dexes are only valid as long as 1⬎2⬎3. In each
graph, the gray box denotes the area in which the equations are valid (Fig 6).
For input settings corresponding to adult white matter (Fig 6, top row), the relative change in 1
between 0.7 and 1.3 times its input value was close to a linear function of1, both for FA and RA, and also
for Ambut with a steeper slope. A decrease in1to
85% of its original value (factor 0.85), without changes in2and3, will result in a relative change of
⫺16% in FA,⫺17% in RA, but a relative change of
⫺26% in Am. For a decrease in 2with factor 0.85,
the changes will be⫹7%,⫹8%, and⫹16%, for FA, RA, and Am, respectively. For a decrease in3with factor 0.85, the changes were similar as for2for FA
and RA; only Amincreased less (⫹9%).
In settings corresponding to neonatal white matter (Fig 6, middle row), it is directly clear that for this situation, each anisotropy index was much more sen-sitive, and relatively small changes in one of the eig-envalues already resulted in larger changes than in the adult white matter case: a decrease in 1to 85%
of its original value (factor 0.85), now resulted in a relative change of ⫺36% in FA,⫺37% in RA, and even ⫺52% in Am. The index Am was still the most sensitive to changes.
For input settings even closer to isotropic, minor changes in one of the eigenvalues resulted in large changes in the relative change in anisotropy. The differences between the three anisotropy indexes be-came less pronounced the closer the input settings were to the isotropic case.
FIG 5. A–D, Results of simulations of the effect of random noise on ADC and eigen-values (AandC) and anisotropy (BandD) for the adult case (A and B) and neonate case (CandD). Open symbols indicate the input values (Table 2); filled symbols, the values after noise was added. The error bars show the standard deviation of the simu-lated results.
FIG 6. Relative change in FA, RA, and
Amas a function of a change in one of the
eigenvalues1,2, and3. The change is
Choice of Three Anisotropy Indexes
An intermediate discussion is necessary, to select the three most promising anisotropy indexes to use in our clinical study, based on the criteria mentioned in Methods.
As requirement 1 will be investigated in the next section, all indexes were evaluated with respect to requirements 2– 4, and the best three indexes will be selected for further use in the patient study.
First, anisotropic diffusion (e.g., in white matter) has to be distinguishable from isotropic diffusion (e.g., in gray matter). It can be concluded from Figure 3 that the value for VR in neonatal white matter is too low (0.06 ⫾ 0.04) to be really distinguishable from isotropic (value 0). All other indexes differ signifi-cantly from zero in neonatal white matter (P⬍.05), although for Cl, P ⬇ .05. Furthermore, the index
should be sensitive to cigar-shaped diffusion and less sensitive to pancake-shaped diffusion, as the latter occurs in areas where fibers are crossing, which will make the interpretation of anisotropy and changes in anisotropy more difficult. From the analysis of the eigenvalue space plots, it can be concluded that only Am and Cl (the latter is not shown in Figure 4, but
shows the same kind of gray-scale pattern) are sensi-tive to cigar-shaped and not sensisensi-tive to pancake-shaped diffusion. Cpis an index that is only sensitive
to pancake-shaped diffusion and is therefore less use-ful in this study.
The noise sensitivity was evaluated by using numer-ical simulations (Fig 5), and it was shown that Cpin
neonatal white matter could not be distinguished from the isotropic case anymore, and for Clthe
dif-ference of the simulated anisotropy in neonatal white matter from zero is hardly significant (P⬇.05).
Finally, with respect to the interpatient variability, it was shown (Fig 3) that the highest interpatient variability with respect to the average value was found in VR, Cp, and Cl.
Therefore, the three indexes that performed best were FA, RA, and Am, and these were further
inves-tigated in the patient study to evaluate their perfor-mance in a clinical setting.
Neonatal Patient Study
First, the results of the absolute values in the lesion and the contralateral tissue as a function of time after asphyxia (at birth) are discussed for the 11 included neonates. However, as these data originate from dif-ferent neonates and are not data as a function of time of one neonate, the relative change of the lesion compared with the contralateral tissue per patient is plotted as a function of the time and discussed in the second subsection.
Absolute Data. In Figure 7, the measured absolute
values of ADC, eigenvalues, and anisotropy indexes in 11 neonates with perinatal hypoxic ischemia (12 measurement points) are plotted as a function of time (in days after birth). Using a least squares fitting algorithm, we checked whether a trend in the data was present. The result is plotted only if the trend was
significant (P⬍.05). The absolute ADC values in the lesions increased as a function of the time after the onset of symptoms (P ⫽.02). The three eigenvalues (1, 2, and 3) in the lesion also increased as a
function of time, but only for the second and third eigenvalues (2and3) was the trend significant (P⫽
.03 and .002, respectively). The trend in the lesion for
3was most pronounced. All three anisotropy indexes
decreased as a function of time after the onset of symptoms (P⫽.008 for FA and RA and .007 for Am);
only the slope is different. In the contralateral tissue, the anisotropy did not change with time (R2⬇0).
Relative Data. The relative change, the ratio
be-tween the values in the lesion and values in the con-tralateral tissue, as defined in the Change equation, is shown in Figure 8 for the 11 neonates with hypoxic-ischemic white matter injury. The ADC is largely decreased after the insult, and the relative change increases with time, but the trend is not significant (P⫽.3). As shown in Figure 8B, the third eigenvalue
3 was more decreased during the first days after
ischemia than were 1 and 2 (i.e., at day 2, 3
de-creased by 68%, 2by 58%, and1by 46%), and 3
increased more rapidly than1and2. Only the trend
in the relative change in3was significant (P⫽ .03,
compared with .7 for 1and 0.20 for2).
The anisotropy in the lesion was increased compared with the contralateral tissue after the infarct and de-creased toward normal within the next 10 –11 days. The trend in the relative anisotropy change was most pro-nounced in Am, but for all indexes, the correlation
co-efficient was about the same (0.52– 0.55) and significant (P⫽.006 for FA and RA and .002 for Am).
Follow-up
In eight of the 11 neonates, a follow-up MR image was obtained at the age of 3 months. In six infants, (severe) tissue loss or signal intensity abnormalities were observed in the region of the lesion, with abnor-malities in the basal ganglia in two infants, and mildly to moderately delayed myelination in four and nor-mal myelination in two. In both infants without ab-normalities in the region of the infarct, myelination was delayed.
Clinical follow-up showed severe neuromotor and mental delay in three children, cerebral palsy in two, and visual impairment in one child. Normal develop-ment was observed in two children at the age of 1 year, in one at the age of 6 months, and in two at the age of 3 months.
Discussion
Choice of Three Anisotropy Indexes to Use in the Patient Study
From the results of the volunteer study, the neo-natal study, and the simulations, the three anisotropy indexes that are most likely to be useful in clinical practice for neonatal brain studies are the FA, RA, and Am. The advantage of the first two, besides the
intervolunteer variability relative to the average value was low, compared with the other indexes (15% and 16% in neonatal white matter). The advantage of Am
(with interpatient variability of 17% in white matter) is that this index was sensitive to linear diffusion and not sensitive to planar diffusion. This means that areas with crossing fibers, in which planar diffusion occurs, are not detected with this index.
Differences Between Neonates and Adult Volunteers
One of the main differences between the neonatal and adult brain is that in the former the white matter is less myelinated and structured and the brain con-tains more water, which is reflected by the higher ADC and lower anisotropy.
In the neonatal brain, the first eigenvalue (1),
which is said to reflect the diffusion parallel to the white matter fibers (11), was the same in white matter and corpus callosum and higher (61% and 14%, re-spectively) than that in adults, where1was smaller in
white matter than in corpus callosum. The values for the perpendicular diffusion were higher in the white matter than in the corpus callosum in neonates, and
also larger than that in adults (by 127% and 83%, respectively) where the values in corpus callosum and white matter were comparable. The anisotropy in both white matter and corpus callsoum in neonates cannot be explained by myelin, as both are not my-elinated at birth (28). The anisotropic diffusion in both structures might be due to the early wrapping of axons by oligodendroglial processes, as suggested by Hu¨ppi et al (16). The higher anisotropy in the corpus callosum can be explained by the fact that it is a compact structure with a higher density of fibers than in the white matter (29).
The effective diffusion coefficient is assumed to be composed of at least two components, the effective intracellular and the effective extracellular diffusion coefficient; both coefficients are called ‘effective’ be-cause they also contain exchange characteristics (35– 37). In axons surrounded by myelin, the exchange processes are considered slow (38).
A large difference between parallel and perpendic-ular diffusion, especially in the corpus callosum of adults (1.63 ⫾ 0.11 and 0.52⫾ 0.07 10⫺9m2/s), was
observed. If only the effective extracellular diffusion coefficient would show anisotropic behavior, the dif-ference between the parallel and the perpendicular
FIG 7. Average absolute val-ues for the ADC (top image), the three eigenvalues 1, 2,
and 3 (middle row), and the
three anisotropy indexes FA, RA, and Am(bottom row) as a
ADC would not be this large, given the normal tissue typical volume fractions of 0.8 in the intracellular space and 0.2 in the extracellular space. Therefore, it suggests that the effective intracellular diffusion is affected by membrane restrictions and is already anisotropic, although a soundly based explanation is not available, as the exact reason for diffusion anisot-ropy itself is still a subject of discussion (39). Mem-branes are considered to form the first restrictions, as anisotropy is already observed in the neonatal cere-brum before myelination (15, 18, 40), and myelination increases diffusion anisotropy (15, 41). The influence on the anisotropy of intracellular structures, like mi-crotubules and neurofilaments, and of microflow have been shown to be negligible in large (single) neurons, where diffusion is isotropic in the center (39, 42, 43). However, no data are available on their con-tribution in human axons, although the concon-tribution of microflow is small on time scales of diffusion measurements.
In neonates, both the ADC parallel to the fibers and the ADC perpendicular to the fibers are larger than those in adults. As the brain develops, the dif-fusion perpendicular to the white matter fibers will decrease due to increased myelination. The decrease in parallel diffusion may originate from changes in cell density, intracellular structure of the axons, and
decrease in overall water content in the brain during development (18). The average ADC in our term group (1.58⫾0.19 10⫺9m2/s) was larger than that in
the full-term group studied by Hu¨ppi et al (1.2⫾0.1 10⫺9m2/s), but in the same range as values found by
Neil et al (1.45 ⫾ 0.12 10⫺9m2/s) and Tanner et al (1.62⫾0.16 10⫺9m2/s) in the frontal white matter in
term neonates (15, 18, 44). The differences in ADC values between our study and other studies can be due to the use of a different DW imaging measure-ment technique. However, we cannot exclude small ADC abnormalities in our normal term group due to small disturbances in white matter tissue, which have not been observed directly on the conventional T1-and T2-weighted images, although these children had a normal MR image and a normal outcome.
The interpatient variability was much larger in the neonatal group than in the adult group. This most probably has several reasons. First, the global devel-opment of the white matter structure might have been delayed, as mentioned above. Second, both the ADC and anisotropy depend on gestational age, and the relatively large standard deviation in gestational age of the neonates can also cause a larger inter-patient variability on the ADC and anisotropy in-dexes. The relative interpatient variability com-pared with the average value in the neonatal group was smallest for FA (15%).
Decreased ADC and Increased Anisotropy in the Initial Stage After Ischemia
Directly after the insult, the ADC in neonates was largely decreased and all three anisotropy indexes were significantly increased; the same was found in adult stroke studies (21, 22, 45). In our study in neonates, a relative change in the parallel ADC (1)
by about ⫺50% was observed in the first days after the insult and a relative change in the perpendicular ADC (2and3) by ⫺60% to⫺70%.
Several mechanisms have been proposed to explain the reduction in the ADC in the initial stages of ischemia. Ischemic cell swelling (glial or neuronal) due to cell membrane dysfunction is observed histo-logically and correlates with a decreased ADC (46, 48, 49). It causes the water molecules to migrate from the extracelluar space with a high diffusion coefficient into the intracellular space with a lower diffusion coefficient, causing a net decrease in ADC due to changes in the volume distribution combined with an increase in extracellular tortuosity (1, 49, 50), al-though some argue that both intracellular and extra-cellular spaces have the same diffusion coefficient (51). The large decrease, especially in parallel diffu-sion, in our study cannot be explained by the water redistribution alone, and a decrease in intracellular dif-fusion coefficient is likely to occur at the same time, in correspondence to measurements of changes in diffu-sion coefficients of metabolites after ischemia (52–54). In most studies of ADC changes, the typical changes in anisotropy are not taken into account. If the relative decrease in all eigenvalues would be the
FIG 8. A–C, Time evolution of the relative change (Change
equation) in ADC values (A), the three eigenvalues (B), and the anisotropy indexes FA, RA, and Am(C) after hypoxic-ischemic
same, the anisotropy would not change, as was seen in patients after stroke by Green et al (55) by using so-called p-q diagrams. In our study, the ADC per-pendicular to the fibers was more decreased than the parallel ADC in all patients, causing the anisotropy to be increased. Changes in intracellular diffusion (i.e., by viscosity changes) as suggested by Sehy et al (56) would be the same for molecules diffusing along the fibers and those diffusing perpendicular to the fibers, and cannot cause the extra decrease perpendicular to the fibers (and corresponding increase in anisotropy after ischemia). Changes in the effective diffusion coefficient of the extracellular space due to increased tortuosity may account for the larger change in per-pendicular diffusion compared with parallel.
Yang et al (22) observe an increase in FA by 15– 20% in adults. We found a larger increase in neonates (i.e., 25%) at day 2 for FA and even higher values for RA and Am. The value of the relative change in
anisotropy depends on the anisotropy index that is used and on the anisotropy (and eigenvalues) of the tissue before ischemic changes, as seen in Fig 6. Therefore, these values for the relative change in anisotropy cannot be directly compared.
Time Evolution of ADC and Anisotropy in Neonates
In general, within the first hours after the onset of ischemia, the ADC decreases to about 50 – 60% of its original value and the anisotropy increases (21–23, 45). The ADC remains decreased during the first days, whereas the time evolution of the anisotropy is less clear: in the animal model, the anisotropy de-creases below its original value within several hours (23), whereas in humans both decreased and in-creased anisotropy is measured (21, 22). After several days, when cellular breakdown occurs and extracellu-lar edema develops, the ADC passes the pseudonor-malization point and is increased for several weeks, whereas the anisotropy decreases and remains de-creased. The ADC normalization is seen at a later point in time in humans than in animal studies and is still a subject of discussion (10, 57).
Although anisotropy in the neonatal brain is lower than that in the adult brain, with a higher interpatient variability, relative changes in all three anisotropy indexes can be used to characterize white matter lesions in addition to the ADC values as shown by our data. The changes in ADC and anisotropy show over-all the same trend as in the adult brain after stroke (21, 22), but the relative changes in neonatal white matter are larger. This difference results from the fact that the anisotropy in white matter tissue is much larger in adults than in neonates, causing the anisot-ropy index to be less sensitive to changes in the adult white matter than in the neonatal white matter (Fig 6). The trend in relative ADC change in our study (Fig 8) was less pronounced than in adult stroke data. In our data (up to 9 days), pseudonormalization of the ADC was not seen, whereas McKinstry et al (8) found pseudonormalization of the ADC between days 7 and
8 in neonates. However, we did not have serial mea-surements in time of the same neonate. We did not find a significant trend in the relative ADC change, the same findings as found by Forbes et al (6) for ADC changes in cortical injuries in neonates. In the absolute ADC data, however, the trend in the ADC in the lesion was significant (Fig 7).
One of the limitations of our study is that the contralateral tissue might be affected as well, as global hypoxia is known to reduce the ADC in the whole brain during hypoxia (58). However, no signif-icant difference between the ADC in the contralat-eral measurements and the normal control group was observed.
The trend in the absolute values of the three eig-envalues is only significant for changes in 2and3,
the diffusion perpendicular to the fibers. As no sig-nificant trend in1could be found, we conclude that
the ADC parallel to the fibers remains decreased in the first 10 days, whereas the ADC perpendicular to the fibers increases, resulting in a decrease in anisot-ropy. We hypothesized that the increasing ADC per-pendicular to the fibers can be assigned to membrane degradation and injury to the oligodendroglial pro-cesses in the premyelination phase, which result in a lower tortuosity of the extracellular space.
The almost linear increase in the perpendicular diffusion coefficient results in the even more pro-nounced trend in the relative change in anisotropy: the initial increase in anisotropy is seen to decrease almost linearly with time, heading toward pseudonor-malization between days 10 and 11. As discussed earlier, we hypothesized that the almost linear changes in anisotropy are related to changes in the membrane and the integrity of the axonal oligoden-droglial complex.
Differences between temporal evolution in adult stroke and neonatal brain injury due to perinatal complications are likely due to the differences in injury mechanisms as suggested by Neil et al (18) and McKinstry et al (8): adult stroke is a thromboembolic disease, whereas in neonates, reperfusion will start directly after injury. Another cause for differences might be that the complications occur in not fully developed brain tissue.
Usefulness in Clinical Practice
in neonates. Our data indicate that for further under-standing of the temporal evolution after ischemia, the eigenvalues give additional information that might be useful for the interpretation of structural tissue changes. In addition, the anisotropy index seems to be a good indicator that might be useful for timing of the lesion in cases in which the onset of the insult is not known.
Conclusion
Based on measurements in volunteers, neonates with normal MR images, and numerical simulations, three anisotropy indexes were selected to test their usefulness in clinical practice: FA, RA and Am, as the
intervolunteer variability relative to the average value was low for FA and RA, and Am was sensitive to
linear diffusion and not sensitive to planar diffusion. All three indexes can be used in clinical practice to observe the temporal evolution of anisotropy after the onset of symptoms; the index Amshows the
stron-gest trend in relative changes. Therefore, we conclude that Amwill be the best index to monitor changes in
anisotropy with time after symptoms.
We observed that all three anisotropy indexes re-spond differently to changes in one of the eigenval-ues, and that the value of the relative changes de-pends not only on the chosen index but also on the anisotropy of the tissue under investigation. This is the reason that the relative change in anisotropy after stroke in adults is smaller than the relative change in anisotropy observed in neonates.
The changes after ischemia are characterized by a large decrease in all eigenvalues (⬎40%), with an even stronger decrease in perpendicular diffusion than in diffusion parallel to the fibers. This decrease can only be explained if, besides the shift from extra-cellular water into the cell and increased tortuosity of the extracellular space, also the intracellular diffusion decreases. The temporal evolution of the ADC after the insult did not show a significant trend in neonates in our study (P⬎.05), in contrast to studies in adults (21, 22), but the trend in anisotropy changes was more pronounced than in the ADC and was significant (P⬍
.05). The trend in anisotropy is governed by changes in the diffusion perpendicular to the fibers, which we as-sign to changes in membrane and myelin integrity.
References
1. Moseley ME, Cohen Y, Mintorovitch J, et al.Early detection of regional cerebral ischemia in cats: comparison of diffusion- and T2-weighted MRI and spectroscopy. Magn Reson Med
1990;14:330 –346
2. Warach S, Chien D, Li W, Ronthal M, Edelman RR.Fast magnetic resonance diffusion-weighted imaging of acute human stroke. Neu-rology1992;42:1717–1723
3. Cowan FM, Pennock JM, Hanrahan JD, Manji KP, Edwards AD.
Early detection of cerebral infarction and hypoxic ischemic enceph-alopathy in neonates using diffusion-weighted magnetic resonance imaging.Neuropediatrics1994;25:172–175
4. Robertson RL, Ben-Sira L, Barnes PD, et al.MR line-scan diffu-sion-weighted imaging of term neonates with perinatal brain isch-emia.AJNR Am J Neuroradiol1999;20:1658 –1670
5. Inder T, Hu¨ppi PS, Zientara GP, et al.Early detection of
periven-tricular leukomalacia by diffusion-weighted magnetic resonance imaging techniques.J Pediatr1999;134:631– 634
6. Forbes KP, Pipe JG, Bird R.Neonatal hypoxic-ischemic encepha-lopathy: detection with diffusion-weighted MR imaging. AJNR Am J Neuroradiol2000;21:1490 –1496
7. Wolf RL, Zimmerman RA, Clancy R, Haselgrove JH.Quantitative apparent diffusion coefficient measurements in term neonates for early detection of hypoxic-ischemic brain injury: initial experience.
Radiology2001;218:825– 833
8. McKinstry RC, Miller JH, Snyder AZ, et al.A prospective, longi-tudinal diffusion tensor imaging study of brain injury in newborns.
Neurology2002;59:824 – 833
9. Baird AE, Warach S.Magnetic resonance imaging of acute stroke.
J Cereb Blood Flow Metab1998;18:583– 609
10. Sotak CH.The role of diffusion tensor imaging in the evaluation of ischemic brain injury: a review.NMR Biomed2002;15:561–569 11. Basser PJ, Mattiello J, LeBihan D. Estimation of the effective
self-diffusion tensor from the NMR spin echo. J Magn Reson B
1994;103:247–254
12. Basser PJ, Pierpaoli C.Microstructural and physiological features of tissues elucidated by quantitative-diffusion-tensor MRI.J Magn Reson B1996;111:209 –219
13. Pierpaoli C, Basser PJ.Toward a quantitative assessment of diffu-sion anisotropy.Magn Reson Med1996;36:893–906
14. Le Bihan D, Mangin JF, Poupon C, et al.Diffusion tensor imaging: concepts and applications.J Magn Reson Imaging2001;13:534 –546 15. Neil JJ, Shiran SI, McKinstry RC, et al.Normal brain in human newborns: apparent diffusion coefficient and diffusion anisotropy measured by using diffusion tensor MR imaging. Radiology
1998;209:57– 66
16. Hu¨ppi PS, Maier SE, Peled S, et al.Microstructural development of human newborn cerebral white matter assessed in vivo by diffusion tensor magnetic resonance imaging.Pediatr Res1998;44:584 –590 17. Hu¨ppi PS, Murphy B, Maier SE, et al. Microstructural brain
development after perinatal cerebral white matter injury assessed by diffusion tensor magnetic resonance imaging. Pediatrics
2001;107:455– 460
18. Neil J, Miller J, Mukherjee P, Hu¨ppi PS.Diffusion tensor imaging of normal and injured developing human brain: a technical review.
NMR Biomed2002;15:543–552
19. Miller SP, Vigneron DB, Henry RG, et al.Serial quantitative diffusion tensor MRI of the premature brain: development in newborns with and without injury. J Magn Reson Imaging
2002;16:621– 632
20. Hoehn M, Nicolay K, Franke C, van der Sanden B.Application of magnetic resonance to animal models of cerebral ischemia.J Magn Reson Imaging2001;14:491–509
21. Zelaya F, Flood N, Chalk JB, et al.An evaluation of the time dependence of the anisotropy of the water diffusion tensor in acute human ischemia.Magn Reson Imaging1999;17:331–348
22. Yang Q, Tress BM, Barber PA, et al.Serial study of apparent diffusion coefficient and anisotropy in patients with acute stroke.
Stroke1999;30:2382–2390
23. Carano RA, Li F, Irie K, et al.Multispectral analysis of the temporal evolution of cerebral ischemia in the rat brain.J Magn Reson Imaging2000;12:842– 858
24. Armitage PA, Bastin ME. Selecting an appropriate anisotropy index for displaying diffusion tensor imaging data with improved contrast and sensitivity.Magn Reson Med2000;44:117–121 25. Stejskal EO, Tanner JE.Spin diffusion measurements: spin echoes
in the presence of a time-dependent field gradient.J Chem Phys
1965;42:288 –292
26. Jones DK, Horsfield MA, Simmons A. Optimal strategies for measuring diffusion in anisotropic systems by magnetic resonance imaging.Magn Reson Med1999;42:515–525
27. Barnett A, Mercuri E, Rutherford M, et al.Neurological and perceptual-motor outcome at 5– 6 years of age in children with neonatal encephalopathy: relationship with neonatal brain MRI.
Neuropediatrics2002;33:242–248
28. Volpe JJ.Neurology of the Newborn, 3rd edition.Philadelphia: WB Saunders, 1995
29. McGraw P, Liang L, Provenzale JM.Evaluation of normal age-related changes in anisotropy during infancy and childhood as shown by diffusion tensor imaging. AJR Am J Roentgenol
2002;179:1515–1522
30. Douglas C, Montgomery G.Applied Statistics and Probability for Engineers.New York: John Wiley, 1999
32. Conturo TE, McKinstry RC, Akbudak E, Robinson BH.Encoding of anisotropic diffusion with tetrahedral gradients: a general math-ematical diffusion formalism and experimental results.Magn Re-son Med1996;35:399 – 412
33. Bahn MM.Comparison of scalar measures used in magnetic res-onance diffusion tensor imaging.J Magn Reson1999;139:1–7 34. Basser PJ, Pajevic S.Statistical artifacts in diffusion tensor MRI
(DT-MRI) caused by background noise. Magn Reson Med
2000;44:41–50
35. Ka¨rger J, Pfeifer H, Heink W.Principles and application of self-diffusion measurements by nuclear magnetic resonance.Adv Magn Res1988;12:1– 89
36. Szafer A, Zhong J, Gore JC.Theoretical model for water diffusion in tissues.Magn Reson Med1995;33:697–712
37. Stanisz GJ, Szafer A, Wright GA, Henkelman RM.An analytical model of restricted diffusion in bovine optic nerve.Magn Reson Med1997;37:103–111
38. Wachowicz K, Snyder RE.Assignment of the T(2) components of amphibian peripheral nerve to their microanatomical compart-mentsMagn Reson Med2002;47:239 –245
39. Beaulieu C.The basis of anisotropic water diffusion in the nervous system: a technical review.NMR Biomed2002;15:435– 455 40. Wimberger DM, Roberts TP, Barkovich AJ, Prayer LM, Moseley
ME, Kucharczyk J.Identification of “premyelination” by diffusion-weighted MRI.J Comput Assist Tomogr1995;19:28 –33
41. Gulani V, Webb AG, Duncan ID, Lauterbur PC.Apparent diffu-sion tensor measurements in myelin-deficient rat spinal cords.
Magn Reson Med2001;45:191–195
42. Hsu EW, Aiken NR, Blackband SJ.A study of diffusion isotropy in single neurons by using NMR microscopy. Magn Reson Med
1997;37:624 – 627
43. Takahashi M, Hackney DB, Zhang G, et al.Magnetic resonance microimaging of intraaxonal water diffusion in live excised lam-prey spinal cord.Proc Natl Acad Sci USA2002;99:16192–16196 44. Tanner SF, Ramenghi LA, Ridgway JP, et al.Quantitative
com-parison of intrabrain diffusion in adults and preterm and term neonates and infants.AJR Am J Roentgenol2000;174:1643–1649 45. Sorensen AG, Wu O, Copen WA, et al.Human acute cerebral
ischemia: detection of changes in water diffusion anisotropy by using MR imaging.Radiology1999;212:785–792
46. Rumpel H, Nedelcu J, Aguzzi A, Martin E.Late glial swelling after acute cerebral hypoxia-ischemia in the neonatal rat: a combined
magnetic resonance and histochemical study. Pediatr Res
1997;42:54 –59
47. Nedelcu J, Klein MA, Aguzzi A, Boesiger P, Martin E.Biphasic edema after hypoxic-ischemic brain injury in neonatal rats reflects early neuronal and late glial damage.Pediatr Res1999;46:297–304 48. Li F, Liu KF, Silva MD, et al.Acute postischemic renormalization of the apparent diffusion coefficient of water is not associated with reversal of astrocytic swelling and neuronal shrinkage in rats.
AJNR Am J Neuroradiol2002;23:180 –188
49. Benveniste H, Hedlund LW, Johnson GA.Mechanism of detection of acute cerebral ischemia in rats by diffusion-weighted magnetic resonance microscopy.Stroke1992;23:746 –754
50. Norris DG, Niendorf T, Leibfritz D.Health and infarcted brain tissues studied at short diffusion times: the origins of apparent restriction and the reduction in apparent diffusion coefficient.
NMR Biomed1994;7:304 –310
51. Duong TQ, Ackerman JJ, Ying HS, Neil JJ.Evaluation of extra-and intracellular apparent diffusion in normal extra-and globally isch-emic rat brain via 19F NMR.Magn Reson Med1998;40:1–13 52. Neil JJ, Duong TQ, Ackerman JJ.Evaluation of intracellular
dif-fusion in normal and globally-ischemic rat brain via 133Cs NMR.
Magn Reson Med1996;35:329 –335
53. van der Toorn A, Dijkhuizen RM, Tulleken CA, Nicolay K. Diffu-sion of metabolites in normal and ischemic rat brain measured by localized 1H MRS.Magn Reson Med1996;36:914 –922
54. Dijkhuizen RM, de Graaf RA, Tulleken KA, Nicolay K.Changes in the diffusion of water and intracellular metabolites after excito-toxic injury and global ischemia in neonatal rat brain.J Cereb Blood Flow Metab1999;19:341–349
55. Green HA, Pena A, Price CJ, et al.Increased anisotropy in acute stroke: a possible explanation.Stroke2002;33:1517–1521 56. Sehy JV, Ackerman JJ, Neil JJ.Apparent diffusion of water, ions,
and small molecules in the Xenopus oocyte is consistent with Brownian displacement.Magn Reson Med2002;48:42–51 57. Warach S, Mosley M, Sorensen AG, Koroshetz W.Time course of
diffusion imaging abnormalities in human stroke.Stroke1996;27: 1254 –1256