Vibration Mode Analysis For Control Algorithm
Implementation In Gyroscope Development
Mittapally Gopala Krishna Murthy, Dantala Dinkar, IM Chhabra, NVN Rao, KC Das and Putha Kishore
Abstract: Gyroscope is an inertial sensor widely used in the navigation systems for sensing angular motion about its axis. Various types of gyroscopes being used for different navigation applications. Coriolis Vibratory Gyroscope (CVG) comes under the category of vibratory gyroscope in which, a rotational sensitive Hemispherical Shell (HS) made to vibrate at one of its resonant mode by a suitable method like physical forcing by using impact hammer or electronically by the electro static forcing. The imparted wave mode on the hemisphere need to be a standing wave, with a group of four anti-nodes and four nodes separated by 90 phase. This mode of wave is basic requirement on the HS for sensing the rotation. In this paper, we have presented a novel method to characterize HS wave mode by measuring its frequency and study the wave pattern with capacitive pickoff measurement method. In this method, the localised displacement of HS at anti-nodal and nodal locations and their phase variation analysed to ensure the required wave mode on the HS for gyroscope applications.
Keywords: Hemisphere Navigation, Gyroscope, Vibration, Standing wave, Coriolis
——————————◆——————————
1.
INTRODUCTION
Groscope is a rotation sensing instrument in Inertial Navigation Systems (INS) [1]. Development of Coriolis Vibratory Gyroscope (CVG) delivers all the aerospace requirements like small in size, weight, power and high reliability [2]. CVG has rigidly fixed hemispherical shell, in which its resonant vibration mode called primary wave mode at a known amplitude (a) is excited [3]. Once the gyroscope rotates about its axis, the Coriolis forces acts on the vibrating HS generate a second standing wave on it [4], [7]. This Second wave mode receives energy from the primary wave. The rate of transfer of vibration energy on both the standing modes can be accounted in terms of changing amplitude and phase about the HS [4]. The major requirement in the CVG is to measure the frequency and standing wave profile on the HS. A Phase Locked Loop (PLL) control is used to follow the change in phase of vibration mode [5],[6] with temperature during the operation [8],[9]. The designed frequency of the HS is in the human audible frequency range (20 Hz to 20 KHz), a low cost frequency measurement method is proposed by using the high sensitive microphone compare to the expensive optical method by using laser vibrometer. The standing wave profile at nodes and anti-nodes locations along the phase relation between them is measured electronically through capacitor formation at a fixed locations around the HS [10].This scheme of capacitive pickoff is used in pendulous accelerometers [11], where the pendulum is suspended between the two fixed electrodes. When the accelerometer experiences an external force, the pendulum moves in response to the force applied.
2.
STANDING WAVE PATTERN
The HS forced by using the impact hammer to excite it’s all mode waves, along with the mode under study. One complete cycle of the required wave mode pattern on the shell is as shown in the Fig. 1a, during the initial phase the shell bows to its highest ellipsoidal shape and then revers to its spherical form as shown in Fig.1b. In the following phase, deformation into an ellipsoidal shape with semi-major and semi-minor axes of the ellipsoid interchanged at the equator and returning to its original spherical shape, this cycle repeats at the designed frequency. The circumference of HS creates a standing wave with four uniformly spaced anti-nodes (maximum displacement A, B, C, D) and four anti-nodes (zero displacement E, F, G, H). This mode of wave called driving mode and the pattern remained constant on HS under no rotation condition.
3.
DESIGN OF HEMISPHERICAL SHELL
HS designed with 1 mm thick wall out of Aluminium by using
SOLIDWORKS® a Computer Aided Design Software with high geometrical accuracies of ±5μm. It weighs 12 gm and 30 mm in diameter. The design and realized HS is as shown in Fig.2a is fabricated on CNC machine. HS has 6 mm solid cylindrical central stem to support the structure to minimize other wave modes when it is forced. Finite Element map (FEMAP) with NASTRAN simulation software used to analyse the wave mode profiles, frequencies etc. on the HS. Fig.2b shows the simulation of the required wave pattern. This figure displays a localised red shades on the shell’s rim, where the displacement is maximum are called anti-nodes of the wave. The two adjacent anti-nodes separated spatially
Fig.1a. standing wave mode on the shell.
First Half Cycle
Second Half Cycle
Fig.1b. different phases of standing wave
______________________
• Mittapally Gopala Krishna Murthy, IM Chhabra, NVN Rao, KC Das works in Research Centre Imarat (RCI), Hyderabad, India,09490475791 E-mail: [email protected] • Dantala Dinkar, Professor, National Institute of Technology,
Warangal, India, Email: [email protected]
• Putha Kishore, Department of H&S, Annamacharya Institute of Technology and Sciences Rajampet, India
by 90 as shown in Fig.1a (A, B, C &D). Simulation results shows this wave frequency as 6259Hz along with other cross coupling modes at frequency 2589Hz during the vibration. The choice of material and mounting method of the stem are parameters to decide the frequency of the HS. Fig.2 shows design parameters, simulated vibration profile and the realized HS with frequency at 6259Hz as per design. Experimentally this frequency need to confirm in gyroscope development.
4.
WORKING PRINCIPLE
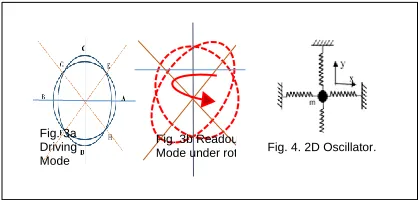
The required wave pattern as shown in the Fig.3a is established on the HS is called driving wave. While the platform on which HS is mounted rotates along the axis, Coriolis forces acts on the driving wave triggers another wave mode called readout wave as shown in Fig. 3b. The platform rotation produces a change in the driving wave pattern orientation, because of an exchange of wave energy from initial wave to the new wave. The rate of re-orientation of the wave pattern is proportional to the rotation rate by the HS. The measurement of amplitudes of two wave modes with time at any particular location is directly proportional to the platform rotation rate.
The HS driven and readout modes are identical, orthogonal and the amplitudes satisfy coupled oscillator equations. These equations are obey two dimensional oscillator equations. The degree at which the energy changed between the two waves used to measure the rotation about the axis. In most cases, the frequency of the readout mode is identical to that of the driving mode, like in the Foucault pendulum (where the earth rotation triggers the plane of oscillations to precess). The arctangent of the mode amplitude ratio changes in response to the external rotation rate. In any given time interval, the change in equivalent angle is proportional to the change in total inertial angle of the HS. The proportionality constant called the angular gain factor. An accurate control electronics needed to maintain the amplitude, remove any travelling mode component and always synchronize with the shell’s frequency. The standing
wave treated as a point mass ‘m’ moving in rigidly fixed x, y plane as shown in Fig.4. Mass point ‘m’, experiences the central force ‘F’ in the two dimensional (x-y) plane when exited is
F = -𝑘√𝑥2+ 𝑦2 (1)
When the system rotates about z-axis with angular velocity, the equations of motion in both x and y axis becomes
𝑥̈ − 𝑘(2Ω𝑦̇ + Ω̇y) + (𝜔2− k′Ω2)x = 𝑓
𝑥 (2) 𝑦̈ − 𝑘(2Ω𝑥̇ + Ω̇x) + (𝜔2− k′Ω2)y = 𝑓
𝑦 (3)
Where 𝑘 and 𝑘′ are Coriolis and Centrifugal terms, 𝑓𝑥 and 𝑓𝑦
are force components and 𝜔= (K/m) frequency of vibration.
When external force and rotation is absent ( = 𝑓𝑥 = 𝑓𝑦 = 0) the above equations reduce to simple wave
equations.
𝑥̈ + 𝜔2𝑥 = 0 (4)
𝑦̈ + 𝜔2𝑦 = 0 (5)
The general solution along x and y axis of these equations represents amplitudes (displacement) of mass point ‘m’.
𝑥 = 𝑎𝑐𝑜𝑠𝜃 cos(𝜔𝑡 + 𝜙) − 𝑞𝑠𝑖𝑛𝜃 sin(𝜔𝑡 + ϕ) (6)
𝑦 = 𝑎𝑠𝑖𝑛𝜃 cos(𝜔𝑡 + 𝜙) + 𝑞𝑐𝑜𝑠𝜃sin (𝜔𝑡 + 𝜙) (7)
As per the equations (6) and (7), the graph of x and y components of vibration amplitudes sweeps an elliptical orbit as shown in Fig.5a and an angle (𝜃). This outline contains parameters like principal wave amplitude (𝑎), quadrature wave amplitude (𝑞), angle of rotation (𝜃) and phase (). Accurate control loops required to extract the angular orientation of the vibration pattern on the HS. The role of control loops are to maintain 𝑎 at a prescribed level, nullify 𝑞 and Phase Lock Loop for controlling phase with temperature change. Under the above control loop algorithms, the x and y vibration components orbit becomes strait line as shown in fig. 5b. The angle 𝜃 is proportional to the inertial rotation of the platform.
The inertial sensitive standing wave with control loops
facilitate the measurement of an incremental angle (𝜃) continuously with respect to the previous angle. The angle of the vibration pattern at any instance can be computed as the ratio of the x and y amplitudes
𝜃 = tan−1( 𝑦 /𝑥) (8)
2D Vibration pattern inclined at 𝜃 with quadrature
2D Vibration pattern inclined at
𝜃 with near zero quadrature
.
Fig. 2 Designed Vibration sensor Shell a) Dimensions, b) Simulated model and c) Hemispherical Shell
a
b
c
Fig. 3a Driving Mode
Fig. 3b Readout
Mode under rotation Fig. 4. 2D Oscillator.
𝑥 𝑦
𝜃
𝑐𝑜𝑠𝜃
𝑠𝑖𝑛
𝜃
Fig.5a
𝑥 𝑦
𝜃 𝑐𝑜𝑠𝜃
𝑠𝑖𝑛
𝜃
5. EXPERIMENT
During the vibration, hemisphere rim mass which is 3.26gms only contribute in the displacement. Conventional measurement of frequency by using accelerometer cannot be used as its mass is more than 5gms. Hence, a non-contact technique is needed to measure the frequency. A low cost method of frequency measurement is attempted in this experiment. Since the frequency of the shell is in the audible range, a reasonable sensitive microphone could be used to record the wave frequency. With this idea an experimental setup is established in an anechoic chamber as shown in the Fig.6. HS is fixed on to the base rigidly to minimise the bending mode wave coupling on the shell. Piezo based impact hammer is used to force the shell at a point on its rim. When the resonator stuck with an impact hammer a ringing bell sound heard from HS. GRAS make 40AQ with IEC 61094 standard microphone is used to detect the sound. It has frequency sensitivity of 50mV/Pa in the range of 3Hz to 16 KHz. A careful calibration, of microphone is done at known frequency sources before using in the experiment.
The experimental setup arranged in an anechoic chamber to minimize background noise. The microphone mounted very close to the shell with stand as shown in the Fig.6. Signal from microphone acquired by using DEWE 4011 based acquisition system at 50K samples per second. The analog signal from the microphone fed to a pre amplifier before digitizing at 16-bit level. The acquisition software process the real time data from the shell. The time domain and frequency domain response of the microphone plotted as shown in the Fig.7a and 7b respectively. The time domain response of the sensor clearly shows the damping vibration created on the shell with the applied force pulse. The amplitude of the vibration sharply decline and slowly deceases to zero, the damping time shows that shell has Q-factor <50000. The frequency domain display of the sensor shows that energy of the vibration energy is at 6279 Hz, which has reasonable match with the design frequency of 6259 Hz.
Schematic of experimental setup in anechoic chamber
Fig.6 Experimental schematic
7a.Time domain signal 7b. Frequency domain signal
Fig.9a Capacitor arrangement around the HS
Fig.9b Angular orientations of capacitors
7. SIGNAL ANALYSIS SCHEME
To detect this small capacitance variation, AC bias capacitance measurement is used. In this method a 500 KHz sinusoidal carrier frequency 𝑐 applied to the shell. When force applied on the shell is zero all capacitor electrodes will receive the same
Microphone
Resonator with Mounting Flange
Acquisition System
Results
Forcing
The slight deviation in experimental results depends on various factors like fabrication accuracies and mounting of HS. This is a low cost solution to measure a critical parameter in CVG development. Since the performance of the gyroscope is dependent on the resonating frequency, accurate precise measurement of this parameter, as it is mandatory in gyroscope development. Based on the result a phase control electronics designed to maintain the frequency and phase of the principal wave.
6. Mode Analysis and Test Setup
The required vibration amplitude profile has four anti-nodes and four nodes on the HS. This vibration is detected electronically by using a set of capacitors arranged at a fixed angular locations around the shell as shown in Fig.9a and 9b. Shell acts as a common electrode and set of discrete copper pieces with dimensions 2mm x 2mm each forms a second electrode of the parallel plate capacitor. The gap between each copper electrode and the shell is within 30±3µm of all capacitors, this corresponds to equivalent capacitance is within 1.2±0.1pF. When the shell vibrates, its equatorial rim flexes up to ±5µm from rest position at the anti-nodal locations (A, B,C&D) as described in Fig.1a. Under this displacement condition the air gap of the parallel plate capacitor changes by 30±5µm causes change in capacitance (c) 15±5fF.
0
90
45
135
180
225 270 315
A B
C
D E
F G
frequency. During the vibration, the output signal from each capacitor contains the combination of carrier frequency 𝑐 and the shell’s vibration frequency𝑣 similar to Amplitude
Modulation (𝐴𝑀). Fig. 10b shows the vibration frequency when it forced by impact hammer at one of anti-nodes place. Signal processing required to extract frequency of interest, it includes demodulation to remove the carrier and suitable electronic filters to extract vibration frequency. Ultra low noise operational amplifiers are used in the signal processing circuit.
Fig.10 Time domain AM signal from capacitor
8. RESULT DISCUSSION
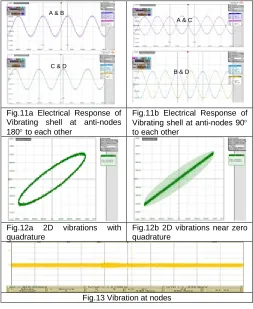
Fig. 11a shows the electrical response of the vibrating shell at anti-nodal locations A, B, C, D after demodulation and with appropriate gain stage. The mode under interest can be analysed by comparing the phase of the signals at these locations along with the frequency. When the mode under investigation is excited on the shell, capacitors at locations A and B experience a decrease in the air gap, which leads to increase in the capacitance. At the same time capacitors at C and D, experience decrease in capacitance as the air gap increases as discussed in section 2. These changes in the capacitances result in similar change in phases at the locations A, B and C, D. These signals picked by using the high input impedance ultra-low noise differential operational amplifier after demodulating with carrier. X-axis signal contains the differential signal from A & C and Y- axis signal is the differential signal from E & F. Fig. 11b shows phase relation of the vibration at the locations A, C and B, D. From phase of the signal, it is evident that the shell experiences a vibrational mode required for gyroscope function. When the shell is under the vibration, maximum displacement experienced at the anti-nodal locations and at the same time the nodal locations (E, F, G & H) does not show any displacement, which results no change in capacitance. These phenomena observed by picking the capacitor signals at the locations E, F, G and H as shown in Fig.13. The x, y plot of the mode with quadrature component shown in Fig.12a. To make the vibration inertial sensitive quadrature component to be removed by control algorithms. Fig.12b shows the principal wave with constant amplitude with zero quadrature component. Angular orientation is measure as per equation (8) under this condition.
Fig.11a Electrical Response of Vibrating shell at anti-nodes 180 to each other
Fig.11b Electrical Response of Vibrating shell at anti-nodes 90 to each other
Fig.12a 2D vibrations with quadrature
Fig.12b 2D vibrations near zero quadrature
Fig.13 Vibration at nodes
9.
CONCLUSION
The proposed non-contact method of measuring the frequency and vibration profile yields encouraging results largely in designing the electronic control loops to extract inertial angle. From this analysis, it established that the achieved frequency well matched with the simulated result. A novel and low cost method realized to measure frequency and the standing wave mode pattern for the HS. It is evident from the result that, the displacement on to the HS confined only at anti-nodal locations. The phase information at various capacitors locations around the shell reveals that it experiences required mode. It is also clear from the capacitance data that, the nodes locations do not show any displacement signal, which implies that the shell holds required mode. These results provides a base in the process of CVG control algorithm for extracting the angular information from the CVG.
ACKNOWLEDGMENTS
Authors acknowledge the support and encouragement by Director and Technology Director, RCI, Hyderabad.
REFERENCES
1. Kasevich, Mark, Science and Technology Prospect for Ultra Cold Atom, Stanford University, CAMOS, November 2002
2. Kubbat, Wolfgang J., Application of Strapdown Navigation to High Performance Fighter Aircraft, AGARD-LS-95, National Technical Information Service. 3. G I Dzhandzhgava, K. A Bakhonin, G M Vinogradov and A V Trebukhov 2010 Strapdown inertial navigation system based on a hemispherical resonator gyro Gyros copy Navigat.1(2) 91-97.
A & B
C & D
A & C
4. Lynch, D.D., A. Matthews, and G.T. Varty, Transfer of Sensor Technology from Oil Drilling to Space Applications, International Conferene on Inertial Navigation Systems, 25-27 May, 1998 St. Petersburg. Russia
5. D Lynch, A Matthews and G T V arty 1997Innovative mechanization to optimize inertial sensors for high or low rate operations Proc. Symp. Gyro Technol.Stuttgart, Germany 6 16- 17.
6. D D Lynch, R .R. Savaya and J J Campanile Nov 2006 Hemispherical resonator gyro control U. S. Patent 2006/0248 953.
7. A Matthews and F J Rybak 1992 Comparison of hemispherical resonator gyro and optical gyros IEEE Aerospace. Electron.Syst.Mag. 7(5) 40- 46.
8. Full Digital Control of Hemispherical Resonator Gyro Under Force-to-Rebalance Mode
9. Baomei Qiu, Member, IEEE, Jianwen Wang, Member, IEEE, and Penghua Li, Member, IEEE
10. [9] X. Wang, W. Wu, B. Luo, Z. Fang, Y. Li, and Q. Jiang, “Temperature drift compensation for hemispherical resonator gyro based on natural frequency,” Sensors, vol. 12, no. 5, pp. 6434–6446, 2012.
11. [10] The Synthesis Model of Flat-Electrode Hemispherical Resonator Gyro Zhennan Wei [OrcID] , Guoxing Yi *, Yan Huo, Ziyang Qi and Zeyuan Xu [OrcID] Space Control and Inertial Technology Research Center, Harbin Institute of Technology, Harbin 150080, Heilongjiang, China Sensors 2019, 19(7), 1690;
https://doi.org/10.3390/s19071690 Received: 13
February 2019 / Revised: 1 April 2019 / Accepted: 6 April 2019 / Published: 9 April 2019
12. [11] G. I. Dzhandzhgava, K. A. Bakhonin, G. M. Vinogradov, and A. V. Trebukhov, “Strapdown inertial navigation system based on a hemispherical resonance gyro,” Gyroscopy Navigat., vol. 1, no. 2, pp. 91–97, 2010.
13. [12] Zhong Su, Mengyin Fu, Qing Li, Ning Liu and Hong Liu, “Research on Bell-Shaped Vibratory Angular Rate Gyro's Character of Resonator” Sensors 2013, 13,4724-4741
14. [13] M. Gopala KrishnamurthyD. DinakarEmail authorI. M. ChhabraP. KishoreN. V. N. Rao PasalapudiK. C. Das “Frequency Measurement of Resonator for Vibrating Gyroscope” Engineering Vibration, Communication and Information Processing pp 311-316 Lecture Notes in Electrical Engineering book series (LNEE, volume 478) 15. [14] M Gopala Krishnamurthy, D. Dinkar, IM Chhabra, P.