78:3 (2016) 99–103 | www.jurnalteknologi.utm.my | eISSN 2180–3722 |
Jurnal
Teknologi
Full Paper
E
STIMATION OF
T
EMPERATURE AND
E
LECTRON
D
ENSITY IN
S
TAINLESS
S
TEEL
P
LASMA USING
L
ASER
I
NDUCED
B
REAKDOWN
S
PECTROSCOPY
Nurul Shuhada Tan Halid, Roslinda Zainal
*, Yaacob Mat Daud
Physics Department, Faculty of Science, Universiti Teknologi
Malaysia, 81310 UTM Johor Bahru, Johor, Malaysia
Article history
Received
15 August 2015
Received in revised form
15 November 2015
Accepted
30 December 2015
*Corresponding author
[email protected]
Graphical abstract
Abstract
LIBS plasma produced by a 1064 nm Q-switched Nd:YAG laser in an atmospheric pressure was studied for the stainless steel sample. The laser output energy 150 mJ with pulse duration of 6 ns. The plasma emission spectrum was recorded by the LR1 Spectrometer connected to the fibre optic. The plasma temperature and electron density of each element were estimated by time-resolved spectroscopy of neutral atom and ion line emission. The plasma temperature was obtained from the Boltzmann plot method and their electron density was determined by using Saha-Boltzmann equation method. The preliminary qualitative LIBS analysis shows that several elements contained in the stainless steel. The element detected was Cu, Fe, Mn, Ni, and Cr. The results shows that Mn and Fe has the highest plasma temperature of 1.2 eV, but the electron density of Mn was the highest with value 4.6x1020 cm-3, while the Cu has the lowest temperature
that is 0.73 eV with the electron density 2.8x1017 cm-3. The results are discussed.
Keywords: Nd:YAG laser, plasma temperature, electron density, LIBS
Abstrak
Plasma LIBS yang dihasilkan oleh laser Q-switched Nd:YAG yang mempunyai panjang gelombang 1064 nm pada tekanan atmosfera di kaji pada sampel keluli tahan karat. Tenaga keluar laser ialah 150 mJ dengan tempoh denyutan laser 6 ns. Pelepasan plasma di rekod oleh spektrometer LR1 yand disambungkan dengan fiber optik. Suhu plasma dan ketumpatan elektron bagi setiap unsur yang di kesan di anggar menggunakan spektroskopi masa di selesaikan atom neutral dan ion pelepasan garis. Suhu plasma di perolehi dari kaedah plot Boltzmann manakala ketumpatan elektron plasma di tentukan dari kaedah kiraan Saha-Boltzmann. Kualitatif awal untuk analisis LIBS menunjukan terdapat beberapa element di dalam keluli tahan karat. Elemen yang di kesan ialah Cu, Fe, Mn, Ni dan Cr. Keputusan menunjukan Mn dan Fe mempunyai suhu plasma paling tinggi iaitu 1.2 eV, dengan ketumpatan elektron Mn adalah tertinggi dengan nilai 4.6x1020 cm-3, manakala Cu mempunyai suhu terendah iaitu 0.73 eV bersama
ketumpatan 2.8x1017 cm-3. Keputusan di bincangkan.
Kata kunci: Laser Nd:YAG, suhu plasma, ketumpatan elektron, LIBS
© 2016 Penerbit UTM Press. All rights reserved
1.0 INTRODUCTION
Plasma is an ionized particle form results from high temperature heating in instant. It is very similar to gas and carry charges. It is also a form of matter that exist when atom are in excited state. They are excited
The analysis of plasma includes the spectral lines characteristics and the relationship between plasma properties. The plasma temperature and the electron density are related to the line widths [3]. When the wavelength longer, the Bremsstrahlung plasma shielding inversed, the ablation rate reduced, the plasma temperature increased and the elemental fractional increase [4].
Several research were done on plasma parameters of aluminium sample at different wavelength of visible and a UV laser [5], Nd:YAG laser [6] and its harmonic [7-9] and Er:YAG laser [10] and some research on carbon plasma by using Nd:YAG laser [11]. Recently the researchers are interested to investigate the influence of Nd:YAG laser at a fundamental wavelength of 1064 nm on ferrous metal for example zinc plasma, [12] steel plasma [13] and nonferrous metal lead plasma by using Nd:YAG laser [14]. Stainless steel is a metal iron that consists of nickel, chromium and many other elements. Its application was widely used in industry depend on their properties such as magnetic, non-magnetic, hardness and strength, and its corrosion resistance. As the result, the product quality control and it can be achieved by examining its element composition.
This research will focus on investigating the plasma temperature and the electron density of ferrous metal at different wavelength in air at atmospheric pressure. The Q-Switched Nd:YAG laser is used as a laser source at 1064 nm fundamental wavelength. This research is using multiple Q-switch Nd:YAG laser to vaporize the material from solid state to induce a plasma. Some of the researches use various types of procedure to determine the plasma parameter. (Sattmann et al., 1995) is using single, double and multiple Q-Switched to determine the plasma parameter and it shows that each parameter increase with multiple pulse compare to single pulse. The ablation and plasma excitation cannot be optimized separately if single pulse LIBS is used and it may interfere the analysis and reduced its flexibility.
2.0 ADVANTAGES AND CONCEPT OF LASER
INDUCED-BREAKDOWN
SPECTROSCOPY
(LIBS)
The advantages of this system are that it can be used for elemental detection in samples in any states, i.e., solid, liquid or gas. The other advantages of this system are portable and easy to use. The preparation for the sample is minimal and sometime does not need to be prepared. The best feature of LIBS system is it gives a great advantage in term of analytical time and minimum cost. LIBS can be used as a qualitative and quantitative analytical technique by using auto-calibration technique based on the theoretical model builds up on LTE, it also suitable for
in situ for real time analysis, in vacuum and at atmosphere [15].
The LIBS efficiency as analytical tools is based on a set on the assumption to be verified concerning both the laser matter interaction and the laser-induced plasma dynamics. The observed emission lines are directly correlated to the species energy distribution in the expanding plasma and the actual species concentration in the sample is already known [15]. The nature of particle making up the plasma, the kinetic, excitation, ionization and radiation are expected to contribute to the system state description. This description is mention by Maxwell, Boltzmann, Saha and Plank. The temperature, T defined as the particular form of energy and it can determine the equilibrium distribution of energy among the different state of the particle assembled. It may happen that the equilibrium distributions exist for one form of energy but not for another. Thermodynamic equilibrium will exist when all form of energy distribution is described by the same temperature.
In the case of Local Thermodynamic Equilibrium (LTE), the excitation temperature, Texc is equal to
temperature of electron, Te and TH temperature of
heavy particle i.e., atom and ions,
Texc = Te = TH ≠ Tυ
where Tυ is the temperature describing the photon
distribution. The escape of photon is associated with spatial gradient in the plasma and to time-dependent regimes, so that LTE can be established [16-18]. In LIBS plasma the ionization degree is sufficiently high, this completion dominated by the electron, i.e., Texc ~ Te and just a small perturbation
that is usually be neglected can be expected from the temperatures of electron and heavy particle [19]. In typical LIBS plasma only neutral atom and singly charged ion are presents to a significant degree. Therefore, only neutral and singly ionized particle will be considered. Under LTE condition, the population of the excited level for each species follows a Boltzmann distribution [20]. The condition of atomic and ionic state should be populated mainly by electron collision other than radiation, to ensure it has high collision rate the electron density must be sufficient. The minimum limit for electron density ne is,
ne = 1.6 x 10¹²T1/2 (ΔE) 3 (1)
where ΔE is the highest energy to hold the LTE condition, and T is the plasma temperature. This limit is given by McWhirter criterion to fulfill during the first stage of plasma lifetime. This criterion is necessary even though it insufficient for the condition [20].
𝑛𝑒𝑛𝑛𝐼𝐼 𝐼𝐼
= 2(2𝜋𝑚𝑒𝑘𝑇) 3 2
ℎ3
2𝑈𝐼𝐼(𝑇)
𝑈𝐼(𝑇) 𝑒
− 𝐸𝑖𝑜𝑛
𝑘𝑇 (2)
where neis the plasma electron density, nI and nII are
the number densities of the neutral atomic species and the single ionized species, respectively, Eion is the
ionization potential of the neutral species in its ground state, me is the electron mass, and h is
Planck’s constant. In accurate calculations, the ionization potential lowering factor Eion should be
taken into accounts for the typical value being on the order of 0.1 eV.
In the measurement of plasma temperature, many methods have described it based on the absolute or relative line intensity (line pair ratio or Boltzmann plot), the ratio line to the continuum intensity. The method was depending on the experimental condition whether it is suitable or not [21]. Boltzmann equation is use to relate the population of an excited level to the total number density of the species in the plasma. After the linearization, the formula of Boltzmann plot obtained was:
ln 𝐼𝑖𝑗
𝑔𝑖 𝐴𝑖𝑗
= ln ( 𝑛𝑠
𝑈𝑠(𝑇)) -
𝐸𝑖
𝑘𝑇 (3)
The left hand side of the equation (3) versus Ei was
plotted and has a slope of -1/kT. The plasma temperature can be calculated without ns and Us (T).
The gradient usually gives negative slope. The electron can be derived from the intensity ratio of the two lines corresponding to the different ionization stages of the same element when the plasma is near to LTE condition.
The formula of Saha equation refer to the ratio of the total number densities of two ionization stages of the same element, a similar expression holds for the population ratio of the two excited levels i and m of different ionization stage of the same element that is singly ionized and neutral atom [20]. After rearranging the equation, and consider the insertion the excluded the ionization potential lowering factor. The equation given to calculate the electron density is
𝑛𝑒 = 2(2𝜋𝑚𝑒𝑘𝑇)
3 2
ℎ3
𝐼𝑚𝑛𝐼
𝐼𝑖𝑗𝐼𝐼
𝐴𝑖𝑗𝑔𝑖𝐼𝐼
𝐴𝑚𝑛𝑔𝑚𝐼 𝑒
−𝐸𝑖𝑜𝑛+ 𝐸𝑖𝐼𝐼−𝐸𝑚𝐼
𝑘𝑇 (4)
Most of the research is using Stark broadening method and use the line intensity ratio to determine the electron density of plasma [22-26].
3.0 EXPERIMENTAL DETAILS
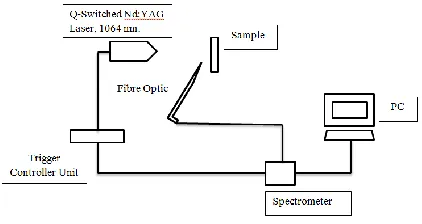
Figure 1 show the schematic diagram of LIBS experiment. The Q-Switched Nd:YAG laser (Nd:YAG Laser Cosmetic System) was operated at fundamental wavelength of 1064 nm, the repetition rate of 1 Hz and pulse width of 6 ns. The stainless steel
sample was placed on the target holder 12 cm away from the focusing lens and the experiment was performed at atmospheric pressure in air. The sample position was adjusted so that every laser pulse was incident on a fresh location of the target.
The plasma emission was collected and recorded by using an optical fibre-based collection system and LR1 spectrometer. The detector range for the LR1 spectrometer is from 200 – 1200 nm, with the spectral resolution < 2 nm. The exposure time for the spectrometer was from 2.5 ms to 10 s.
The fibre optic was position 8 cm from the sample and the angle was 450 to the laser beam. The
detector was synchronized with the Nd:YAG laser by using custom made Trigger Control Unit. The delay between the spectrometer and Nd:YAG laser pulse was set at 100 microseconds.
Figure 1 The schematic diagram of the experiment
The sample use for this experiment is stainless steel. The sample placed parallel to the target source to react with the plasma.
4.0 RESULT AND DISCUSSION
Figure 2 shows the plasma emission spectra of the stainless steel sample. The element detected was copper, manganese, iron, nickel, and chromium.
Table 1 Spectroscopic data of iron lines
Wavelength,
ʎ(nm)
Lower level of energy,
Ei (cm-1)
Upper level of energy,
Ek (cm-1)
(gk)x (Ak)
Ag
Lower level configuration
Upper level
configuration
230.01417 704.007 44 166.206 3.49e+07 3d64s2 3d6(3F2)4s4p(3P°)
243.930114 25 428.7893 66 411.712 3.15e+09 3d6(3G)4s 3d6(3G)4p
247.066913 22 810.3459 63 272.981 9.24e+08 3d6(3F2)4s 3d6(3F2)4p
248.015734 22 637.1950 62 945.045 1.24e+09 3d6(3F2)4s 3d6(3F2)4p
254.874389 21 812.0454 61 035.285 4.8e+08 3d6(3P2)4s 3d6(3P2)4p
255.068286 26 170.1810 65 363.607 1.28e+09 3d6(3H)4s 3d6(3H)4p
268.92121 7 376.764 44 551.335 1.18e+08 3d7(4F)4s 3d6(3F2)4s4p(3P°)
344.38763 704.007 29 732.736 2.38e+07 3d64s2 3d6(5D)4s4p(3P°)
372.76735 20 874.482 47 693.239 1.54e+07 3d64s2 3d6(3G)4s4p(3P°)
392.7920 888.132 26 339.696 1.30e+07 3d64s2 3d6(5D)4s4p(3P°)
*Reference [28]
Based on the plasma emission line in Figure 2, there were several elements found in the stainless steel. The elements were iron, chromium, copper, manganese, and nickel. There were other elemental composition detected but their intensity were small, exist in one or two lines such as carbon, nitrogen and silicon. These elements are identified by comparing their wavelength with NIST database as shown in Table 1.
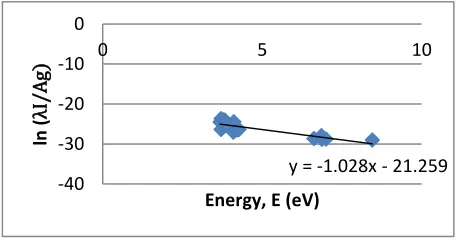
Figure 3 Boltzmann plot of iron
Figure 4 Boltzmann plot of nickel
In this spectroscopic analysis, the electron temperature was estimated by using Boltzmann plot method. Figure 3 shows the Boltzmann plot for iron element. λ and I are the wavelength and the intensity of the spectral lines. The temperature was obtained from the slope of the lines. The plasma temperature of iron was 1.2 eV. As for manganese, chromium, nickel and copper composition, temperature was 1.2 eV, 0.99 eV, 0.97 eV and 0.73 eV respectively.
Saha-Boltzmann equation or equation (3) was used to measure the electron density of the element in the stainless steel. Figure 4 shows the Boltzmann plot for nickel element. Based on the calculation in this research, the electron density of iron and manganese were 1.1x1019 cm-3 and 4.6x1020 cm-3
respectively. The electron density of the copper was 2.8x1017 cm-3. As for nickel and chromium, the
electron density was 1.29x1019 cm-3 and 5.8x1019 cm-3
respectively.
5.0 CONCLUSION
In this research, the elemental temperature of stainless steel plasma using LIBS technique was successful estimated from the Boltzmann plot. In addition, the electron density of the element was estimated using Saha-Boltzmann in which relates the intensity ratio of atomic and ionic emission lines. Comparing the value obtained in this research with others is difficult because of the different environment, condition and types of the method used.
Acknowledgement
We are grateful for the FRGS Grant No. R.J130000.7826.4F629 for supporting this project and Ministry of Higher Education (MoHE).
y = -0.8448x - 20.761 -30
-28 -26 -24 -22 -20
0 2 4 6 8 10
ln
(
λI
/A
g
)
Energy, E (eV)
y = -1.028x - 21.259 -40
-30 -20 -10 0
0 5 10
ln
(
λI
/A
g)
References
[1] Peter, S. A. 1994. Plasma Physics: An Introduction to the Theory of Astrophysical, Geophysical & Laboratory
Plasmas. Cambridge University Press. ISBN
978-0-521-44810-9.
[2] Anabitarte, F., Cobo, A. and Higuera, J. M. L. 2012. Review
Article Laser Induce Breakdown Spectroscopy:
Fundamental, Application and Challenges. International
Scholarly Research Network (ISRN) Spectroscopy. 285240.
[3] Hussain, T. and Gondal, M. A. 2013. Laser Induced Breakdown Spectroscopy (LIBS) as a Rapid Tool for Material Analysis. Journal of Physics: Conference Series. 439: 012050.
[4] Mao, X., Chan, W. T., Caetano, M., Shannon, M. A. and Russo, R. E. 1996. Preferential Vaporization and Plasma Shielding During Nano-Second Laser Ablation. Applied
Surface Science. 96(98): 126-130.
[5] Amoruso, S., Armenante, M., Berardi, V., Bruzzese, R. and Spinelli, R. 1997. Absorption and Saturation Mechanism in Aluminium Laser Ablated Plasmas. Appl. Physics. A. 65: 265-271.
[6] Gomba, J. M., D’angelo, C., Bertuccelli, D. and Bertuccelli, G. Spectroscopic Characterization of Laser Induced Breakdown in Aluminium-Lithium Alloy Samples for Quantitative Determination of Traces. Spectrochim
Acta B. 56: 695-705.
[7] Abdellatif, G. and Imam, H. 2002. A Study of Laser Plasma
Parameters at Different Laser Wavelengths.
Spectrochimica Acta Part B. 57: 1155-1165.
[8] Luo, W. F., Zhao, X. X., Sun, A. Q. B., Gao, C. X., Tang, J., Zhao, W. 2011. Spatial Diagnostic of 532 nm Laser-Induced Aluminium Plasma. Nuclear Instrument and Methods in
Physics Research A. 637: S158-S160.
[9] Hussein, A. E., Diwakar, P. K., Harilal, S. S. and Hasanein, A. 2013. The Role of Laser Wavelength on Plasma Generation and Expansion of Ablation Plumes in Air. Journal of
Applied Physics. 113: 143-305.
[10] Detalle, V., Sabsabi, M., Louis, S. O. A., Hamel and Heon, R. 2003. Influence of Er:Yag and Nd:Yag Wavelength on Laser-Induced Breakdown Spectroscopy Measurement under Air or Helium Atmosphere. Applied Optics. 42(30): 5971-5977.
[11] Hanif, M., Salik, M. and Baig, M. A. 2011. Quantitative Studies of Copper Plasma using Laser Induced Breakdown Spectroscopy. Optic and Laser in Engineering. 49: 1456-1461.
[12] Qindeel, R., Dimitrijevi, M. S., Shaikh, N. M., Bidin, N. and Daud, Y. M. 2010. Spectroscopic Estimation of Electron Temperature and Density of Zinc Plasma Open Air Induce by Nd:Yag Laser. Eur. Phy. J. Appl. Phys. 50: 30701. [13] Shah, M. L., Pulhani, A. K., Gupta, G. P. and Suri, B. M.
2012. Quantitative Elemental Analysis of Steel using Calibration-Free Laser-Induced Breakdown Spectroscopy.
Applied Optics. 51(20).
[14] Nek, M. S., Kalhoro, M. S., Hussain, A. and Baig, M. A. 2013. Spectroscopy Study of a Lead Plasma Produced by the 1064 nm, 532 nm and 355 nm of a Nd:Yag Laser.
Spectrochimica Acta Part B: 88: 198-202.
[15] De Giacomo A. 2003. Experimental Characterization of Metallic Titanium-Laser Induced Plasma by Time and
Space Resolved Optical Emission Spectroscopy.
Spectrochim Acta B. 58(1): 71-83.
[16] Fujimoto, T. 2004. Plasma Spectroscopy. Clarendon Press, Oxford.
[17] Van Der Mullen, J. M. N. 1990. On the Atomic State Distribution Function in Inductively Coupled Plasmas -The Stage of Local Thermal Equilibrium and its Validity Region.
Spectrochim Acta Part B. 45: 1-13.
[18] Capitelli, M., Capitelli, F. and Eletskii, A. 2000. Non-Equilibrium and Non-Equilibrium Problems in Laser-Induced Plasmas. Spectrochim. Acta Part B. 55: 559-574.
[19] Cristoforetti, A. g., De Giacomo, A. B., Dell'aglio C. M., Legnaioli, A. E. S., Tognoni, A. V., Palleschi, A. N. and Omenetto, D. 2010. Local Thermodynamic Equilibrium in Laser-Induced Breakdown Spectroscopy: Beyond The Mcwhirter Criterion. Spectrochimica Acta Part B. 65: 86-95. [20] Miziolek, A. W., Palleschi, V. and Schechter, I. 2006. Laser-Induced Breakdown Spectroscopy (LIBS) Fundamentals
and Applications. Cambridge University Press, United
Kingdom, Britain.
[21] Bye, C. A. and Scheeline, A. 2003. Appli. Spectrosc. 2022-2030.
[22] Hanif, M., Salik, M. and Baig, M. A. 2011. Quantitative Studies of Copper Plasma using Laser Induced Breakdown Spectroscopy. Optic and Laser in Engineering. 49: 1456-1461.
[23] Sattmann, R., Sturm, V. and Noll, R. 1995. Laser-Induced Breakdown Spectroscopy of Steel Samples using Multiple Q-Switch Nd:Yag Laser Pulses. J. Phys. D. 28: 2181-2187. [24] Unnikrishnan, V. K., Alti, K., Kartha, V. B., Santoshi, C.,
Gupta, G. P. and Suri, B. M. 2010. Measurement of Plasma Temperature and Electron Density in Laser-Induced Copper Plasma by Time-Resolved Spectroscopy of Neutral Atom and Ion Emissions. Indian Academy of Science. 74(6): 983-993.
[25] Torres, J., Palomares, J. M., Sola, A., Van der Mullen, A. A. J. N. and Gamero, A. 2007. A Stark Broadening Method to Determine Simultaneously the Electron Temperature and Density in High-Pressure Microwave Plasmas. J. Phys. D. 40: 5929-5936.
[26] Shaikh, N. M., Kalhoro, M. S., Hussain, A. and Baig, M. A. 2013. Spectroscopy Study of a Lead Plasma Produced by the 1064 nm, 532 nm and 355 nm of a Nd:YAG Laser.
Spectrochimica Acta Part B. 88: 198-202.
[27] Haddad, J. E., Canioni, L. and Bousquet, B. 2014. Good Practice in Libs Analysis. Spectrochimica Acta Part B. 101: 171-182.