Immune Correlates of Protection in Rhesus Macaques
Ligong Chen,a,cJarad M. Schiffer,aShannon Dalton,a,cCarol L. Sabourin,bNancy A. Niemuth,bBrian D. Plikaytis,aConrad P. Quinna Centers for Disease Control and Prevention, Atlanta, Georgia, USAa; Battelle, Columbus, Ohio, USAb; Atlanta Research and Education Foundation, Inc., Decatur, Georgia, USAc
Humoral and cell-mediated immune correlates of protection (COP) for inhalation anthrax in a rhesus macaque (Macaca mu-latta) model were determined. The immunological and survival data were from 114 vaccinated and 23 control animals exposed
toBacillus anthracisspores at 12, 30, or 52 months after the first vaccination. The vaccinated animals received a 3-dose
intra-muscular priming series (3-i.m.) of anthrax vaccine adsorbed (AVA) (BioThrax) at 0, 1, and 6 months. The immune responses were modulated by administering a range of vaccine dilutions. Together with the vaccine dilution dose and interval between the first vaccination and challenge, each of 80 immune response variables to anthrax toxin protective antigen (PA) at every available study time point was analyzed as a potential COP by logistic regression penalized by least absolute shrinkage and selection oper-ator (LASSO) or elastic net. The anti-PA IgG level at the last available time point before challenge (last) and lymphocyte stimula-tion index (SI) at months 2 and 6 were identified consistently as a COP. Anti-PA IgG levels and lethal toxin neutralizastimula-tion activ-ity (TNA) at months 6 and 7 (peak) and the frequency of gamma interferon (IFN-␥)-secreting cells at month 6 also had
statistically significant positive correlations with survival. The ratio of interleukin 4 (IL-4) mRNA to IFN-␥mRNA at month 6 also had a statistically significant negative correlation with survival. TNA had lower accuracy as a COP than did anti-PA IgG re-sponse. Following the 3-i.m. priming with AVA, the anti-PA IgG responses at the time of exposure or at month 7 were practicable and accurate metrics for correlating vaccine-induced immunity with protection against inhalation anthrax.
T
o date, there has not been a systematic evaluation of therela-tionship between anthrax vaccine-stimulated humoral and cell-mediated immune responses, their relative contributions to protection, or their comparative importance when used singly or in combination to predict the probability of survival in animal models or in humans.
Anthrax toxin protective antigen (PA) is the primary immuno-gen in licensed anthrax vaccines in the United States and the Eu-ropean Union, as well as in many of the second-generation
an-thrax vaccines in current development (1). Consequently, the
quantitative analysis of anti-PA IgG antibody levels and lethal toxin neutralization activity (TNA) in serum are generally ac-cepted as immunological correlates of protection (COP) for
vac-cine efficacy in animal models (2). Anti-PA IgG levels and TNA
are also considered pivotal for cross-species predictions of anthrax vaccine efficacy in humans, for whom clinical efficacy studies are
either impractical or ethically infeasible (3, 4) (http://www.fda
.gov/AdvisoryCommittees/CommitteesMeetingMaterials/Blood VaccinesandOtherBiologics/VaccinesandRelatedBiologicalProducts AdvisoryCommittee/ucm239733.htm). Anti-PA IgG and TNA levels, however, are but one part of the spectrum of humoral and cell-mediated immune responses that may contribute to protec-tion. The COP for anthrax may differ depending on vaccine
for-mulations, schedules, and routes of administration (5–10).
The U.S.-licensed anthrax vaccine adsorbed (AVA) (BioThrax) was approved in 1970 for the prevention of anthrax in humans (11–14). The original regimen for AVA was a subcutaneous (s.c.) six-dose primary schedule at 0, 0.5, 1, 6, 12, and 18 months, with subsequent annual boosters. In May 2012, the U.S. Food and Drug Administration (FDA) approved the AVA regimen as an intramus-cular (i.m.) three-dose priming schedule at 0, 1, and 6 months, with
boosters at 12 and 18 months and annually thereafter (http://www
.fda.gov/BiologicsBloodVaccines/Vaccines/ApprovedProducts /ucm304758.htm). These recent changes in the schedule and
ad-ministration route were based on data from the Centers for Dis-ease Control and Prevention Anthrax Vaccine Research Program
(AVRP) (12,13). The goals of the AVRP were to improve the AVA
safety profile and ensure efficacy while minimizing the number of doses required. The study objectives included determining immu-nological correlates of protection, documenting vaccine efficacy, and optimizing the vaccination schedule and route of
administra-tion (14). Due to the low prevalence of inhalation anthrax and the
ethical concerns of conducting an efficacy trial in humans, vaccine efficacy and duration of protection were evaluated in rhesus
ma-caques (Macaca mulatta) (15).
The AVRP nonhuman primate (NHP) study used the 0-, 1-, and 6-month intramuscular priming series (3-i.m.) with a full human dose or saline dilutions of AVA to modulate the immune response. The NHP were challenged with high-dose (median,
504⫻the 50% lethal dose [LD50]) aerosolizedBacillus anthracis
spores at month 12, 30, or 52. The specific humoral and PA-stimulated cellular immune response variables were examined during and after the 3-i.m. schedule. In an earlier analysis, the vaccine-induced immune responses were characterized by analy-sis of variance (ANOVA) and logistic regression. These models were individually fitted to each immunological variable to
deter-Received21 July 2014 Returned for modification7 August 2014 Accepted29 August 2014
Published ahead of print3 September 2014
Editor:H. F. Staats
Address correspondence to Conrad P. Quinn, [email protected].
Supplemental material for this article may be found athttp://dx.doi.org/10.1128 /CVI.00469-14.
Copyright © 2014, American Society for Microbiology. All Rights Reserved.
doi:10.1128/CVI.00469-14
on August 17, 2020 by guest
http://cvi.asm.org/
mine if a variable could predict survival at a specific time point
subsequent to the completion of the 3-i.m. priming (15).
In the present analysis, we adopted an alternative strategy to more comprehensively interrogate the AVRP rhesus macaque im-munological data to select the best available COP variables. A representative set of 18 immunological responses to PA and 3
response ratios representing Th1/Th2 bias (16,17), interleukin-4
(IL-4) protein to gamma interferon (IFN-␥) protein, IL-4 mRNA
to IFN-␥mRNA, and IL-4-secreting cells to IFN-␥-secreting cells
was used to generate a data set of 80 response variables, each of which was considered individually at every available study time point. Together with the AVA dose and time interval between scheduled first vaccination and challenge, we performed variable selection using penalized logistic regressions by two complement-ing statistical approaches, the strcomplement-ingency of least absolute shrink-age and selection operator (LASSO) and the correlation tolerance
of elastic net. Three R software packages, Glmnet (18), Elasticnet
(19), and Pensim (20), as well as the C⫹⫹software Bayesian
binary regression (BBR) (21), which differ in their optimization
algorithms and penalty parameter tuning, were used to avoid hav-ing to exclude important predictors and to ensure the selection of a reliable set of COP. The simplest plausible sets of variables were
derived (22). The selected variables were evaluated for their
cor-relation with survival, adjusting for variable multicollinearity. The receiver operator characteristic (ROC) area under the curve (AUC) was used as the criterion for testing the accuracy of the prediction model. This comprehensive approach utilized all the available information from the NHP study to select the most prac-ticable and accurate COP for AVA-vaccinated NHP.
MATERIALS AND METHODS
NHP study design, vaccination schedule, and challenge.The rhesus ma-caque (Macaca mulatta) study design, vaccination, sample schedules, and challenge outcomes have been described in detail (15). Due to the number of vaccinated NHP (n⫽114), long duration, and multisite nature of the study, the NHP were organized into 12 groups of 8 to 10 animals plus 2
controls per group, for a total of 137 animals. The control animals were given saline injections instead of AVA but were otherwise treated identi-cally to the vaccinated animals (Table 1). Different groups were vacci-nated with the full human dose of AVA (HuAVA), saline-diluted AVA at a 1:5, 1:10, 1:20, or 1:40 dilution, or a saline placebo. The injections were 0.5-ml intramuscular (i.m.) injections administered at 0, 1, and 6 months, followed by aerosol challenge with spores ofB. anthracisAmes strain at month 12, 30, or 52.
Humoral and cellular immune responses to AVA.The immunolog-ical variables used in the analysis are listed inTable 2. The methods for determining the total anti-PA IgG concentrations (g/ml), TNA titers, anti-PA IgG avidity index (AI), lymphocyte (peripheral blood mononu-clear cell [PBMC]) stimulation index (SI), and frequencies of PA IgG-specific B cells, IFN-␥-secreting cells, and IL-4-secreting cells are de-scribed in detail elsewhere (15) and are reproduced in brief in the supplemental material. The methods for evaluating the PA-specific in-duction of gene transcription (mRNA) and translation (protein secre-tion) for cytokines associated with Th1 (IFN-␥and IL-2), Th2 (IL-4 and IL-6), and acute-phase (IL-1and tumor necrosis alpha [TNF-␣]) im-mune responses in PBMC are provided in Tables S1 to S3 and the supple-mental methods in the supplesupple-mental material).
TABLE 1Basic characteristics for nonhuman primates included in the
studya
Group no.
No. in group (no. survived)
Challenge time (mo)
Vaccine dilution Treated Control
1 10 (8) 2 (0) 52 Undiluted
2 9 (9) 1 (0) 52 1:5
3 10 (6) 2 (0) 52 1:10
4 10 (5) 2 (1) 12 1:20
5 10 (4) 2 (1) 12 1:40
6 10 (8) 2 (0) 12 1:10
7 10 (6) 2 (1) 12 1:20
8 10 (9) 2 (1) 12 1:40
9 9 (6) 2 (1) 30 1:10
10 10 (10) 2 (0) 30 Undiluted
11 8 (8) 2 (1) 30 1:5
12 8 (7) 2 (1) 30 1:20
Total 114 (86) 23 (7) a
A total of 137 rhesus macaques (Macaca mulatta) were included in the study. The animals were injected intramuscularly with a 0.5-ml human dose of AVA or saline-diluted AVA (treated) or saline (control) at 0, 1, and 6 months, followed by aerosol challenge with spores ofB. anthracisAmes strain at month 12, 30, or 52.
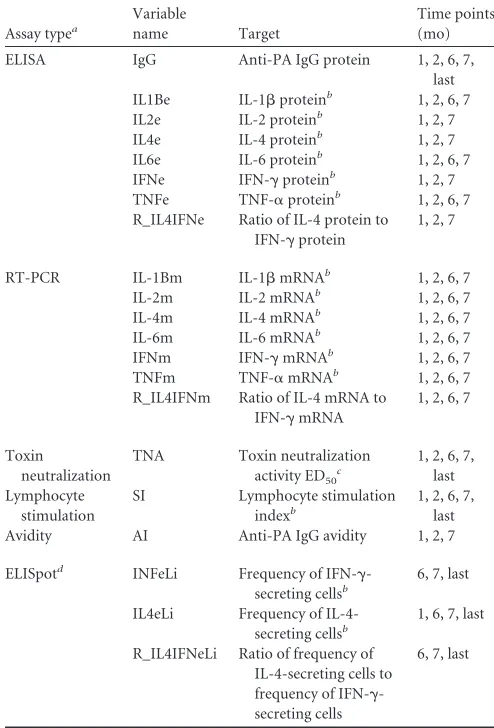
TABLE 2Assay variables used in the analysise
Assay typea
Variable
name Target
Time points (mo)
ELISA IgG Anti-PA IgG protein 1, 2, 6, 7, last IL1Be IL-1proteinb 1, 2, 6, 7
IL2e IL-2 proteinb 1, 2, 7
IL4e IL-4 proteinb 1, 2, 7
IL6e IL-6 proteinb 1, 2, 6, 7
IFNe IFN-␥proteinb 1, 2, 7
TNFe TNF-␣proteinb 1, 2, 6, 7
R_IL4IFNe Ratio of IL-4 protein to IFN-␥protein
1, 2, 7
RT-PCR IL-1Bm IL-1mRNAb 1, 2, 6, 7
IL-2m IL-2 mRNAb 1, 2, 6, 7
IL-4m IL-4 mRNAb 1, 2, 6, 7
IL-6m IL-6 mRNAb 1, 2, 6, 7
IFNm IFN-␥mRNAb 1, 2, 6, 7
TNFm TNF-␣mRNAb 1, 2, 6, 7
R_IL4IFNm Ratio of IL-4 mRNA to IFN-␥mRNA
1, 2, 6, 7
Toxin neutralization
TNA Toxin neutralization activity ED50
c
1, 2, 6, 7, last Lymphocyte
stimulation
SI Lymphocyte stimulation indexb
1, 2, 6, 7, last Avidity AI Anti-PA IgG avidity 1, 2, 7
ELISpotd INFeLi Frequency of IFN-␥
-secreting cellsb
6, 7, last
IL4eLi Frequency of IL-4-secreting cellsb
1, 6, 7, last
R_IL4IFNeLi Ratio of frequency of IL-4-secreting cells to frequency of IFN-␥ -secreting cells
6, 7, last
a
Eighty assay variables were determined by 6 types of assays.
bDetermined fromin vitroPA-stimulated peripheral blood mononuclear cells (PBMC). c
ED50, 50% effective dose.
dELISpot, enzyme-linked immunosorbent spot assay. e
The study variables for vaccine dilution and time of challenge were also included in the model, for a total of 82 variables.
on August 17, 2020 by guest
http://cvi.asm.org/
Data set construction.The construction of data sets is detailed in the supplemental material. Briefly, the data were from control and vaccinated animals that completed the study (Table 1). Except for vaccine dose and the interval between first vaccination and aerosol challenge, the primary data set was constructed, with each variable corresponding to an assay, with measurements taken immediately before each injection, 4 weeks af-ter each injection, and the last available time point prior to aerosol chal-lenge. For an assessment of the relative contributions of humoral and cellular immune responses, ratio variables were generated by dividing the Th2 response-related variables by the Th1 response-related variables. The ratio variables were the ratio of IL-4 mRNA to IFN-␥ mRNA (R_IL4IFNm), the ratio of secreted IL-4 protein to secreted IFN-␥protein (R_IL4IFNe), and the ratio of the frequency of IL-4-secreting cells to that of IFN-␥-secreting cells (R_IL4IFNeLi). The measurement at each time point was then converted to an individual variable (e.g., anti-PA IgG at month 6 is one variable [IgG_6], and anti-PA IgG at month 7 is a separate variable [IgG_7]). The month-7 time point, which is 1 month after the priming series, was designated “peak,” and the last available time point prior to challenge was designated “last” for all NHP. There was a broad range of missing rates for different variables (see Table S4 in the supple-mental material). Multiple imputations were used to minimize the bias from missing data (see Table S5 and methods in the supplemental mate-rial). Some variables were not imputed due to the high frequency of miss-ing data and therefore were removed from the data set. The final assay variables (n⫽80) used in the analysis are listed inTable 2, in addition to the 2 study variables used for vaccine dilution and the time of challenge.
Variable selection by logistic regression penalized by LASSO and elastic net.Variable selection was performed on 20 imputed data sets. Variables that were selectedⱖ10 times out of the 20 imputed data sets were included in the final variable set for each selection method (see the supplemental material) (23,24). To have the highest confidence that the best correlates were identified, we selected software packages that em-ployed two statistical approaches and that differed in their optimization algorithms and penalty parameter tuning. LASSO and elastic net variable selections were performed in three R packages: Glmnet (18), Elasticnet (19), and Pensim (20), and LASSO variable selection was performed in the C⫹⫹software package BBR (21) (see Table S6 in the supplemental ma-terial). LASSO may undergo too-stringent shrinkage and thus ignore portant predictors, while elastic net has a grouping effect, selecting im-portant predictors even if they are correlated with each other. Elastic net may consequently select too many predictors, resulting in overfitting in the prediction model (18,19). Repeated (60 times) 10-fold cross-valida-tions were performed to select the best penalty parameters. The optimal sets of variables were selected, with the penalty parameters being where the cross-validation error is minimal or the cross-validated likelihood is maximal. The simplest plausible (parsimonious) sets of variables were selected by applying the “1-standard error rule” (24), choosing the vari-ables with the penalty parameters for which the cross-validation error reached the sum of the minimum cross-validation error and one standard error. The correlation between each selected variable and survival was examined by simple logistic regression in SAS version 9.3 (SAS Institute, Cary, NC) with the original unimputed data set.
Collinearity or multicollinearity diagnosis and evaluation of model performance.Although variables with high rates of missing data are not useful for building practicable models, these variables are still worthy of examination. If the performances of the models that include these vari-ables are compared with those of the models that exclude these varivari-ables, the importance of these variables will be known. If these variables do not add much to the performances of the models, these variables can be safely excluded from the models. Otherwise, these variables should be taken into consideration in the future generation of prediction models. Therefore, the model evaluation was performed with the imputed data sets including variables that were heavily imputed.
The emphasis on PA as the primary immunogen and the interrelated-ness of the many facets of acquired immunity may result in data from two
or more immunoassays being highly correlated with each other. In addi-tion, variables from the same immunoassay but that are measured at dif-ferent time points may also be highly correlated. Therefore, collinearity or multicollinearity may occur if these variables are present in the same re-gression models. Logistic rere-gression does not work properly on models containing collinear or multicollinear variables. Therefore, before an eval-uation of each variable set for the potential to be a prediction model with good performance, a collinearity or multicollinearity diagnosis was com-pleted (see the supplemental material). To overcome collinearity or mul-ticollinearity, principal component logistic regression (PCLR) was per-formed to evaluate the performances of the models built with each selected variable set that had collinearity or multicollinearity. For per-forming PCLR, principal component analysis (PCA) was done using Prcomp in R to generate an eigenvector and score matrix, which were used for logistic regression using glm.fit in R. For variable sets that did not have collinearity or multicollinearity, logistic regression was done using glm.fit in R. The PCLR and logistic regression models are described in detail in the supplemental material. To compare the AUCs between the models, paired permutation tests were performed (25,26), with a Bonferroni-corrected significance level of 0.0025 for multiple comparisons.
Practicable and accurate correlates of protection.For further perfor-mance evaluation as a COP, PCLR models with multiple variables that had multicollinearity, and logistic models with one variable or two vari-ables that did not have collinearity, were built on the original unimputed data set. PCLR and logistic regressions were performed with the original unimputed data set by glm.fit in R or proc logistic in SAS. To compare the prediction accuracy of the logistic regression models that were built with different variables but on the same original data set, the Roccontrast state-ment in proc logistic in SAS was used to perform dependent AUC com-parisons. To compare the prediction accuracy of the PCLR models with that of the logistic regression models, with both built on the same original data set, paired permutation tests (25,26) were performed.
RESULTS
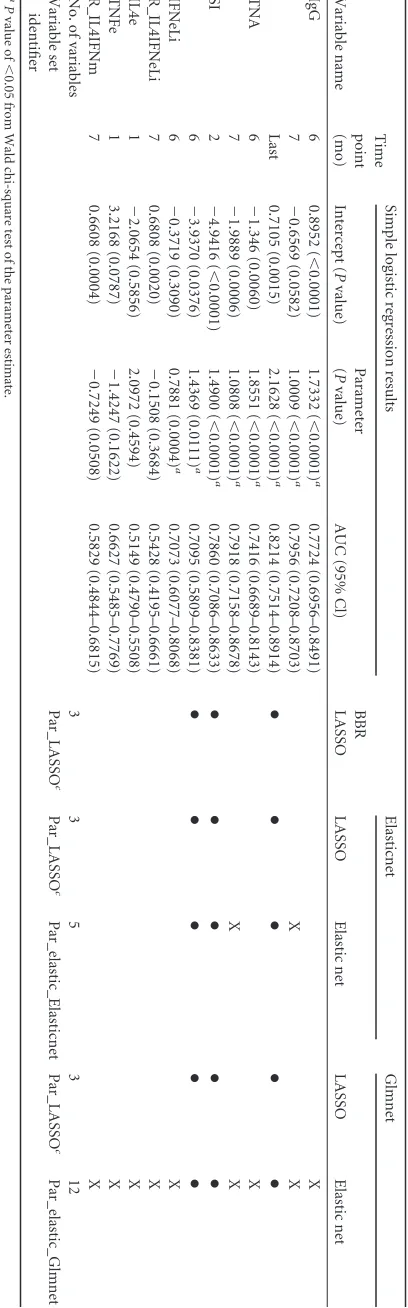
Variable selection by logistic regression penalized by LASSO or elastic net.Parsimonious variable selections are summarized in
Table 3. Additionally, optimal variable selections were performed
with Glmnet (18), Elasticnet (19), the R package Pensim (20), and
BBR (21) by choosing the minimum cross-validation error or the
maximum cross-validated likelihood, thus minimizing prediction error (see Table S7 in the supplemental material). Additional de-tails for parsimonious and optimal variable selections are included in the supplemental material (see Tables S7 to S13 in the supple-mental material). The three variables last anti-PA IgG and SI at months 2 (SI_2) and 6 (SI_6) were selected by all the methods. Among these packages, all the parsimonious variable selections by LASSO (Par_LASSO) chose only these three variables. Parsimoni-ous selection by elastic net with the Elasticnet package (Par_ elastic_Elasticnet) additionally selected both anti-PA IgG and TNA at month 7 (peak). Parsimonious selection by elastic net with the Glmnet package (Par_elastic_Glmnet) further selected IL4e and TNFe at month 1, anti-PA IgG, TNA, and IFNeLi at month 6, and R_IL4IFNeLi and R_IL4IFNm at month 7. The optimal selec-tions chose additional variables IL4eLi at month 1, IL1Be at month 2, IL1Be, TNFe, and R_IL4IFNeLi at month 6, IL1Bm and IL4eLi at month 7, and IL4eLi and R_IL4IFNeLi at the last time point (see Table S7).
Simple logistic regression with each of the selected variables
showed statistically significant (P⬍ 0.05) positive correlations
between survival and anti-PA IgG at months 6 and 7 (peak), as well as at the last time point, TNA at months 6 and 7, SI at months
2 and 6, and IFN-␥-secreting cell frequency at month 6 (Table 3).
The ratio of the IL-4 to IFN-␥ mRNA levels (R_IL4IFNm) at
on August 17, 2020 by guest
http://cvi.asm.org/
month 6, which was chosen only in the optimal selections, also had a statistically significant correlation with survival (see Table S7 in the supplemental material).
Evaluation of survival prediction models with selected sets of variables.The selected variable sets were used to build regression models to test their survival prediction performance. The PCLR models were built with variable sets that had multicollinearity. Logistic regression was applied to the three-variable set (Par_LASSO) that did not have multicollinearity. When the models with the three parsimonious variable sets Par_LASSO, Par_elastic_Elastic-net, and Par_elastic_Glmnet were applied to the imputed data sets, the mean AUCs were 0.8492, 0.8494, and 0.9022, respectively (Table 4; see also Table S14 in the supplemental material). There-fore, the model with variable set Par_LASSO was the most parsi-monious among the three. However, this model was limited by the fact that in the unimputed original data, there were 71 out of 137 animals (51.82%) that did not have an SI measurement at month 6. Using the variable SI at month 6 to predict survival with the unimputed data will therefore have low statistical power and may create bias. To test the impact of deleting SI at month 6 on the model performance, a model with SI at month 6 excluded from Par_LASSO was applied to the 20 imputed data sets, and its per-formance was compared with that of other models. This model had an AUC of 0.8409, which is not statistically significantly dif-ferent from that of the model with variable set Par_LASSO, sug-gesting that SI at month 6 did not play a significant role in model
performance (Table 4; see also Table S14 in the supplemental
ma-terial). Therefore, SI at month 6 was excluded in further evalua-tions.
All together, the model with last anti-PA IgG and SI at month 2 was the most parsimonious. Together with their low missing rates in the unimputed data set, these two variables are worthy of con-sideration in the generation of practicable prediction models.
Practicable and accurate correlates of protection.The last anti-PA IgG measurement concurrent with aerosol exposure was consistently selected by all the variable selection methods. For situa-tions where a preexposure sample was not available, however, the peak measurement was found to be the best practicable alternative for predicting protection against future exposure. The peak response variables were therefore included in the regression model evaluations. TNA was statistically significantly correlated with survival but did not provide the same good level of accuracy as anti-PA IgG.
TABLE 3 Summary of parsimonious variable selections b Variable name Time point (mo) Simple logistic regression results BBR LASSO Elasticnet Glmnet Intercept ( P value) Parameter ( P value) AUC (95% Cl) LASSO Elastic net LASSO Elastic net IgG 6 0.8952 ( ⬍ 0.0001) 1.7332 ( ⬍ 0.0001) a 0.7724 (0.6956–0.8491) X 7 ⫺ 0.6569 (0.0582) 1.0009 ( ⬍ 0.0001) a 0.7956 (0.7208–0.8703) X X Last 0.7105 (0.0015) 2.1628 ( ⬍ 0.0001) a 0.8214 (0.7514–0.8914) ●●● ●● TNA 6 ⫺ 1.346 (0.0060) 1.8551 ( ⬍ 0.0001) a 0.7416 (0.6689–0.8143) X 7 ⫺ 1.9889 (0.0006) 1.0808 ( ⬍ 0.0001) a 0.7918 (0.7158–0.8678) X X SI 2 ⫺ 4.9416 ( ⬍ 0.0001) 1.4900 ( ⬍ 0.0001) a 0.7860 (0.7086–0.8633) ●●● ●● 6 ⫺ 3.9370 (0.0376) 1.4369 (0.0111) a 0.7095 (0.5809–0.8381) ●●● ●● IFNeLi 6 ⫺ 0.3719 (0.3090) 0.7881 (0.0004) a 0.7073 (0.6077–0.8068) X R_IL4IFNeLi 7 0.6808 (0.0020) ⫺ 0.1508 (0.3684) 0.5428 (0.4195–0.6661) X IL4e 1 ⫺ 2.0654 (0.5856) 2.0972 (0.4594) 0.5149 (0.4790–0.5508) X TNFe 1 3.2168 (0.0787) ⫺ 1.4247 (0.1622) 0.6627 (0.5485–0.7769) X R_IL4IFNm 7 0.6608 (0.0004) ⫺ 0.7249 (0.0508) 0.5829 (0.4844–0.6815) X No. of variables 335 31 2 Variable set identifier Par_LASSO c Par_LASSO c Par_elastic_Elasticnet Par_LASSO c Par_elastic_Glmnet a P value of ⬍ 0.05 from Wald chi-square test of the parameter estimate. b ● ,variables that were selected by all five selection methods. X, variables that were selected by 1 or 2 methods. c Parsimonious selections by LASSO in all the packages selected the same variables that were considered one variable set, Par_LASSO, for subsequent an alyses.
TABLE 4Summary of performance of PCLR and logistic regression
models containing parsimoniously selected variables
Regressiona Variable set identifier
No. of variables Mean AUC Paired multiple comparisonsb
PCLR Par_elastic_Elasticnet 5 0.8494 NS Par_elastic_Glmnet 12 0.9022 S
Logistic regression
Par_LASSOc 3 0.8492 NS
Last anti-PA IgG⫹SI_2 2 0.8409 Reference model aPCLR or logistic regression was performed for each selected variable set with the
imputed data sets.
bMultiple comparisons of AUCs between a model and the model with the variables last
anti-PA IgG and SI_2 were performed by a paired permutation test with a Bonferroni-corrected significance level of 0.0025; NS,P⬎0.0025; S,Pⱕ0.0025.
c
Parsimonious selections by LASSO in all the packages selected the same variables that were considered one variable set, Par_LASSO.
on August 17, 2020 by guest
http://cvi.asm.org/
However, TNA is considered to be species neutral since it does not rely on a species-specific conjugate antibody, allowing a direct comparison in the same assay of serum antibody functional activ-ity across animal species and genera. TNA features prominently in the literature as an immunological bridge to extrapolate data in animals in order to predict anthrax vaccine effectiveness in
hu-mans (4,27). Furthermore, anti-PA IgG and TNA levels in NHP
were highly correlated (15), and corresponding data in humans
are available (12,13,15). Similar to peak anti-PA IgG, peak TNA
was included in the regression model evaluations as a potential alternative to last anti-PA IgG.
Consequently, the parsimonious variable selection was ex-panded to include the following five variables: last anti-PA IgG, last TNA, peak anti-PA IgG, peak TNA, and SI at month 2. These variables were evaluated both singly and in combinations in re-gression models of predicted survival probability in NHP. A linearity or multicollinearity diagnosis was used to detect
col-linearity or multicolcol-linearity and generate the combinations of these variables for the models. Multicollinearity was present in all the variable combinations composed of three or more variables. Among the two-variable combinations, collinearity was not pres-ent between SI at month 2 and any of the other four variables, nor between last TNA and peak anti-PA IgG or peak TNA (data not shown). Last anti-PA IgG had only mild collinearity with peak TNA (variance inflation factor [VIF], 2.57; tolerance, 0.39 [the cutoff value is 2.5 for VIF and 0.4 for tolerance]; details are in the supplemental methods and references 12 and 13 in the supple-mental material) and peak anti-PA IgG (VIF, 2.68; tolerance, 0.37)
(28,29). Because PCLR can be done only with more than three
variables, the two-variable logistic regression models containing either last anti-PA IgG and peak TNA or last anti-PA IgG and peak anti-PA IgG were fitted. A PCLR model containing all five vari-ables or the Par_elastic_Elasticnet variable set except SI at month 6 was fitted for comparison with the single-variable and
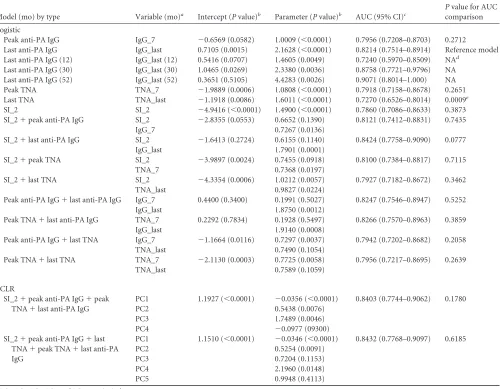
two-TABLE 5Statistics of regression models for survival predictions
Model (mo) by type Variable (mo)a Intercept (Pvalue)b Parameter (Pvalue)b AUC (95% CI)c
Pvalue for AUC comparison
Logistic
Peak anti-PA IgG IgG_7 ⫺0.6569 (0.0582) 1.0009 (⬍0.0001) 0.7956 (0.7208–0.8703) 0.2712 Last anti-PA IgG IgG_last 0.7105 (0.0015) 2.1628 (⬍0.0001) 0.8214 (0.7514–0.8914) Reference model Last anti-PA IgG (12) IgG_last (12) 0.5416 (0.0707) 1.4605 (0.0049) 0.7240 (0.5970–0.8509) NAd
Last anti-PA IgG (30) IgG_last (30) 1.0465 (0.0269) 2.3380 (0.0036) 0.8758 (0.7721–0.9796) NA Last anti-PA IgG (52) IgG_last (52) 0.3651 (0.5105) 4.4283 (0.0026) 0.9071 (0.8014–1.000) NA Peak TNA TNA_7 ⫺1.9889 (0.0006) 1.0808 (⬍0.0001) 0.7918 (0.7158–0.8678) 0.2651 Last TNA TNA_last ⫺1.1918 (0.0086) 1.6011 (⬍0.0001) 0.7270 (0.6526–0.8014) 0.0009e
SI_2 SI_2 ⫺4.9416 (⬍0.0001) 1.4900 (⬍0.0001) 0.7860 (0.7086–0.8633) 0.3873 SI_2⫹peak anti-PA IgG SI_2 ⫺2.8355 (0.0553) 0.6652 (0.1390) 0.8121 (0.7412–0.8831) 0.7435
IgG_7 0.7267 (0.0136)
SI_2⫹last anti-PA IgG SI_2 ⫺1.6413 (0.2724) 0.6155 (0.1140) 0.8424 (0.7758–0.9090) 0.0777
IgG_last 1.7901 (0.0001)
SI_2⫹peak TNA SI_2 ⫺3.9897 (0.0024) 0.7455 (0.0918) 0.8100 (0.7384–0.8817) 0.7115
TNA_7 0.7368 (0.0197)
SI_2⫹last TNA SI_2 ⫺4.3354 (0.0006) 1.0212 (0.0057) 0.7927 (0.7182–0.8672) 0.3462
TNA_last 0.9827 (0.0224)
Peak anti-PA IgG⫹last anti-PA IgG IgG_7 0.4400 (0.3400) 0.1991 (0.5027) 0.8247 (0.7546–0.8947) 0.5252
IgG_last 1.8750 (0.0012)
Peak TNA⫹last anti-PA IgG TNA_7 0.2292 (0.7834) 0.1928 (0.5497) 0.8266 (0.7570–0.8963) 0.3859
IgG_last 1.9140 (0.0008)
Peak anti-PA IgG⫹last TNA IgG_7 ⫺1.1664 (0.0116) 0.7297 (0.0037) 0.7942 (0.7202–0.8682) 0.2058
TNA_last 0.7490 (0.1054)
Peak TNA⫹last TNA TNA_7 ⫺2.1130 (0.0003) 0.7725 (0.0058) 0.7956 (0.7217–0.8695) 0.2639
TNA_last 0.7589 (0.1059)
PCLR
SI_2⫹peak anti-PA IgG⫹peak TNA⫹last anti-PA IgG
PC1 1.1927 (⬍0.0001) ⫺0.0356 (⬍0.0001) 0.8403 (0.7744–0.9062) 0.1780
PC2 0.5438 (0.0076)
PC3 1.7489 (0.0046)
PC4 ⫺0.0977 (09300)
SI_2⫹peak anti-PA IgG⫹last TNA⫹peak TNA⫹last anti-PA IgG
PC1 1.1510 (⬍0.0001) ⫺0.0346 (⬍0.0001) 0.8432 (0.7768–0.9097) 0.6185
PC2 0.5254 (0.0091)
PC3 0.7204 (0.1153)
PC4 2.1960 (0.0148)
PC5 0.9948 (0.4113)
a
PC1, PC2, PC3, PC4, and PC5 are principal components.
bIntercept and parameter values are for the logistic regression for the indicated variable or component. Note that models with multiple variables have only a single intercept. c
AUC is given as a measure of model accuracy.
dNA, not applicable, due to dependent ROC curve comparisons being performed in this analysis, and thus ROC curve comparisons here should be within exactly the same sample. e
Pvalue with a significance level of⬍0.05 for AUC comparison with that of the logistic regression model with last anti-PA IgG only.
on August 17, 2020 by guest
http://cvi.asm.org/
variable logistic regression models (Table 5). The variable set Par_elastic_Glmnet that contains 12 variables was not examined at this step, due to the high frequency of missing data within some of these variables in the original unimputed data set.
Of the single-variable models (Table 5), last anti-PA IgG had
the highest AUC (0.8214; 95% confidence interval [CI], 0.7514 to 0.8914), peak anti-PA IgG, peak TNA, and SI at month 2 had lower but not statistically significantly lower AUCs (0.7956, 95% CI, 0.7208 to 0.8703; 0.7918, 95% CI, 0.7158 to 0.8678; and 0.7860, 95% CI, 0.7086 to 0.8633, respectively), and last TNA had statistically significantly lower AUC (0.7270; 95% CI, 0.6526 to 0.8014). Logistic regression using last anti-PA IgG at specific chal-lenge times generated different parameter estimates but similar
significantPvalues compared with those for overall last anti-PA
IgG (Table 5). The different parameter estimates were due to
dif-ferences in the magnitude of the anti-PA IgG responses at these time points. Last anti-PA IgG had a parameter estimate of 2.1628 (Table 5), indicating that a 1-log10unit (10-fold) increase in last anti-PA IgG can make an 8.70-fold increase in the odds of survival (probability of survival/probability of death). The logistic
regres-sion model for last anti-PA IgG is shown inFig. 1.
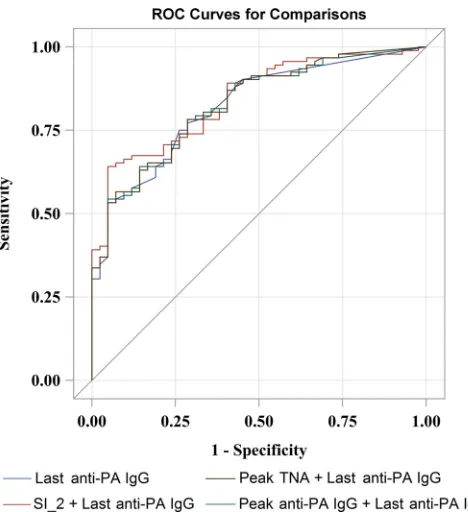
In each two-variable model, there was always one variable with
a nonsignificant parameter estimate (Table 5). The 2 two-variable
models that contain last anti-PA IgG had AUCs of 0.8247 (95% CI, 0.7546 to 0.8947) and 0.8266 (95% CI, 0.7570 to 0.8963), which were very close to the AUC of the model with last anti-PA IgG only. The model with SI_2 and last anti-PA IgG had an AUC of 0.8424 (95% CI, 0.7758 to 0.9090), the highest accuracy of all
the one-variable and two-variable models (Table 5). The PCLR
model containing all five variables had an AUC of 0.8432 (95% CI, 0.7768 to 0.9097), and the PCLR model containing the
Par_elas-tic_Elasticnet variable set not including SI at month 6 had an AUC of 0.8403 (95% CI, 0.7744 to 0.9062). Permutation tests showed that compared with the single-variable model containing last anti-PA IgG, only the single-variable model containing last TNA had a statistically significantly lower AUC (0.7270; 95%
CI, 0.6526 to 0.8014;P⫽0.0009) (Table 5). The ROC curves
for the two-variable models that had a higher AUC than that of the last anti-PA IgG model roughly overlap the ROC curve of
the last anti-PA IgG model (Fig. 2).
Overall, anti-PA IgG at the last time point and SI at months 2 and 6 were the three best correlates of protection in rhesus macaques. Of these, the single-variable last anti-PA IgG model had the highest prediction accuracy in this genus and thus is the most appropriate single-variable model for survival
predic-tions (Table 5).
DISCUSSION
Anti-PA antibody levels have been an accepted serological indica-tor for protection against anthrax since acellular vaccines for
hu-man use were first developed (1, 30–34). More recently, serum
TNA has been the focal point for correlates of protection in animal
models and estimates of survival probability in humans (4,27,35).
Despite this focus, there has been no systematic evaluation of the relationship between PA-stimulated humoral and cell-mediated immune responses, their relative contributions to protection, or their comparative importance when used singly or in combina-tion to predict the probability of survival.
We applied a comprehensive strategy using logistic regression penalized by LASSO or elastic net in four different software appli-cations with dissimilar algorithms, methods, and criteria for pen-alty parameter tuning. The strategy selected the optimal and
par-FIG 1Logistic regression of last anti-PA IgG concentration versus survival. NHP survivors () (1.0 on theyaxis) and nonsurvivors (Œ) (0 on theyaxis) are
plotted with a slight verticalyaxis displacement so that overlapping points may be seen. The logistic regression line (orange line) is the predicted survival based on the NHP last anti-PA IgG (g/ml) measurements.
on August 17, 2020 by guest
http://cvi.asm.org/
simonious COP variable combinations and time points that correlated with survival.
The two statistical approaches of LASSO and elastic net were applied because LASSO may perform shrinkage too stringently, and the resulting prediction model may exclude important pre-dictors. Alternatively, elastic net may be too lenient in its variable selection, with subsequent overfitting in the prediction model, and consequently, variations within the sample may be disproptionately interpreted as variations in the study population. In or-der to avoid overfitting of the prediction model, parsimonious sets of variables were derived. The selected variables were then evalu-ated for correlation with survival. Models without collinearity or multicollinearity issues were evaluated using logistic regression, and models containing variables with multicollinearity were eval-uated by PCLR. The AUC was used as the criterion for testing the accuracy of the prediction model. The AUC measures the ability of the model to correctly identify the survival status. AUCs between 0.90 and 1, 0.80 and 0.90, 0.70 and 0.80, and 0.50 and 0.70 repre-sent high, good, moderate, and low discrimination performance
of the model, respectively (36). This comprehensive approach
uti-lized all the available information from the study to select the most plausible and practicable COP for AVA-vaccinated rhesus ma-caques.
Statistically significant positive correlations with survival were identified for anti-PA IgG at months 6 and 7 and the last time point before infectious challenge (last), for TNA at months 6 and
7 (peak), SI at months 2 and 6, and the frequency of IFN-␥
-secret-ing cells at month 6. The ratio of IL-4 mRNA to IFN-␥mRNA
transcription levels at month 6 had a statistically significant neg-ative correlation with survival. The different software applications consistently selected anti-PA IgG responses at challenge (last) and
SI at months 2 and 6, thus confirming their importance as im-mune correlates of protection in rhesus macaques. The frequency of missing data for SI at month 6 was 71 out of 137 (51.82%), causing potential issues of bias and low statistical power. Deleting SI at month 6 from Par_LASSO did not lower the prediction ac-curacy much. The suitable variables were then used in logistic regression models for survival predictions. Although their perfor-mance in the analysis was lower, the peak and last TNA responses were also included in the models, primarily due to their positive correlation with survival and the cross-species utility of TNA for predicting survival probabilities in humans. Therefore, the final selected single-correlate variables were peak anti-PA IgG, peak TNA, last anti-PA IgG, last TNA, and SI at month 2. The final dual-correlate variables were combinations of peak anti-PA IgG, last anti-PA IgG, peak TNA, last TNA, and SI at month 2.
The single-correlate logistic regression models using peak TNA and peak anti-PA IgG responses described the immune status on completion of the 3-i.m. priming series and were valid predictors of survival at later time points. The model with only last anti-PA IgG had good predictive accuracy (AUC, 0.8214; 95% CI, 0.7514 to 0.8914). The predictive accuracy of last TNA was moderate, with an AUC of 0.7270 (95% CI, 0.6526 to 0.8014), which was
statistically significantly less than the last anti-PA IgG AUC (P⫽
0.0009). This difference is likely due to the lower analytical sensi-tivity of the TNA assay. At the last time point, there were 104 values that were above the limit of detection (LOD) of the anti-PA IgG assay but only 69 that were above the LOD of the TNA assay. Peak anti-PA IgG, peak TNA, and SI at month 2 were moderately
accurate predictors of survival, with an AUC of⬎0.78.
In the ducorrelate logistic regression models, there was al-ways one parameter estimate that was not statistically significant, indicating that it was not making a significant contribution to the predictive power of the model. Compared with the single-corre-late model with last anti-PA IgG only, the predictive accuracy was slightly improved but not statistically significantly different using the dual-correlate models containing last anti-PA IgG or PCLR models containing all five variables or the Par_elastic_Elasticnet variable set except SI at month 6, and it was slightly decreased but not statistically significantly different using all other dual-corre-late models. Given the lower technical complexity, higher sample stability, and higher throughput of an enzyme-linked immu-nosorbent assay (ELISA) than those of a lymphocyte proliferation assay, together with the ability to accurately calibrate ELISA
stan-dards and quantify the IgG analyte for each species (15,37), these
data confirm that last anti-PA IgG provides an appropriate
corre-late of protection for cross-species survival predictions (4).
Fay et al. (4) noted in their cross-species meta-analysis that
vaccine formulation plays a statistically significant role in the quantitative assessment of correlates of protection. In the AVRP study, both the NHP and human cohorts were treated with AVA in experiments designed to match the schedule and time of mea-surement as closely as possible. The quantitative model generated from the AVRP NHP data therefore should be used only to bridge to data from human cohorts tested with the same vaccine sched-ule. The anti-PA IgG concentration at the time of challenge should be a suitable correlate for other PA-based vaccines, although any cross-species bridging should be based on data from clinical and nonclinical studies with matching vaccine formulations, sched-ules, and times of measurement. Anthrax vaccines that do not rely
FIG 2Comparisons of ROC curves among logistic regression models. The
ROC curves were from logistic regressions containing the single variable last anti-PA IgG and two variables with combinations of SI_2, last anti-PA IgG, and peak anti-PA IgG and TNA.
on August 17, 2020 by guest
http://cvi.asm.org/
on PA as the primary immunogen may require further study to identify the most suitable correlates.
The anti-PA IgG levels at the time of challenge (last) were the most accurate single measure for determining the probability of survival against inhalation anthrax in rhesus macaques complet-ing a 3-i.m. primcomplet-ing series of AVA. The SI responses at months 2 and 6 and peak anti-PA IgG and TNA were also strong correlates of protection for rhesus macaques. These single correlates of pro-tection were selected from 80 assay and 2 study variables. None of the multivariable models evaluated were statistically significantly better than the single-correlate last anti-PA IgG model. In the absence of a last anti-PA IgG measurement concurrent with aero-sol exposure, the month-7 anti-PA IgG and TNA responses to 3-i.m. priming are suitable alternative correlates of protection.
ACKNOWLEDGMENTS
The findings and conclusions in this report are those of the authors and do not necessarily represent the official position of the Centers for Disease Control and Prevention.
We thank David Madigan from Columbia University and Nong Shang from the Centers for Disease Control and Prevention for their critical comments and constructive advice.
This study was funded through the Centers for Disease Control and Prevention (Atlanta, GA) with additional support from the Biomedical Advanced Research and Development Authority (BARDA) (Washington, DC). Battelle was funded under DHHS CDC contract 200-2000-10065. L.C. and S.D. were funded by the Atlanta Research and Education Foun-dation (AREF) through the Department of Veterans Affairs, Veterans Health Administration, Office of Research and Development (Atlanta, GA).
REFERENCES
1.Saile E, Quinn CP.2010. Anthrax vaccines, p 269 –293.InBergman NH
(ed),Bacillus anthracisand anthrax. Wiley-Blackwell, Hoboken, NJ.
2.Bienek DR, Loomis LJ, Biagini RE.2009. The anthrax vaccine: no new
tricks for an old dog. Hum. Vaccin.5:184 –189.http://dx.doi.org/10.4161 /hv.5.3.7308.
3.Gronvall GK, Trent D, Borio L, Brey R, Nagao L, Alliance for
Biosecu-rity.2007. The FDA animal efficacy rule and biodefense. Nat. Biotechnol.
25:1084 –1087.http://dx.doi.org/10.1038/nbt1007-1084.
4.Fay MP, Follmann DA, Lynn F, Schiffer JM, Stark GV, Kohberger R,
Quinn CP, Nuzum EO.2012. Anthrax vaccine-induced antibodies
pro-vide cross-species prediction of survival to aerosol challenge. Sci. Transl. Med.4:151ra126.http://dx.doi.org/10.1126/scitranslmed.3004073.
5.McBride BW, Mogg A, Telfer JL, Lever MS, Miller J, Turnbull PC, Baillie
L.1998. Protective efficacy of a recombinant protective antigen against Bacil-lus anthracischallenge and assessment of immunological markers. Vaccine 16:810 – 817.http://dx.doi.org/10.1016/S0264-410X(97)00268-5.
6.Livingston BD, Little SF, Luxembourg A, Ellefsen B, Hannaman D.
2010. Comparative performance of a licensed anthrax vaccine versus elec-troporation based delivery of a PA encoding DNA vaccine in rhesus ma-caques. Vaccine28:1056 –1061.http://dx.doi.org/10.1016/j.vaccine.2009 .10.111.
7.Turnbull PC, Broster MG, Carman JA, Manchee RJ, Melling J.1986.
Development of antibodies to protective antigen and lethal factor compo-nents of anthrax toxin in humans and guinea pigs and their relevance to protective immunity. Infect. Immun.52:356 –363.
8.Turnbull PC, Leppla SH, Broster MG, Quinn CP, Melling J. 1988.
Antibodies to anthrax toxin in humans and guinea pigs and their relevance to protective immunity. Med. Microbiol. Immunol.177:293–303.
9.Keitel WA, Treanor JJ, El Sahly HM, Evans TG, Kopper S, Whitlow V,
Selinsky C, Kaslow DC, Rolland A, Smith LR, Lalor PA.2009.
Evalua-tion of a plasmid DNA-based anthrax vaccine in rabbits, nonhuman pri-mates and healthy adults. Hum. Vaccin.5:536 –544.http://dx.doi.org/10 .4161/hv.5.8.8725.
10. Luxembourg A, Hannaman D, Nolan E, Ellefsen B, Nakamura G, Chau
L, Tellez O, Little S, Bernard R.2008. Potentiation of an anthrax DNA
vaccine with electroporation. Vaccine26:5216 –5222.http://dx.doi.org/10 .1016/j.vaccine.2008.03.064.
11. Brachman PS, Gold H, Plotkin SA, Fekety FK, Werrin M, Ingraham
NR. 1962. Field evaluation of human anthrax vaccine. Am. J. Public Health Nations Health52:632– 645.http://dx.doi.org/10.2105/AJPH.52.4 .632.
12. Marano N, Plikaytis BD, Martin SW, Rose C, Semenova VA, Martin
SK, Freeman AE, Li H, Mulligan MJ, Parker SD, Babcock J, Keitel W, El Sahly H, Poland GA, Jacobson RM, Keyserling HL, Soroka SD, Fox SP, Stamper JL, McNeil MM, Perkins BA, Messonnier N, Quinn CP,
Anthrax Vaccine Research Program Working Group.2008. Effects of a
reduced dose schedule and intramuscular administration of anthrax vac-cine adsorbed on immunogenicity and safety at 7 months: a randomized trial. JAMA300:1532–1543.http://dx.doi.org/10.1001/jama.300.13.1532.
13. Wright JG, Plikaytis BD, Rose CE, Parker SD, Babcock J, Keitel W, El
Sahly H, Poland GA, Jacobson RM, Keyserling HL, Semenova VA, Li H, Schiffer J, Dababneh H, Martin SK, Martin SW, Marano N, Messonier
NE, Quinn CP.2014. Non-inferiority and safety of reduced schedules and
intramuscular injection of anthrax vaccine adsorbed (AVA). Vaccine32: 1019 –1028.http://dx.doi.org/10.1016/j.vaccine.2013.10.039.
14. Institute of Medicine (US) Committee to Review the CDC Anthrax
Vaccine Safety and Efficacy Research Program.2002. An assessment of
the CDC anthrax vaccine safety and efficacy research program. National Academies Press, Washington, DC.
15. Quinn CP, Sabourin CL, Niemuth NA, Li H, Semenova VA, Rudge TL,
Mayfield HJ, Schiffer J, Mittler RS, Ibegbu CC, Wrammert J, Ahmed R, Brys AM, Hunt RE, Levesque D, Estep JE, Barnewall RE, Robinson DM,
Plikaytis BD, Marano N, AVRP Laboratory Working Group.2012. A
three-dose intramuscular injection schedule of anthrax vaccine adsorbed generates sustained humoral and cellular immune responses to protective antigen and provides long-term protection against inhalation anthrax in rhesus macaques. Clin. Vaccine Immunol.19:1730 –1745.http://dx.doi .org/10.1128/CVI.00324-12.
16. Scola MP, Thompson SD, Brunner HI, Tsoras MK, Witte D, Van Dijk
MA, Grom AA, Passo MH, Glass DN. 2002. Interferon-gamma:
interleukin-4 ratios and associated type 1 cytokine expression in juvenile rheumatoid arthritis synovial tissue. J. Rheumatol.29:369 –378.
17. Shirai A, Conover J, Klinman DM.1995. Increased activation and
altered ratio of interferon-gamma:interleukin-4 secreting cells in MRL-lpr/lpr mice. Autoimmunity 21:107–116. http://dx.doi.org/10 .3109/08916939508993357.
18. Friedman J, Hastie T, Tibshirani R. 2010. Regularization paths for
generalized linear models via coordinate descent. J. Stat. Softw.33:1–22. http://dx.doi.org/10.1111/j.1467-9868.2005.00503.x.
19. Zou H, Hastie T. 2005. Regularization and variable selection via the
elastic net. J. R. Stat. Soc.67:301–320.http://dx.doi.org/10.1111/j.1467 -9868.2005.00503.x.
20. Waldron L, Pintilie M, Tsao MS, Shepherd FA, Huttenhower C, Jurisica
I.2011. Optimized application of penalized regression methods to diverse genomic data. Bioinformatics27:3399 –3406.http://dx.doi.org/10.1093 /bioinformatics/btr591.
21. Genkin A, Lewis DD, Madigan D.2007. Large-scale Bayesian logistic
regression for text categorization. Technometrics49:291–304.http://dx .doi.org/10.1198/004017007000000245.
22. Hastie T, Tibshirani R, Friedman J.2009. The elements of statistical
learning: data mining, inference, and prediction, 2nd ed. Springer-Verlag, New York, NY.
23. Heymans MW, van Buuren S, Knol DL, van Mechelen W, de Vet HCW.
2007. Variable selection under multiple imputation using the bootstrap in a prognostic study. BMC Med. Res. Methodol.7:33.http://dx.doi.org/10 .1186/1471-2288-7-33.
24. Austin PC, Tu JV.2004. Bootstrap methods for developing predictive
models. Am. Stat.58:131–137.http://dx.doi.org/10.1198/0003130043277.
25. Venkatraman ES.2000. A permutation test to compare receiver operating
characteristic curves. Biometrics 56:1134 –1138. http://dx.doi.org/10 .1111/j.0006-341X.2000.01134.x.
26. Robin X, Turck N, Hainard A, Tiberti N, Lisacek F, Sanchez JC, Müller
M.2011. pROC: an open-source package for R and S⫹to analyze and compare ROC curves. BMC Bioinformatics12:77.http://dx.doi.org/10 .1186/1471-2105-12-77.
27. Ionin B, Hopkins RJ, Pleune B, Sivko GS, Reid FM, Clement KH,
Rudge TL, Jr, Stark GV, Innes A, Sari S, Guina T, Howard C, Smith J, Swoboda ML, Vert-Wong E, Johnson V, Nabors GS, Skiadopoulos MH.
on August 17, 2020 by guest
http://cvi.asm.org/
2013. Evaluation of immunogenicity and efficacy of anthrax vaccine ad-sorbed for postexposure prophylaxis. Clin. Vaccine Immunol.20:1016 – 1026.http://dx.doi.org/10.1128/CVI.00099-13.
28. Allison PD.1999. Multiple regression: a primer. Pine Forge Press,
Thou-sand Oaks, CA.
29. Belsley DA, Kuh K, Welsch RE.1980. Regression diagnostics:
iden-tifying influential data and sources of collinearity. John Wiley & Sons, New York, NY.
30. Thorne CB, Belton FC.1957. An agar-diffusion method for titrating
Bacillus anthracisimmunizing antigen and its application to a study of antigen production. J. Gen. Microbiol.17:505–516.http://dx.doi.org/10 .1099/00221287-17-2-505.
31. Little SF, Webster WM, Ivins BE, Fellows PF, Norris SL, Andrews GP.
2004. Development of anin vitro-based potency assay for anthrax vaccine. Vaccine22:2843–2852.http://dx.doi.org/10.1016/j.vaccine.2003.12.027.
32. Pitt ML, Little SF, Ivins BE, Fellows P, Barth J, Hewetson J, Gibbs P,
Dertzbaugh M, Friedlander AM.2001.In vitrocorrelate of immunity in
a rabbit model of inhalational anthrax. Vaccine19:4768 – 4773.http://dx .doi.org/10.1016/S0264-410X(01)00234-1.
33. Reuveny A, White MD, Adar YY, Kafri Y, Altboum YZ, Gozes Y,
Kobiler D, Shafferman A, Velan B.2001. Search for correlates of
protec-tive immunity conferred by anthrax vaccine. Infect. Immun.69:2888 – 2893.http://dx.doi.org/10.1128/IAI.69.5.2888-2893.2001.
34. Pittman PR, Gibbs PH, Cannon TL, Friedlander AM.2002. Anthrax
vaccine: short-term safety experience in humans. Vaccine20:972–978. http://dx.doi.org/10.1016/S0264-410X(01)00387-5.
35. Pittman PR, Fisher D, Quinn X, Schmader T, Barrera-Oro JG.2013.
Effect of delayed anthrax vaccine dose onBacillus anthracisprotective antigen IgG response and lethal toxin neutralization activity. Vaccine31: 5009 –5014.http://dx.doi.org/10.1016/j.vaccine.2013.08.086.
36. Swets JA.1988. Measuring the accuracy of diagnostic systems. Science
240:1285–1293.http://dx.doi.org/10.1126/science.3287615.
37. Semenova VA, Schiffer J, Steward-Clark E, Soroka S, Schmidt DS,
Brawner MM, Lyde F, Thompson R, Brown N, Foster L, Fox S, Patel N,
Freeman AE, Quinn CP.2012. Validation and long term performance
characteristics of a quantitative enzyme linked immunosorbent assay (ELISA) for human anti-PA IgG. J. Immunol. Methods376:97–107.http: //dx.doi.org/10.1016/j.jim.2011.12.002.