This thesis is presented for the degree of Doctor of Philosophy of The University of Western Australia
Modeling and Analysis of Cascading Failure in
Complex Power Networks
By
Hengdao Guo
Power And Clean Energy (PACE) Research Group School of Electrical, Electronic and Computer Engineering
2019
Supervisors:
Prof. Tyrone Fernando Prof. Herbert Ho-Ching Iu
I, Hengdao Guo, certify that:
This thesis has been substantially accomplished during enrollment in the degree.
This thesis does not contain material which has been accepted for the award of any other degree or diploma in my name, in any university or other tertiary institution.
No part of this work will, in the future, be used in a submission in my name, for any other degree or diploma in any university or other tertiary institution without the prior approval of The University of Western Australia and where applicable, any partner institution responsible for the joint-award of this degree.
This thesis does not contain any material previously published or written by another person, except where due reference has been made in the text.
The work is not in any way a violation or infringement of any copyright, trademark, patent, or other rights whatsoever of any person.
This thesis contains a number of published research articles, all of which have been co-authored.
This thesis is dedicated to extensive studies on cascading failure modeling and analysis of complex power systems. Novel models and analytical approaches have been proposed to better understand the complex mechanisms during the cascading failure.
To be specific, a novel Power System Dynamic (PSD)-based Cascading Failure Simulation Platform (CFSP) is proposed, which takes into consideration PSD, load models, relay models, and automatic load shedding mechanisms. The proposed PSD-based CFSP is tested using the IEEE 68-bus power system, and validated by studying the cascading failure propagation profile, which demonstrates great agreement with historical power system cascading failure patterns. The comparison between CFSP and a Complex Network (CN)-based cascading failure model has been conducted to vigorously study the impact of PSD. The failure propagation profiles of the two models match well for the slow cascade stage when PSD do not dominate the cascading process, but substantial di↵erence appears when large-scale failure starts, i.e., fast cascade stage. Moreover, the impact of varied transmission line capacity on blackout sizes is also investigated for both CN-based model and the proposed CFSP, with comparison presented and analyzed.
Moreover, a novel stochastic cascading failure model considering the interdependency between the cyber network and power network has been introduced. A multi-agent system and a novel protection relay model are incorporated into the proposed model. To apply the proposed analytical method, a test power system, IEEE 68-bus power system, is used to study the impacts of a range of interdependencies and cyber network topological structures on the cascading failure. Simulation results show the necessity and e↵ects of consideration of cyber communication network when investigating power system cascading failures. The study also provides useful information on robustness and vulnerability of a particular power grid, given di↵erent communication topologies and interdependencies.
The major original contributions reported in this thesis include:
Development of the mathematical models of PSD-based cascading failure simulator platform. Inverse definite minimum time-based relay models incorporated.
Introducing the cascading failure model that is easily modified and well trade-o↵ between the accuracy and efficiency.
Performing a multi-step attack strategy that could lead to cascading failures on the complex power system.
Analyzing the cascading failure through complex network theory considering interdependency between the cyber network and power network.
Multi-agent system incorporated into the cascading failure model.
A novel transmission line protection system is introduced based on the electric transmission line relays, where circuit breakers are placed at both ends of the line.
Since the complex power systems used in this thesis are with IEEE standard realistic configurations, the simulations are able to emulate the real-world cases, which makes the research project bear both academic and industrial values. The proposed models and analytical approaches allow network operators to make more sensible and timely decisions to mitigate the adverse e↵ects of cascading failures in power systems, and provide useful information for the robustness, vulnerability and economic aspects for complex power systems given various network conditions and topological features.
This thesis would not be able to finish without assistance of several people and the support from University of Western Australia and China Scholarship Council. I would like to acknowledge and thank those who helped me make this thesis possible.
Firstly, I would like to express my sincere gratitude to my supervisors Prof. Tyrone Fernando and Prof. Herbert Iu for their supports during my research project. Their professionality, perspicacity, and patience have provided technical, directional and spiritual assistance throughout my PhD research project.
Secondly, I would like to thank all the people in our Power And Clean Energy (PACE) research group for their kindly help and assistance, not only to my research, but also to my life.
Furthermore, I would like to appreciate my girlfriend, Ciyan Zheng for her endless love, unfailing encouragement. She accompanied me through the entire Ph.D study.
Finally, I would like to thank my parents for their unconditional love, support, and encouragement for the pursuit of my doctorate degree.
This thesis contains a part of the research articles that have been published during my PhD study since November 2016, which are rearranged and slightly modified to achieve high consistency and coherence in the content.
Details of work 1:
Hengdao Guo, Ciyan Zheng, Herbert Iu, Tyrone Fernando, “A critical review of cascading failure analysis and modeling of power system”, Renewable and Sustainable Energy Reviews, vol.80, pp.9-22, 2017.
Location in thesis: Chapter 2 Student contribution to work: 90%
Co-author signatures and dates: (only signatures of Professor Tyrone and Herbert, my PhD supervisors, are available upon the submission time)
Details of work 2:
Hengdao Guo, Samson Shenglong Yu, Tat Kei Chau, Tyrone Fernando, Herbert Ho-Ching Iu, and Ciyan Zheng. “A Power System Dynamics-Based Cascading Failure Simulation Platform for Power Networks”, IET Generation, Transmission & Distribution, submitted.
Location in thesis: Chapter 3 Student contribution to work: 80%
Co-author signatures and dates: (only signatures of Professor Tyrone and Herbert, my PhD supervisors, are available upon the submission time)
Details of work 3:
Hengdao Guo, Herbert Ho-Ching Iu, Tyrone Fernando, Ciyan Zheng, Xi Zhang, Chi K. Tse. “Cascading Failure Model Considering Multi-Step Attack Strategy” 2018 IEEE International
Symposium on Circuits and Systems (ISCAS), pp. 1-5, Italy, May 2018. Location in thesis: Chapter 4
Student contribution to work: 85%
Co-author signatures and dates: (only signatures of Professor Tyrone and Herbert, my PhD supervisors, are available upon the submission time)
TyroneFernando
Herbert
in
Complex Network Theory Analytical Approach to Power System Cascading Failure - From a
Cyber-Physical Perspective” Chaos: An Interdisciplinary Journal of Nonlinear Science, vol. 29, no. 5, 053111, May 2018.
Location in thesis: Chapter 5 Student contribution to work: 85%
Co-author signatures and dates: (only signatures of Professor Tyrone and Herbert, my PhD supervisors, are available upon the submission time)
Student signature: Hengdao Guo
Date:
Coordinating supervisor signature: Tyrone Fernando
Contents vii
List of Figures xi
List of Tables xiii
1 Introduction 1
1.1 Background . . . 1
1.2 Motivations . . . 3
1.3 Objectives and Contributions . . . 4
1.4 Thesis Outline . . . 4
2 Overview and Literature Review 5 2.1 Overview of Cascading Failure . . . 5
2.1.1 Causes . . . 5
2.1.2 Procedure . . . 6
2.1.3 Impact and Restoration . . . 8
2.1.4 Risk Assessment . . . 8
2.1.5 Dynamic Analysis . . . 8
2.1.6 Robustness and Vulnerability Analysis . . . 9
2.1.7 Mitigation and Prevention of Cascading Failure . . . 9
2.1.8 Grid Structural Improvement . . . 9
2.1.9 Independent Infrastructures . . . 9
2.1.10 Complex Network Perspective . . . 10
2.1.11 Other Features . . . 10
2.2 Literature Review of Cascading Failure Analysis Models and Methodologies . . . 11
2.2.1 Topological Models . . . 12
2.2.2 Stochastic Simulation Models . . . 14
2.2.3 High-level Statistical Models . . . 15
2.2.4 Dynamic Simulation Models . . . 16
2.2.5 Interdependent Models . . . 19
2.2.6 Other Models . . . 21
2.3 Interim Conclusion . . . 24
3 A Power System Dynamics-Based Cascading Failure Simulation Platform for Power Networks 25 3.1 Introduction . . . 25
3.2 Mathematical Model of Cascading Failures and Power System Dynamics . . . 28
3.2.1 Generator and Network Models . . . 28
3.2.2 Protection Relays . . . 30
3.2.3 Transmission Line Tripping Determination . . . 31
3.2.4 Generator Protection . . . 31
3.2.5 Automatic Emergency Load Shedding . . . 32
3.3 Model Validation . . . 35
3.3.1 Power System Dynamics and Relay Operations . . . 35
3.3.2 Automatic Load Shedding Mechanism . . . 37
3.3.3 Cascading Failure Propagation Profile Comparison with Historical Events . . . 37
3.4 Case Study . . . 39
3.4.1 Sensitivity Analysis . . . 39
3.4.2 Grid Robustness Analysis . . . 41
3.4.3 Cascading Failure Propagation Profile Comparison . . . 42
3.4.4 Impact of Load Modeling . . . 43
3.5 Interim Conclusion . . . 44
4 Cascading Failure Model Considering Multi-Step Attack Strategy 45 4.1 Introduction . . . 45
4.2 Comprehensive Mathematical Model For Cascading Failure . . . 46
4.2.1 Model Introduction . . . 46
4.2.2 Model Validation . . . 49
4.3 Proposed Attack Strategy And Case Study . . . 51
4.3.1 Robustness Index . . . 51
4.3.2 Proposed Attack Strategy . . . 52
4.4 Interim Conclusion . . . 53
5 A Complex Network Theory Analytical Approach to Power System Cascading Failure - From a Cyber-Physical Perspective 55 5.1 Introduction . . . 56
5.2 The Proposed Model . . . 59
5.2.1 Physical Power Network Model . . . 59
5.2.2 Cyber Network Model . . . 59
5.2.3 CPPS Interdependency . . . 60
5.2.4 Cascading Failure Mechanism in the Proposed Model . . . 60
5.2.5 State Transition During the Cascading Failure . . . 62
5.3 Case Study . . . 67
5.3.1 Test System Introduction . . . 67
5.3.2 Simulation Results . . . 70
5.3.3 Simulation Results Discussion . . . 77
5.4 Interim Conclusions . . . 77
6 Conclusions 79 6.1 Contribution of the Thesis . . . 79
6.2 Future Work . . . 80
2.1 The figure illustrates the non-locally propagation of cascading failure, with triggering events labeled . . . 7 2.2 The figure illustrates the topology of power networks. (a) IEEE 118-bus with
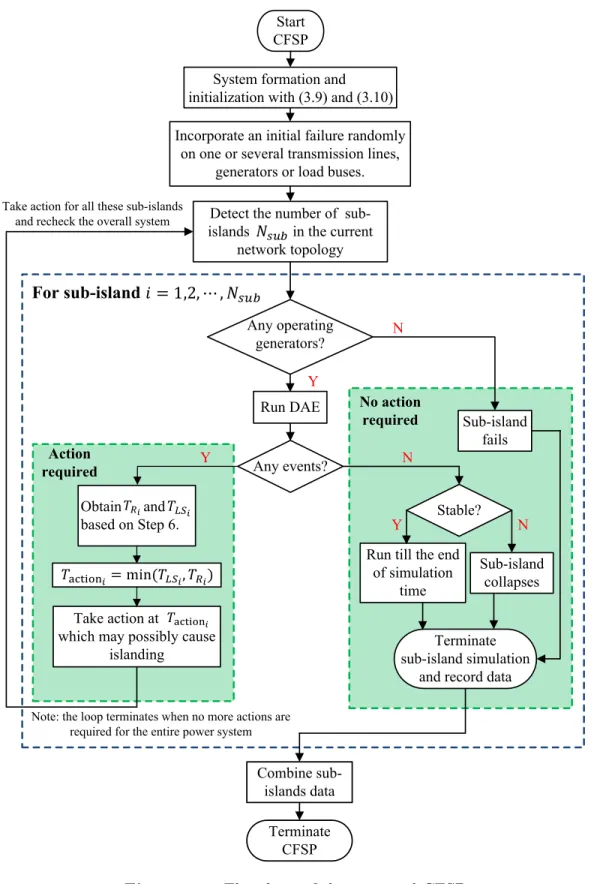
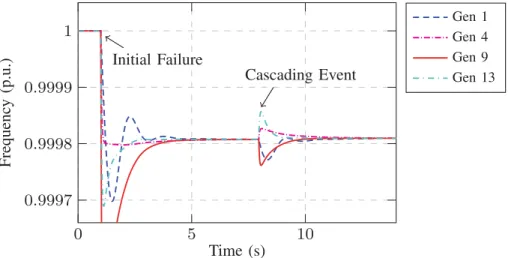
decentral-ized generator locations; (b) IEEE 118-bus with centraldecentral-ized generator locations. Red squares represent generators. . . 13 3.1 Flowchart of the proposed CFSP . . . 33 3.2 PSD validation with the proposed CFSP on generator frequency. Generator frequency
deviates from their nominal values each time failures occur. . . 36 3.3 PSD validation with the proposed CFSP on generator output voltages. Generator output
voltages deviate from their nominal values each time failures occur. . . 36 3.4 Load shedding validation with the proposed PSD-based CFSP. The voltage at bus 64
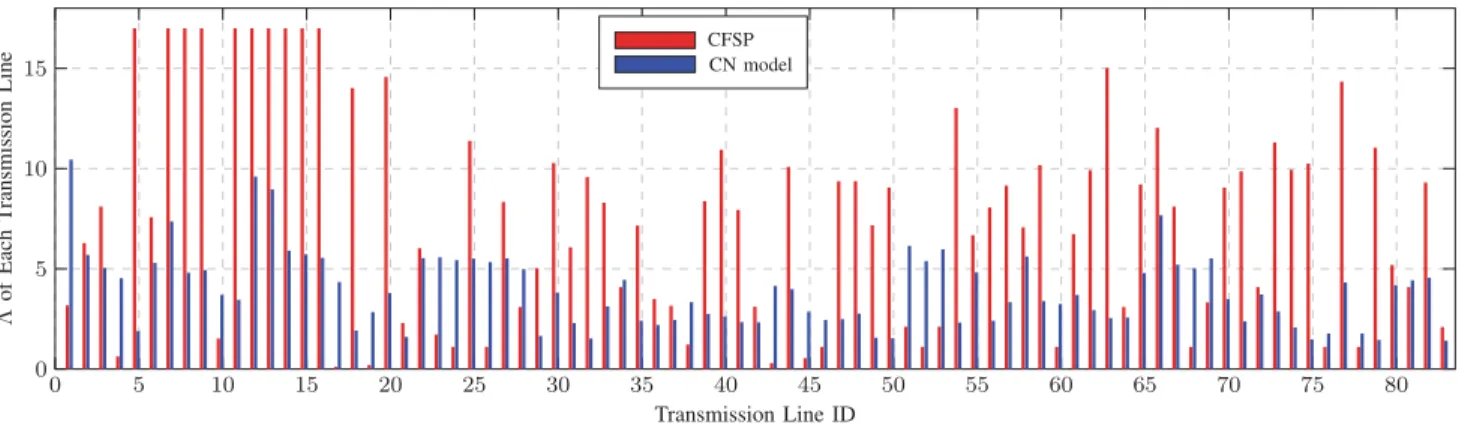
falls below 0.86p.u. at t= 24.52s, and the UVLS is activated 3.5slater at t= 28.02s. . 37 3.5 Historical data–2003 North America blackout propagation profile . . . 38 3.6 IEEE 68-Bus test system-initial failures of 4 cases are marked with 1,2,3 and 4 . . . . 39 3.7 Propagation profile validation with the proposed PSD-based CFSP . . . 39 3.8 Line Criticality Assessment using the proposed PSD-based CFSP and the conventional
CN-based model . . . 42 4.1 Cascading Failure Simulator Flowchart . . . 48 4.2 2003 North America Blackout Data. Cumulative number of tripped lines, transformers
and generators against time is given. Figure is extracted from [1]. . . 50 4.3 Simulation on UIUC 150-Bus Test System with initial failure of node 128 . . . 50 4.4 Simulation on UIUC 150-Bus Test System with 3 cases: 1) node 101 fails at time 0 and
node 144 fails 5 seconds later; 2) node 144 fails at time 0 and node 101 fails 5 seconds later; 3) both nodes fails simultaneously at time 0. . . 51 4.5 Comparison between simultaneously attack strategy and multi-step attack strategy with
k= 2,3,4. IEEE 39-Bus Test System is used as test benchmark. . . 53
5.1 Evolution of the electric power grid [2]. Interactions of physical and communication systems in modern power networks. . . 57 5.2 Example of cyber-physical interdependency in a two-area CPPS. . . 60
5.3 Dynamic description of failure in terms of state transition. State “0” is the normal operation state; state “1” represents that the component fails. The transition rate of two states are i(t) and µi(t), where i(t) consists of stochastic transition rate Si(t)
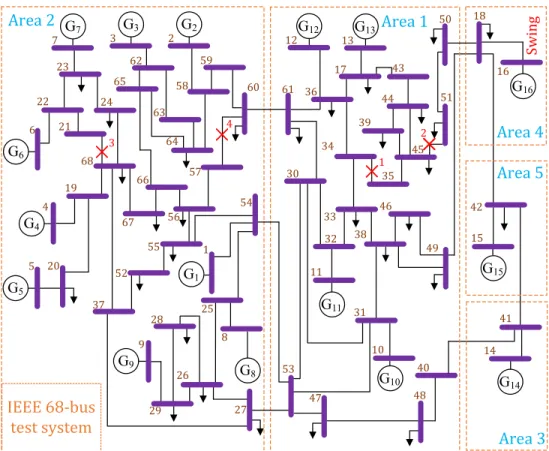
and deterministic transition rate Di (t). . . 63 5.4 Flowchart of the proposed CPPS cascading failure model . . . 65 5.5 IEEE 68-bus test system diagram, where area load dispatch center are colored in blue,
and regional control center in red. . . 67 5.6 Examples of 4 network structures. Rewired network in (d) is constructed from IEEE
68-bus power network and randomly choose 15% of edges to rewire. . . 69 5.7 Robustness evaluation with various interdependencies using average blackout size ⌘avg
with di↵erent tolerance paramter ↵. The simulation is using the random cyber network structure. . . 72 5.8 Robustness evaluation with various network structures using average blackout size ⌘avg
with di↵erent tolerance paramter ↵. The simulation is using the D-D interdependency. 72 5.9 Probability of large cascading outages under di↵erent cyber network structures and
interdependencies. Tolerance parameter ↵ is set as 0.2. . . 73 5.10 Blackout size and probability distribution, where the probability is fitted as a function
1.1 Major blackouts since 2003. . . 2
2.1 Comparison of Cascading Failure Analysis Models with Advantages and Disadvantages Summarized . . . 22
3.1 Nomenclature of generator and network models . . . 29
3.2 Important Parameters for CFSP . . . 36
3.3 BS Distribution with di↵erent using the proposed CFSP . . . 40
3.4 BS with di↵erent using CN-based Model where busbar voltages are assumed constant [35] 41 3.5 Average BS with di↵erent load shedding rate . . . 41
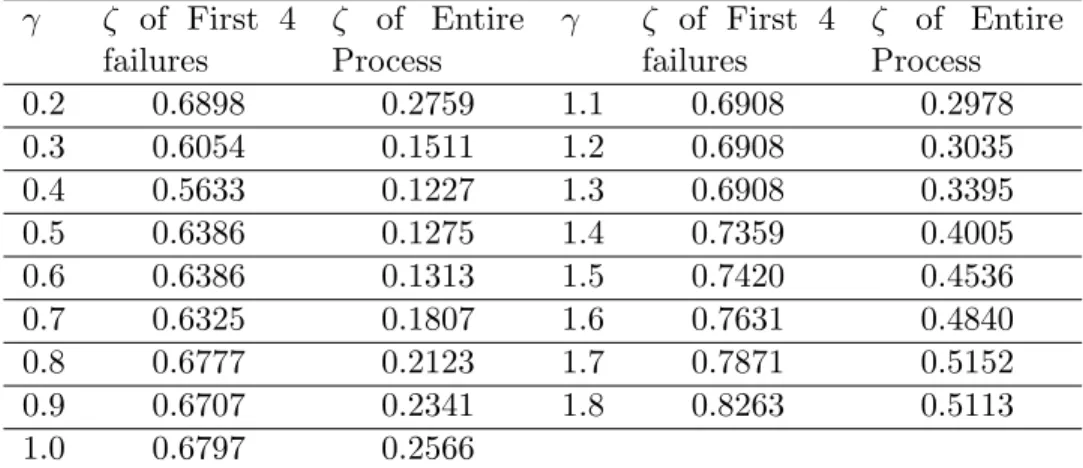
3.6 Failure Propagation Profile Comparison using⇣ . . . 43
3.7 Comparison of BS Under Di↵erent Load Models . . . 43
5.1 Statistical parameters of CPPS networks . . . 68
5.2 Useful parameters of the proposed CPPS cascading failure model . . . 70
5.3 Critical components of CPPS (↵= 0.2). Indexes 1-68 are power nodes, indexes over 69 represent power edges. . . 74
5.4 Vulnerable components of CPPS (↵= 0.2). Indexes 1-68 are power nodes, indexes over 69 represent power edges. . . 75
5.5 Fitted curve with di↵erent interdependencies, where the simulation is conducted using the random cyber network with ↵ set as 0.2. . . 76
5.6 Fitted curve with di↵erent network structures, where the simulation is conducted using the B-B interdependency with ↵ set as 0.2. . . 77
Introduction
1.1
Background
Power system, one of the most complex networks in modern society, plays a significant role in people’s daily lives. It is a huge system with interconnections between service areas, and can be regarded as the backbone of our modern cities. Power system normally consists of generating stations, transmission lines, and distribution substations/lines. Power stations generate electricity, which is transferred through high voltage transmission lines from distant resources to demand centers, and finally distributed by distribution substations to industrial, commercial, and residential customers. The power system ensures our safety and security, and is vital to the society. Recent years, rapid development of smart grid and integration of renewable energies has brought significant changes to the power system in a more efficient, e↵ective, economical, and socially friendly fashion [3]. On the other hand, these great changes have also brought new challenges, especially the stability and reliability issues and the subsequent occurrence of blackouts [4]. Cascading failures, one of the severest power system instability problems, may cause large-scale damages and massive economic losses to society. Cascading failures are defined as ”the uncontrolled loss of bulk electric system facilities triggered by an incident (or condition) at any location resulting in the interruption of electric service that cannot be restrained from spreading beyond a pre-determined area [5].” Generally, these cascading failures may initially start with any component of the power system, e.g., the failure of buses or transmission lines. The initial failure may cause power flow redistribution and a↵ect other transmission lines or buses, which in turn may get overloaded and therefore forming the cascading e↵ect. These large-scale cascading blackouts are infrequent but substantially risky due to their catastrophic consequences. Blackout data from North America suggest that the frequency of blackouts with scale over a certain threshold follows a power-law distribution, rather than the common Gauss distribution [6–8]. This evidence demonstrates a much higher large-scale blackouts probability than we thought. Some major blackouts are listed in Table 1.1, where the economic losses and horrible e↵ect are shown. These severe events draw wide attention from both academia and industry, as such large blackouts are more complicated than normal electric outages caused by small disturbances. Cascading failure is found to be the key factor leading to a large blackout from the reports of those blackouts [1, 9–12]. For example, in 2003 North America blackout, the blackout was initiated by a 345kV transmission line failure that was caused by its contact to the tree. At the same time, there was an communication error in the control room. These two
Table 1.1: Major blackouts since 2003. Blackout location Date People a↵ected (Millions) Loss of load (MW) Estimated cost(Million dollars) Time duration Improvements after blackout North America 14-15 August 2003 50 61.8 Over 10,000 5-72h Introduce higher reliability standards for
North American electricity industry
London 28 August 2003 0.5 724 N.A. >30mins
Enhance cooperation between utility companies Italy 28 September 2003 57 24 1200 5-9h Implement Day-Ahead Congestion Forecast (DACF) Pakistan 24 September 2006 160 11.16 N.A. 5-6h N.A. Europe 4 November 2006 45 14.5 N.A. 2h Amendments UCTE Operation Handbook Colombia 26 April 2007 41 6.644 130 >4h Improvements of communication channels among the
control centers Brazil and Paraguay 10-11 November 2009 87 24,436 N.A. 4-6h
Introduce House Load Operation (HLO) and
new restoration strategies
Brazil 4 February 2011 40 8.884 N.A. >3h
Implement new islanding protection
scheme
India 30-31 July 2012 670 48 6000 2-8h New load shedding
strategies Turkey 31 March 2015 70 32.2 700 >7h Improve overload monitoring and protection of transmission lines
Sri Lanka 13 March 2016 21 800 N.A. >4h Adopting ’must run
units’
Kenya 7 June 2016 44 N.A. N.A. <3h N.A.
South Australia
28 September
2016 1.7 483.7 367 >3h
New rules on wind generation, System restart Ancillary Services (SRAS), Rate of Change of Frequency
(RoCoF)
Taiwan 15 August 2017 6.68 4000 Over 3 >3h N.A.
contingencies together initiated the cascading blackouts, as the communication error made the power system operator underestimate the possbile results of the transmission line failure, whose trip finally led to the overload of another 345kV transmission line. Finally, more transmission lines and generation units failed and the whole power system collapsed.
The complex mechanisms during the cascading failure make it difficult to anayze through conven-tional power system analysis approaches and models. The consequence of this is the emergence of many researchers and research groups, as well as a variety of novel models and analysis tools, focusing on understanding, prediction, prevention, mitigation and restoration of cascading failures [13–15].
1.2
Motivations
Large-scale cascading outages brought disastrous impact and great economic losses to our society, while the related research works are far from accomplished. Traditional research works are focusing more on the single or initial several failures, rather than the whole procedure of the cascading failure process. Many commercial power system analysis tools, such as Electromagnetic Transients Program (EMTP) and PowerWorld [16, 17], are not able to reflect the whole cascading failure propagation and procedure. These tools are not designed for cascading failure analysis, and thus having a large learning curve and are difficult to use. When considering the whole cascading failure procedure with considerable computations, such tools may fail to provide a timely solution. Last but not least, some of these commercial tools also require the purchase of parallel simulations, which would be a large budget for the majority of research groups. Some other cascading failure modeling tools provided by researchers, such as [18–20], fail to consider essential electrical properties, which might lead to erroneous and misleading results [21]. In addition, most of the analysis tools mentioned above have limited functions on PSD. Therefore, a Power System Dynamic(PSD)-based cascading failure simulation platform is introduced, which is easily modified and have a well trade-o↵ between the accuracy and efficiency.
Furthermore, the complex power network is increasingly coupled as Cyber-Physical Power System (CPPS) nowadays. In a CPPS, cyber devices are used to collect real-time data and receive control signals, in order to assist normal operation of electrical network. Electrical network provides necessary power for cyber devices to operate normally. Previous studies provide over-simplified models that fail to catch the necessary features of the power system and the cascading failure. Further, there are many probabilistic failures during the cascading failure, such as hidden failures, which are not taken into consideration in the model. To fill the void in relevant researches, power system cascading failure is extensively investigated, considering the coupled CPPS using the Complex Network (CN) theory and stochastic methodology.
Cyber-security is becoming extremely critical as its damage may lead to malfunction of power grid operation systems; for example, the severe cascading blackout initiated by cyber attacks on several substations in Ukraine in December 2015. Motivated by this, several attack strategies are simulated to test the vulnerability of a power network structure, so that the corresponding strategies could be implemented to protect the power system.
1.3
Objectives and Contributions
The first objective of the research is to provide a novel, proficient and simple method to model the cascading failure in the power system. To be specific, the balance between the accuracy and efficiency should be carefully considered. Therefore, a novel PSD-based cascading failure simulation platform is proposed. The proposed model allows precise modification of any parts of the model, and has a good trade-o↵ between the complexity and the computational time. Furthermore, the CPPS is also investigated to find out the di↵erent characteristics under the cascading failure. The Markov Chain-based stochastic method is implemented in the model. Some useful metrics for assessing robustness and vulnerability of power networks are introduced. Various attack strategies are implemented to test the vulnerability of a power network structure. The cascading blackout distribution has also been carefully studied.
1.4
Thesis Outline
This thesis is supported by multiple academic journal papers and conference papers completed during my PhD study. The thesis is outlined as follows. Chapter 1 presents background information, motivation, objectives and contributions of the thesis, and also provides the thesis outline. In Chapter 2, a comprehensive and state-of-art literature review has been provided. The basic mechanisms of the cascading failure is introduced. Most existing valuable and useful models and analysis tools for cascading failures have been summarized and compared. Chapter 3 introduces a novel PSD-based Cascading Failure Simulator Platform (CFSP), which takes into consideration PSD, load models, relay models, and automatic load shedding mechanisms. The proposed PSD-based CFSP is tested using the IEEE 68-bus power system, and validated by studying the cascading failure propagation profile, which demonstrates great agreement with historical power system cascading failure patterns. The comparison between CFSP and a Complex Network (CN)-based cascading failure model has been conducted to vigorously study the impact of PSD. In Chapter 4, an improved topological model taking timescale into consideration is proposed. The model also incorporates the relay setting according to industrial standards, which reveals power system operation more accurately. Moreover, the model is validated using UIUC 150-bus and IEEE 39-bus test systems. In order to assess the vulnerability of a power network, the multi-step attack strategy has been proposed. Chapter 5 introduces a novel stochastic cascading failure model considering the interdependency between the cyber network and power network. A multi-agent system and a novel protection relay model are incorporated into the proposed model. To apply the proposed analytical method, a test power system, IEEE 68-bus power system, is used to study the impacts of a range of interdependencies and cyber network topological structures on the cascading failure. This thesis is comprised of a number of papers that have been published during my PhD study. The full publication list is detailed in the Authorship Declaration part.
Overview and Literature Review
This chapter presents the overview and literature review of the cascading failure. Cascading failures have extremely complicated mechanisms, while its systematical investigation had not begun until ap-proximate 2003 when several catastrophic cascading blackouts occurred all around the world [1, 4, 9, 10]. This chapter generally introduces the cascading failure, as well as some useful mathematical analytical models. The advantages and disadvantages are carefully compared between these various analytical simulators.
The content of this chapter is mainly based on and modified from the following academic papers:
Hengdao Guo, Ciyan Zheng, Herbert Iu, Tyrone Fernando, “A critical review of cascading failure
analysis and modeling of power system”, Renewable and Sustainable Energy Reviews, vol.80, pp.9-22, 2017.
2.1
Overview of Cascading Failure
Cascading failure involves a large amount of complicated mechanisms, which makes the thorough understanding of the whole event a great challenge. This section demonstrates an overview on cascading failure from di↵erent perspectives, and highlights the challenges on its analysis and modeling.
2.1.1
Causes
There are various causes for a cascading failure [13]. Exogenous disturbances that initiate the event, and endogenous events that trigger the components can be generally classified as four groups:
• Nature disasters: Lightening strike, strong winds (tornado, hurricane), earthquakes;
• Human activity: Errors caused by human misoperations, inappropriate setting for protection devices, intentional physical or cyber-attacks on power grids;
• Unexpected component failures: Hidden failures (exposed during changing operation status), trans-mission line that contact vegetation;
• System failures: Distance relays trigger the transmission line due to overcurrent or undervoltage, voltage collapse, abnormal excitation in generators, abnormal speed in generators, generators tripped
by under-frequency, generators tripped by under-voltage, generators tripped by out-of-step, insufficient reactive power, small signal instability.
The first three groups are common failures that initiate the events, whereas the fourth group are failures that commonly exacerbate the cascading. The first and second group of failures are unlikely to be prevented with modern technology. The third and fourth groups are dependent failures that would be involved in most cascading failure blackouts.
The various and stochastic causes are challenging cascading failure analysis models on simulating all of these mechanisms. Quite a lot of approaches and models have been provided trying to take them into consideration [5, 7, 19, 22–107]. Some are using stochastic approaches to simulate uncertainties in a cascading failure. Some are modeling dynamics of the system to involve voltage and machine problems. High-level statistical models have also been provided in order to estimate the average cascading propagation and blackout distribution sizes. Interdependent infrastructures are modeled to analyze the interactions between power networks and cyber networks during the cascading failure.
2.1.2
Procedure
During the cascading process, the complex procedure and the complicated mechanisms are also great challenges. According to [22], cascading failure can be divided into two phases, namely slow cascade and fast cascade.
For the slow cascade phase, the failure cascades slowly and gives rise to little e↵ect on power system stability. This phase ranges from several minutes up to several hours. Most failures during this phase are common problems that operators are hardly aware of their impact, thus missing the chance to prevent the cascading. Besides, some hidden failures may be exposed during this phase, which trigger some important devices or transmission lines. In [108], the author showed that the relays with hidden failures work normally under stable conditions. When a transmission line is tripped, all the transmission lines connected to its ends are exposed to incorrect tripping. Overload transmission lines that eventually touch trees or ground due to high temperature also have high probability to occur during this phase.
During the fast cascade phase, power systems become unstable. The overload transmission lines trigger successively in a short time, with possible voltage collapse, frequency oscillation occur in the system. Meanwhile, the dynamic instability may trip the generators, which lead to further load and generation imbalance and exaggerate the dynamic instability. It is almost impossible for operators to stop the cascading during this phase manually, because the short time period between each sequential event ranges from only milliseconds to tens of seconds [22]. Normally, the transmission lines can keep working under overload conditions for hours, and can be reclosed manually if no fault is found. Nevertheless, when there is a large power swing in the system, the distance relay setting on zone 2 or zone 3 may directly trip the transmission line with short time delay, and they will be acting so quickly that the operator has no time to reclose the line or stop the cascading. Thus, the cascading starts tripping like a domino and eventually cause a large blackout.
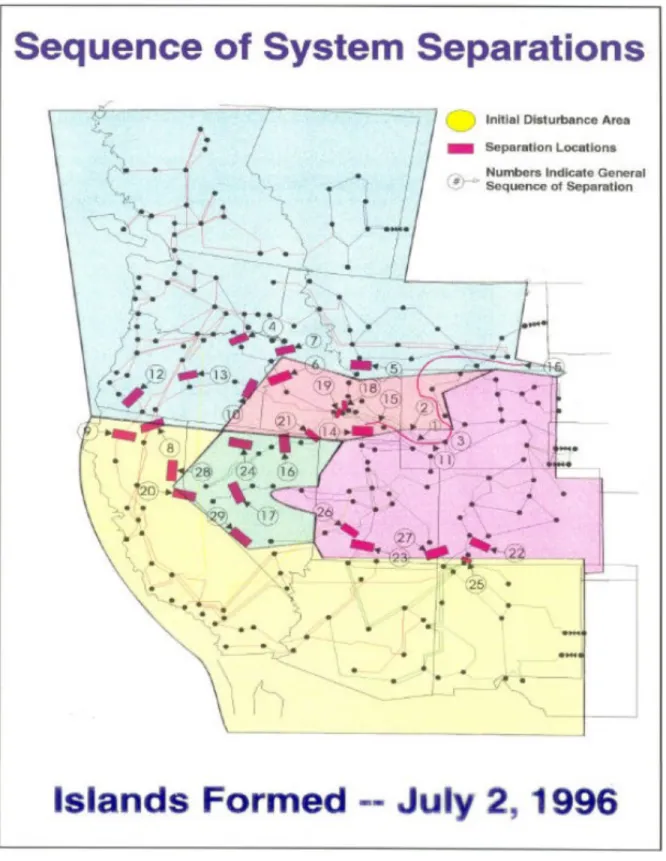
Figure 2.1: The figure illustrates the non-locally propagation of cascading failure, with triggering events labeled
Another characteristic is that cascade events propagate both locally and non-locally in a power system [109]. An example is the blackout occurred in U.S in 1996, as shown in Fig. 2.1 [107]. The sequence of the triggering events have been labeled, illustrating the non-local propagation. This property makes the prediction and prevention of cascading failures more difficult.
The procedure during a cascading is the most critical and difficult part to be simulated. Consequently, most emphasis are putting on this, with a large number of mathematical models and analysis tools provided [5, 7, 19, 42–107]. Some stochastic models are provided to simulate the non-locally propagation of cascading. Deterministic models aims at simulating detailed mechanisms during the cascading.
2.1.3
Impact and Restoration
After the cascading failure stops, the measure of the impact and the restoration of the power grid are two critical points. The impact of the cascading failure are hard to measure accurately due to many indirect costs. Based on power grid only, the impact of the cascading failure are commonly measured in terms of the loss of load [13]. Studies on di↵erent metrics have been proposed in order to assess the impact of a cascading failure blackout from a complex network perspective [23–38].
The restoration of the system after the blackout is an essential step. The faster the restoration, the less impact to society from the blackout. Thus, an efficient restoration approach is necessary. A graph-theoretic distribution system restoration-based spanning tree search strategy has been provided for this goal [110]. Another recent trend is the self-healing characteristic based on complex network analysis [111–113].
2.1.4
Risk Assessment
Risk assessment is another way to understanding cascading failure more deeply. Small disturbances in a power network occurred frequently due to severe weather or failure caused by aging devices, while the e↵ect is relatively small compared with cascading failure blackouts. Thus, it is necessary to distinguish disturbances that could lead to cascading failures from small common failures. Despite the N-1 criterion that is regulated for most power system, large blackouts do occasionally happen due to failure of a single transmission element [111]. The utility companies are using various approaches and tools in order to assess, predict, monitor and mitigate the cascading failure, while there are no developed standard analysis tools. Meanwhile, there are many researchers focusing on the field, demonstrating helpful approaches [13].
2.1.5
Dynamic Analysis
Despite the significant contribution from the tripping of the overloaded transmission lines, dynamic instability of the system is another critical factor that cannot be ignored in the cascading failure [112]. In fact, power system dynamic instability will cause incredible e↵ect on the whole system when generators get tripped. Analysis of dynamic phenomena, such as voltage collapse and frequency oscillation, is a conventional field of study in power system analysis [113]. However, most common approaches fail to analyze system dynamic instability under multiple contingencies. In the cascading failure, the balance between generation and load under no overloaded condition is a possible way that the cascading stops, while the dynamic instability may destroy such balance, thus exacerbating the cascading. How to accurately simulate such phenomena during a cascading failure still remains a challenge due to so many complex mechanisms. Existing methods are focusing mainly on a small part of the dynamic problems that is involved in a cascading [64–72]. Recent models have involved timescale of dynamic during the
cascading [73, 76].
2.1.6
Robustness and Vulnerability Analysis
Diverse studies have been proposed to focus on robustness and vulnerability of a power system, so as to increase the reliability of the grid against the cascading failure [23–38]. Many approaches analyze the robustness and vulnerability of power system by removing components from the system and evaluate the impact under di↵erent removing strategies. Some studies are using Monte Carlo method to simulate all possible contingencies so that the most likely failed components can be obtained. A variety of robustness metrics have been proposed in order to quantitatively measure the robustness [114–119].
2.1.7
Mitigation and Prevention of Cascading Failure
Mitigation and prevention of cascading play a critical role once the cascading starts. Great e↵orts have been made in this field [61, 70–72, 96–98, 105]. Mitigation approach aims at reducing the impact of cascading failure by load shedding, line switching or some other remedial actions. Prevention of the cascading utilizes some fast response remedial actions at each stage of the cascading to prevent or at least mitigate the spread of the cascading. The computation and action speed of such methodologies are crucial, as such automatic reaction should be faster than the spread of the cascading in order to take e↵ect. Mitigation and prevention strategies are normally based on a given model, whereas the validation should also be provided under other similar models.
2.1.8
Grid Structural Improvement
The analysis on the power system structure in order to prevent the cascading failure has also been an increasingly important topic. Due to the rapid evolution of the power grid, the integration of the renewable resources and the replacement of the aging devices and transmission lines, it is necessary to find a more reliable construction for a power grid. Some studies are thus arising to deal with such significant issue from di↵erent perspectives [120–128]. The author in [120] provided an “e↵ective augmentation” algorithm based on complex network analysis that allowed rapid and efficient augmentation of nodes in one time-step. Power system expansion with renewable energy was studied in [121]. A review was presented in [122], summarizing the expansion analysis from various perspectives. In [123], reliability has been taken into consideration with respect to power system evolution. There were some papers investigating the grid structural improvement against a cascading failure [124–128].
2.1.9
Independent Infrastructures
In recent years, the conception of a smart grid came up due to the increasing demand for reliable energy and numerous technological advancements in power grids. By definition from Department of Energy (DOE) in the United States, smart grid generally refers to a class of technology people are using to bring utility electricity delivery systems into the 21st century, using computer-based remote control and automation [129]. Smart grid enables generation, transmission and distribution of the electricity more conveniently and efficiently. Technologies such as phasor measurement unit (PMU), wide area measurement units and Supervisory Control and Data Acquisition (SCADA) will be deployed to help
achieve these goals, while they also present an increased dependency on cyber networks. Despite the benefits the smart grid brings, the security and reliability of the power system become more vulnerable because of the coupling with cyber networks. The cascading failure blackout, which a↵ected most part of Italy on September 28, 2003, was an example how coupling network contributed to cascading failure [10]. Buldyrev analyzed the case by providing a coupling model to simulate the event [130]. Another case is the blackout caused by cyber-attack on December 23, 2015 in Ukraine [131]. Due to the complexity of the interdependent infrastructures and the difficulty on validation, there has been little progress on this topic. Most existing interdependent models related to cascading failure were based on complex network analysis [92–99].
2.1.10
Complex Network Perspective
Complex network analysis has a relative short history, while its rapid development greatly attracts attention from many scholars. It was not until late 1990s when some significant progress appeared. In 1998, Watts and Strogatz first introduced small-world networks, which were highly clustered and having small characteristic path lengths [132]. They demonstrated that the electrical power grid of the western United States were such kind of networks. Later in 1999, Barabasi and Albert proposed an improved network called scaled-free network, whose vertex connectivities followed a scale-free power-law distribution [133]. Most power grids were also proved to follow the power-law distribution [134–136]. Many researchers began to explore how to adopt complex network analysis to power system [23–41].
From a complex network point of view, a power grid can be simply demonstrated by a graph, where nodes or vertexes represent generators, transformers or loads, and links or edges represent transmission lines. Based on this structure, many di↵erent intrinsic characteristics have been applied to nodes and edges, in order to better reveal electrical properties in the power grid [137–140]. Studies focused on di↵erent countries got the similar conclusion that the power network belongs to small-world networks [127, 141–147]. While most models considered only high voltage system, reference [136] took medium voltage and low voltage grid into consideration. A survey of studying complex network theory for modern smart grid applications has been proposed in [148].
2.1.11
Other Features
Most people hold the opinion that cascading failures occur more often during summer or winter when there is a heavy load on transmission lines, while it should be noted that many large blackouts actually happened in spring and fall, as showed before in Table 1.1. The reason is that during these periods, many devices are under routine maintenance due to the relative low consumption compared with that of summer and winter. The unserved facilities seem reasonable during this period of time, while the combination of them with some other disturbances may increase the chance of an unexpected cascading failure. It can be found that the facilities under maintenance existed in most major blackouts [1, 4].
Islanding is a common phenomenon found in most major blackouts. Mostly, the islanding area will su↵er the unbalanced generation with load, thus leading to dynamic instability. Occasionally, there will be the balance between the generation and load, and the islanding grid will eventually survive. Studies concentrated on this field mainly focused on development of the islanding optimization and control strategies [149, 150].
Climate change, another critical factor related to power system reliability, contributed significantly to major blackouts over the last 30 years [151]. The increase in the temperature will greatly a↵ect the possibility of transmission line failure due to overcurrent or possible sagging into vegetation. Moreover, to deal with climate change, the integration of renewable energies has been widely implemented during these years. However, it also brings system reliability issues such as fault ride through (FRT) of wind generators and intermittency of power generation from renewable sources. Consequently, some mitigation strategies have been proposed to deal with such issues. As have been summarized in [152], there are many potential strategies, such as accurate weather location and severity estimation, reserve plans, demand side management, system configuration, undergrounding distribution and transmission lines, redundant transmission routes, microgrids, advanced control systems, etc. Despite the difficulty in modeling such phenomenon, it is worth putting emphasis on related issues, simulating the possible impact and proposing potential mitigation strategies.
The need for comprehensive cascading failure analysis tools is urgent. Most utilities do have reliability analysis tools, such as Real Time Contingency Analysis (RTCA), Static Security Assessment (SA), Transient Security Assessment (TSA), Voltage Security Assessment (VSA), Small Signal Analysis (SSA), etc., to simulate various conditions and possible outages [153]. Nevertheless, most of these analysis tools are only able to analyze a specific given contingency. The cascading events with so many mechanisms are totally beyond their capabilities. Moreover, common analysis tools focus simply on electrical problems rather than protection and human operations that can also lead to cascading failures, such as 2003 North America Blackout [1]. Most existing approaches and simulations tool can provide only part of the characteristics in a cascading failure. An exhaustive framework of the whole procedure is far from accomplished.
2.2
Literature Review of Cascading Failure Analysis Models and
Methodologies
A great diversity of methodologies has been proposed aiming at modeling the cascading failures [5, 7, 19, 23–107]. However, to the best of author’s knowledge, no existing approach is able to capture all mechanisms during the cascading failure. Each model has its own concentration and advantages, while the information of the overall phenomenon are still needed in the simulation. In this section, a brief review and summary of the state-of-art cascading failure analysis models and methodologies will be presented. Based on their di↵erent characteristics, the models can be roughly classified as six groups:
• Topological models
• Stochastic simulation models • High-level statistical models • Dynamic simulation models • Interdependent models • Other models
by its main contribution and feature. This is just a rough division and there are other di↵erent classifications, such as component dependent models or probabilistic models.
2.2.1
Topological Models
Complex network analysis progressed rapidly these years and contributed significantly on cascading failure analysis. Since cascading failure almost exists in all complex networks, researchers are thus trying to adopt it to analyze power systems. Early studies proposed various models on cascading failure of a power system, which were relatively simple and failed to explicitly reveal the physical properties involved in the power grid [154–156]. At first, betweenness centrality models were introduced to describe cascading failure, where betweenness centrality was used to assess loads and capacities of nodes and lines [157–159]. The recalculation will be done each time the capacity has been exceeded. Later, a node capacity model has been proposed [160]. In this model, the node capacity is proportional to its initial load. Such capacity definition has been widely used in many models, especially when node or line capacity is not given.
Most of the early works concentrated only on purely topological properties, such as node degrees, betweenness centrality, distribution analysis and path length analysis [141–147, 154–161]. These works focused on more general complex networks rather than electric power grids. However, these purely topological models may be misleading in their results due to lack of consideration in electrical features [21]. Later, to tackle this problem, many modified topological models, with electrical properties involved, have been proposed. There were some existing reviews on complex network applications for cascading failure in power grids, while the models discussed were only classified by their analysis aspects (such as vulnerability, robustness, risk assessment, distribution, node and line criticality, attack-based resilience, evolution, etc.), rather than explaining how various models di↵er from each other and how these models evolved [114–119]. A rough classification of three di↵erent groups of topological models have been summarized below as a reference, namely modified topological models, maximum flow models and complex network-based interdependent models. Note that the last group will be discussed later in interdependent models instead of this part.
Modified Topological Models
Modified topological models typically consider part of electrical properties such as Kirchho↵’s law, line impedance or reactance, line capacity and flow-based analysis. These models can partially reflect the characteristics of cascading failure in the power system. An early study modeled the power network in terms of generator nodes, transmission lines and distribution nodes (load), with vulnerability analyzed [23]. Another model given in [24], considered the dynamical redistribution flow and the e↵ect from failed nodes towards the network. Later, [25] demonstrated a modified topological model considering resistance distance instead of common topology distance to reveal electrical properties. There were models that took into consideration the load flow, such as [26–30]. Electrical features and complex networks have been combined in [137], which provided equivalent impedance and the adoption of power transfer distribution factors (PTDF) to new metrics, such as entropy degree, electrical betweenness and net-ability [137–140]. These three metrics have been widely used in analyzing the vulnerability of power networks and identifying the critical components [31–34]. Robustness has been
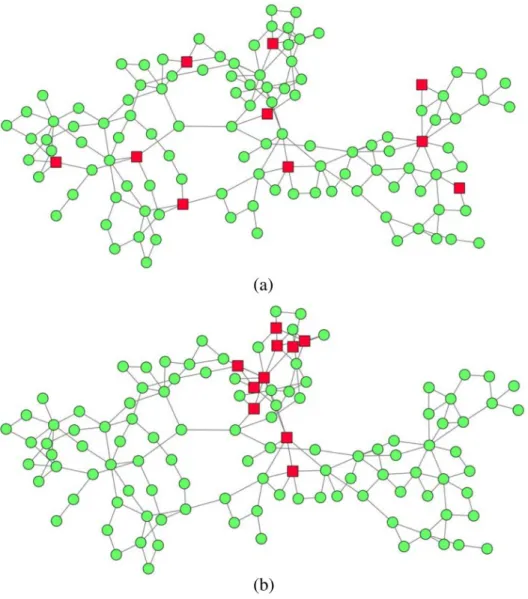
analyzed using the model that is derived from admittance model provided by Grainer and Stevenson [89], with two new robustness metrics percentage of unserved nodes (PUN) and percentage of noncritical links (PNL) introduced [35]. The paper also investigated the structural features against cascading failure in terms of generator distributions. Fig. 2.2 illustrates the structural topology of power networks of the IEEE 118-bus test system with decentralized generator location in (a) and a centralized one in (b), where red squares represents the generators [35]. The result showed that for a given number (percentage) of available generators in a power system, the decentralized generator locations may greatly increase the robustness of the power grid. Another modified topological model was recently presented in [36], which considered node overload failures and hidden failures. The authors in [37] used an AC power flow-based model to analyze the impact of topology on the cascade propagation. By depicting the power network as a weighted graph based on the reactance matrix, [38] introduced an improved model to analyze vulnerability. The concept of load has been redefined by using power angle information with power flow constraints considered.
Figure 2.2: The figure illustrates the topology of power networks. (a) IEEE 118-bus with decentralized generator locations; (b) IEEE 118-bus with centralized generator locations. Red squares represent generators.
Maximum Flow Models
The maximum flow theory was originally raised by Harris in 1955 for maximum traffic in railway, and then studied by Ford in 1956 [162]. Its adoption to power grid first appeared in [39], which took into consideration the maximum flow from source (generator) nodes to the sink (load) nodes with respect to the line impedance. The model was used to identify the vulnerability of the power network. Later, the authors in [40] proposed an improved maximum flow-based model with node weight considered. The model also adjusted the max flow problems with multi-source/sink-node into single node pair. The model was validated by simulation in western Danish power system and the results were compared with the former model. Recently, an introduction to a maximum flow-based model to analyze the vulnerability of the power grid has been presented [41]. The initial load distribution was controlled by a tunable parameter, where the vulnerability was proved to be greatly a↵ected by this parameter. A multi-attribute node importance evaluation method based on Gini-coefficient had been simulated using this model [42].
2.2.2
Stochastic Simulation Models
Many simulation tools emphasis on deterministic approaches, which can illustrate the sequence of the triggering events in details. However, cascading failure will rarely proceed as you expect. Due to the large uncertainties that initiate and exacerbate the cascading, the stochastic simulation, also known as probabilistic simulation, which takes all possible factors into consideration is necessary. Moreover, some factors that contribute to the cascading are hard to simulate, such as misoperations by human or transmission lines that contact overgrown trees due to relatively high current flow. It is thus essential to use stochastic approaches to simulate more possible events.
PRACTICE Models
Reference [43] provided a useful stochastic cascading simulation techniques that take probable factors into consideration. In this model, two cascading modes are allowed, namely “single-path” mode and “multi-path” mode. Single-path mode allows uncertainties only relevant to the initial events, after which the system will behave “as expected” during the cascading. Multi-path mode simulates uncertainties, as well as the response from protection systems, through the whole procedure during the cascading. The hidden failure probabilistic model, the overcurrent relay probabilistic model and the event tree-based probabilistic cascading approached was adopted in the techniques. The model was tested on Italian EHV transmission grid, which showed the data on peak and o↵peak load in early 2000’s. A comparison was made with a detailed overload-based dynamic time domain simulator. The result reveals a good consistency between the two models, at least during the slow cascade phase [19]. The mismatch result in the fast cascade phase highlights the challenges on simulating so many mechanisms involved in the cascading failure.
Markov Chain Models
A Markov chain is a type of stochastic process used to describe a system that follows a chain of linked events [44]. It is adopted to modeling the stochastic factors in cascading failure of a power grid, such
as hidden failure or misoperations. The result of this model can be used as an evaluation of overall probabilities of all states that depicts the cascading failure. The model can normally have a very large size.
In [45], a stochastic Markov chain model has been introduced. The model was based on power flow redistribution. It took into account the uncertainties in the load setting, generation and line flows. The model also captured the cascading events with regard to real time signals. The critical components has been identified using the metrics provided. Recently, [46] presented a network-based Markov chain model to study the propagation dynamics of the entire power networks. Robustness of the power network has been analyzed through the model. An extended Gillespie method was adopted in the model [47]. It also showed that small-world network structure would propagate cascading failures more widely and rapidly compared with a regular network structure. A Markovian tree-based multi-timescale cascading outage simulation model has been provided in [48], aiming at risk assessment of cascading failure. The paper also proposed a novel forward-backward Markovian tree search scheme based on a risk estimation index. In [49], the author introduced a continuous-time Markov chain approach modeling the system dynamics. The model considered loading level, error in transmission-capacity estimation, and constraints in performing load shedding. It also allowed real-time prediction of blackout evolution probability.
Recently, an influenced graph model using Markovian chain was described in [50]. Large amounts of data from cascading failure simulations were synthesized into a Markovian network model. The distribution of the cascading failure results achieved from this model matched those from cascading failure simulators. A methodology based on this model has been demonstrated to identify the probability of risk when a component was upgraded in the power system.
2.2.3
High-level Statistical Models
Despite the accuracy and detailed mechanisms simulated by common cascading failure analysis tools, the computation speed remains a challenge when the simulator aims at predicting the real time propagation tendency and the distribution of the blackout size. High-level statistical models are advanced in their simulation speed because the detailed mechanisms of the cascading failure are ignored. Such models aim at providing an overall view of the cascading failure and are simple and tractable.
CASCADE Models
CASCADE model is an analytically tractable model based on load of the component [51]. It assumes a random initial load on all identical components and a given disturbance load on each component to initiate cascading. Some components may fail when load exceeds a certain threshold, where the load of other components will be redistributed, thus forming a cascading. The cascading only stops when no overloaded component exists or the whole system fails. The redistributed formulas are much simpler when compared with models that simulate detailed cascading failure mechanisms, so that the total number of failure components as well as the distribution of the blackout sizes are easier and faster to obtain. The model shows how system loading a↵ect the risk of a cascading failure [7]. When load is in a low level, the approximate exponential tail of the failure components is found and the probability of a large cascading failure is low as well. However, when a critical loading is exceed, the distribution of
the failure components follows the power law and the risk of a large blackout increases sharply. The deficiency of the model is that it disregards all physical properties and the power network internal interactions. Thus, it can only provide a general view of the cascading failure.
Later, the model has been modified and used to analyze some other factors related to cascading failure. In [52], the cascading motor stall has been analyzed using CASCADE model. It demonstrated that the results from the CASCADE model, with a faster computation speed, matched well with that of other dynamic models. Reference [163] showed a high risk on voltage collapse when a failure triggered a cascade of motor stalling. In [53], the focus is on power system reliability through a modified CASCADE model, with the time of the failure propagation considered. Another important model, which can be regarded as an improved CASCADE model, is branching process model that will be discussed below.
Branching Process Models
Branching process methodology is widely utilized in probability theory, especially in simulating the reproduction according to some specific probability distribution [164]. It has been applied to many research areas such as the spread and disappearance of surnames in genealogy and Y chromosome transmission in genetics. The adoption of branching process models to cascading failure analysis is firstly introduced in [161], [54]. After that, some improvements have been made upon the models in [58, 63]. [55] highlighted the importance of the application of branching process models. More recently, some new applications on such models were presented in [37, 56, 62].
In the branching process model, each failure component interdependently a↵ects the next stages through a given distribution. By considering the cascade propagating probability through a branching process, the results showed an approximation with that simulated by CASCADE model as well as the historical data [57]. The branching process model performed a simpler procedure and faster computation speed in estimating the propagation and blackout size distribution. The model has also been utilized in order to find the impact of topology on the average propagation of cascading failure in power system [58]. A novel and systematic approach to discretize load shed data has been introduced so that the Galton-Watson branching process with a Poisson o↵spring distribution can be applied on it [59]. Recently, a multi-type branching process has been applied to analyze the statistics and interdependencies of cascading outages [60]. It also demonstrated that the method can e↵ectively predict the distribution of the load shed, the isolated buses and their conditional largest possible total outages (CLO) without detailed data provided.
The deficiency of this model is the lack of detailed mechanisms of the cascading failure in a power system. It only provides a general estimation of the propagation and blackout size distribution of the cascading failure. In order to deal with this problem, [61] tried to apply branching process to an interaction model to simulate and mitigate the cascading failure.
2.2.4
Dynamic Simulation Models
Dynamic simulation models are similar to conventional methodologies that focus on power system dynamic characteristic analysis, while the di↵erence is that conventional methodologies are hard to simulate interactions under multi-contingency cases during the cascading failure. New dynamic
simulation models perform well on capturing some specific system dynamics during the cascading. In addition, most mechanisms can be included in dynamic simulation models under a variety of outages so that a relatively accurate prediction can be made. However, due to the large amount of details to be taken into consideration, the computation speed will be challenging. Right now, such models will mainly contribute to deeply understanding the cascading failure mechanisms rather than real time prediction and analysis for industrial utilization.
OPA Models
The ORNL-PSerc-Alaska (OPA) model is a DC power flow-based dynamic model proposed by researchers at Oak Ridge National Laboratory (ORNL), Power System Engineering Research Center of Wisconsin University (PSerc) and Alaska University (Alaska) [64]. At first, a solved initial case was given. A random line was supposed to fail and then the generation and load would be redistributed using standard linear programming approaches. The cost function has been taken into consideration to avoid unnecessary load shedding. The model presented a simplified dynamic process of cascading failure and allowed the analysis of self-organization of an evolving power grid. OPA was validated on a 1553-bus WECC network and the simulation results were compared with historical WECC data with a reasonable agreement [65]. However, the deficiency is that it does not provide an accurate simulation on real transmission line outage and update, as well as the probability distribution of blackout size.
Later, an improved OPA model has been presented to overcome these limitations in original model [66]. The improved OPA model took into consideration the e↵ects of dispatching, automation, communication, relay protection, operation mode and planning. Two metrics, Value at Risk and Conditional Value at Risk, were defined in order to evaluate cascading failures risks quantitatively. The model was validated on the Northeast Power Grid of China (570 buses).
An AC OPA model was introduced in [67]. It simulated two types of dynamics, one was fast dynamics involving series blackouts in power systems, and the other one was slow dynamics that reflected the tendency of the power system time evolution. The model also analyzed the voltage stability problem and the enhancement function. The simulation results on IEEE 118-bus test system showed that self-organized criticality (SOC) could be interpreted from the ratio of total load demand to system e↵ective transmission capacity, as well as the fractional overloads. The model was modified in [68], aiming at the slow process during the cascading failure. It focused on tree contact and failure of lines due to line heating, and the utility vegetation management (UVM).
Manchester Models
Manchester model is an AC power flow model developed by the University of Manchester in UK [69]. It allowed analysis of transmission line tripping, generator instability, under-frequency load shedding, post-contingency re-dispatch of active and reactive power, emergency load shedding, etc. It also took into consideration probabilities of generation, transmission and hidden failures. The model used Monte Carlo method for risk assessment of cascading failure. Several researchers used Manchester model to evaluate the blackout cost and mitigation methods [70–72].
COSMIC Models
Recently, a new nonlinear dynamic model of cascading failure in power systems (the Cascading Outage Simulator with Multiprocess Integration Capabilities, also known as COSMIC) has been introduced [73]. As a quasi-steady-state (QSS) model, COSMIC was able to simulate power system with a set of hybrid discrete and continuous di↵erential algebraic equations, as well as protection systems and machine dynamics. The model involved a wide variety of mechanisms including rotating machines, exciters, governors, power flows using nonlinear power flow equations, load voltage responses, discrete changes (e.g. components failure and load shedding) and etc. COSMIC used a recursive process to compute the di↵erential algebraic equations, which represented various mechanisms. Four kinds of loads, namely constant power (P), constant current (I), constant impedance (Z), exponential (E), or any combination thereof (ZIPE) have been modeled [74]. The model was validated by comparing the simulation results on IEEE 9-bus test system with PowerWorld, which was a widely used comprehensive commercial software [75]. Another simulation has been made and the results were compared with a simple dc-power-flow QSS model. The cascading in two models agreed in early stages, while the simulation were substantially di↵erent during later stages.
Multi-Timescale Quasi-Dynamic Models
The multi-timescale quasi-dynamic model is another recently published dynamic simulation model [76]. This model employed quasi-dynamic approach to overcome ambiguity of time in conventional cascading failure analysis models. It provided dynamic simulations such as load variation and generator excitation protection. An improved re-dispatch model based on sensitivity analysis has also been proposed due to the reason that, in reality, transmission loading relief (TLR) and re-dispatch normally took 10 to 30 minutes. Impacts from dispatchers’ involvements were analyzed. The model was tested on IEEE 30-bus test system for generator protection and cascading failure stage characteristics. It has also been validated using data from US-Canada Northeast power grid. The test system had 410 buses, 882 branches, 200 generators and 162,121 MW load. The result showed consistency with the cascading failure happened in 2003.
ASSESS Models
ASSESS is a commercial cascading failure analysis tool developed by Reseau de Transport d’Electricite (RTE) in France, in collaboration with National Grid Company in UK [77]. It allowed a wide range of uncertainty input. Four main facilities have been provided in the model. The first one was a security-constrained AC optimal power flow [78]. The second one was a quasi-steady state simulator that could model dynamics of systems [79]. The third one was a full time-domain simulator that allowed modeling many controls in the system, such as field current limiters on generators, governors, or zone 3 relay protection on overloaded transmission lines [80]. The last one was the access to many statistical tools. ASSESS provided a wide range of models including sequences of events, protection settings, line ratings, fault clearance time, etc. The deficiency is that it requires numerous data and time to simulate, as well as the professional users to operate.
TRELSS Models
Transmission Reliability Evaluation of Large Scale Systems (TRELSS) is also a commercial cascading failure analysis tool, which is developed by EPRI in cooperation with Southern Company Services [81]. The model can simulate the cascade process as a sequence of quasi-steady state system conditions caused by a sequence of tripping events. The Protection and Control Group (PCG) has been modeled as actions of breakers. The voltage problems have also been taken into account using a quasi-steady state AC power flow model. The model was used to identify the most extreme initiating events simulated on Western Interconnection power flow model (approximate 16,000 buses) [82].
Dynamic PRA Models
A two-level dynamic probabilistic risk assessment (PRA) model was introduced in [22]. The paper divided the cascading failure procedure into two phases. The two di↵erent models were supposed to use to analyze the cascading failure. The impact of changes in power system, such as variation of cross-border power flows, wind generation penetration, maintenance and shut-down of power plants, were simulated in the model. The model was tested on New England Test System (NETS) and New York Power System (NYPS) 69-bus test system, using Monte Carlo methods. The thermal e↵ects had been proved to contribute significantly to cascading failure.
Recently, an improved PRA model has been proposed [83]. It analyzed slow and fast cascade phases separately in two decomposition models. The results led to the estimation of the frequency of dangerous scenarios and their magnitudes in terms of energy not served. A clustering methodology was proposed to group scenarios at the end of slow cascade phases so that the dynamic analysis was manageable from a computational viewpoint. The dynamic models of generators were considered [84].
2.2.5
Interdependent Models
Interdependent networks have been studied for years in many areas [85]. The emergence of smart grid accelerates the coupling between the conventional power systems with computer cyber network, forming an interdependent network. However, smart grid brings not only the convenience, but also more risks from cyber network. The possible failures of control systems that connect to the cyber network, such as SCADA, may contribute to the cascading failures to some extent. Cyber attack that aims at smart grid can be various [86]. One such incident occurred in 2003, when the “Slammer” Internet worm took down monitoring computers and successfully blocked commands used to operate other power utilities [1]. Another case, as mentioned before, was the cyber network attack happened in Ukraine in 2015 [131]. The SCADA distribution management system has been remotely controlled by attacker, which led to disconnection of several substations for hours, and the failure cascade to more areas across Ukraine. Actually, once failure begins, due to the coupling e↵ect, the failure in cyber network may directly a↵ect the status of physical devices, thus aggravating the cascading. So far, many studies on assessing risks from cyber network appeared [87–91], while only limited researches have been proposed in studying the interdependent models due to the complexity mechanisms and difficulties in validation in reality.
Complex Network-Based Interdependent Models
Interdependent infrastructures are common in many real world networks, such as transportation networks and economic networks, and have been widely studied using complex network theory [92, 93]. The application on power system coupling with cyber network appeared later in [94]. The reason that complex network-based interdependent networks are divided into this group rather than complex network models is to highlight the importance and future trends of such models.
Buldyrev et al. introduced an interdependent models in [129], analyzing the robustness of interacting networks subject to cascading failures. The model used real-world data from a power network and an Internet network that were implicated in the cascading failure in Italy in 2003. An analytical solution has been illustrated that the removal of the critical nodes would lead to cascading failure and a complete fragmentation of two interdependent networks. The paper also concluded that a broader distribution will increase the vulnerability to random failure, which was opposite to how a single network behaved. The model has been improved by Shao in [95]. The model, based on random multiple support–dependence relations, analyzed the robustness of the power grid. The results were proved to be consistent with those simulated on other single networks. Another model has been proposed by Schneider in [96], whose data were also based on Italy communication system and power network in 2003 blackout. The model showed how to mitigate the cascading failure in a coupled network by selecting a minimum number of autonomous nodes. The disadvantages of these models are that they fail to consider enough electrical property, while focus only on purely topological parameters.
The interdependent model that took electrical property into consideration has been presented in [97]. The model also consisted of power grid and the supporting Control and Communication Network (CCN), where the substation, the generator and the router have been involved. The authors analyzed the minimum nodes that should be removed from both networks to totally fail the network, and proved it to be equivalent to NP-hard problem. A near optimal solution has been provided and tested using 2003 Italy blackout data. Later, a new coupling model that consisted three subnetworks, namely power grid, communication network and interdependency network, has been presented by the same author [98]. A sensitivity analysis was performed to evaluate the mitigating method in the model. A load control policy has also been simulated on the model, focusing on load factor and interdependence degree.
More recently, a more comprehensive model has been proposed in [99]. The model used a mesh network that considered power system characteristics. Moreover, bidirectional links including data uploading and command downloading chan

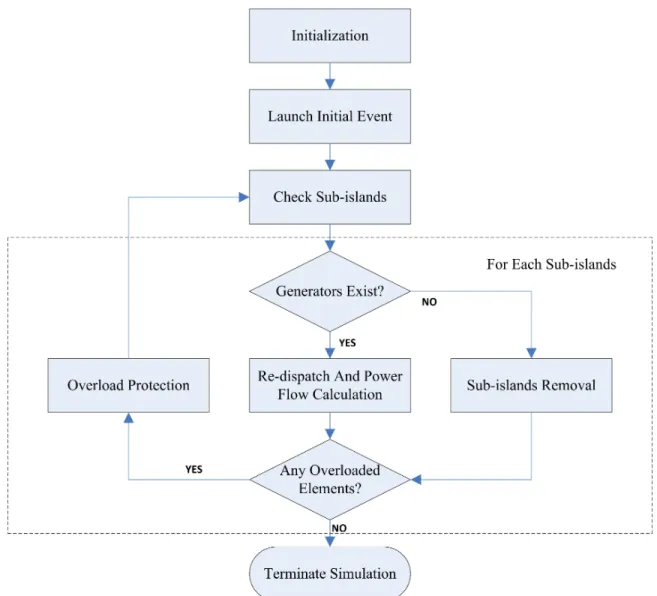
![Fig. 3.5 demonstrates the failure propagation profile of the 2003 North America Blackout, which shows the typical characteristic of two cascade stages [1]](https://thumb-us.123doks.com/thumbv2/123dok_us/250884.2525480/54.918.189.737.307.564/demonstrates-failure-propagation-profile-america-blackout-typical-characteristic.webp)