Abstract: Landslide is one of the major natural hazards which is experienced all over the world and causes huge losses to land and property. Most of the landslides are generally caused by multiple factors which act together to destabilize the slope. But among them, the most common trigger for the landslides have been excessive rainfall and no proper planning have been leading to disastrous outcomes. So, in this research, mostly focus on the landslides which are induced due to rainfall to find a solution to the problem. It is present an overview on the challenges being faced in the prediction of Rainfall induced landslides. Also the objective is to find relevant approaches and techniques and judge the best possible method and algorithms which gives the most accurate results.
Keywords : Support Vectors, Probability, Prediction model, Regression, Risk, Accuracy
I. INTRODUCTION
Very minimal importance is being given to the topic and very less planning is being done in advance regarding it. So, there is a need to find a reliable system through which the occurrence of such hazards could be predicted and the losses imposed because of it could be minimized.
There are already some models which have been proposed but each has some liabilities as well as advantages. There has not been a model which can prove to be fully reliable in such adverse circumstances. The main goal through this research is to analyze the various methods already in use and find out the important functionalities within each system [10].
And today the most widely used method for the prediction related topic is Machine Learning. Machine learning is a way of identifying patterns in data and using them to automatically make predictions or decisions in the future [1].
In this research, to analyzing the various methods and Machine Learning algorithms which have already being implemented and bring out the specific details regarding each model for the Landslide Prediction and also attempting to create a system which can prove to be reliable as well as efficient under such circumstances.
Revised Manuscript Received on December 05, 2019.
* Correspondence Author
K.Uma*,School of Information Technology and Engineering, VIT University, Vellore, India, [email protected]
C.Ramesh Kumar, School of Computing Science and Engineering, Galgotias University, Uttar Pradesh, India.
mail: [email protected]
T.R.Saravanan, Department of CSE, Jeppiaar SRR Engineering college, Chennai-603103, [email protected]
M.Basha Khaja, Wipro Technology, Software engineer, Ireland, United Kingdom, [email protected]
II. LITERATURE SURVEY
A significant number of papers have been reviewed covering the landslide studies from different regions of the world. There are some distinct, different and new methodologies for the problem and each specific approach has its own limitations and advantages. Each journal has been divided into separate tables with column headings containing the methods/Algorithms Used, Factors considered in the Dataset, the final Results and findings of their work, and the final Remarks [13][14].
A. Comparison Analysis
A wide range of models and methods have been used in the various papers according to the dataset which was planned to be used. Some of them had comparisons between the various possible algorithms for finding out the best possible option for their model. But the results were found very contrasting to each other. According to some Support Vector Machines (SVM) was the model giving best probabilities [1].The tree based models such as Logistic Model Tree[2] and Random Forest[4] were also proved to be better in some papers and for some it was Regression and Naïve Bayes giving the best results . Besides these some hybrid algorithms [3][5] have also been used which according to their results were proven to be better than the conventional methods which are mostly used .
Besides these methods, the conventional methods like Artificial Neural Networks (ANN) [8] and Multilayer Perceptron’s [6] are also being used. But these methods were majorly used when one of the factors among the dataset was the Plane Curvature, and were mostly used for the prediction of Slope Instabilities considering the Rate of Displacement of the land as inputs.
Some other unique models such as Rotation Forest Fuzzy Rules Based Classifier Ensemble (RFCE) [7], Wavelet Transform (WT) and the Artificial Bees colony (ABC) were also used but the details about their implementation were not shared.
Every research had their unique set of factors considered for the dataset. Among them, Rainfall and Slope were found to be the most common factors. The factors were chosen taking into consideration as to which location the data has been collected. The weather and climate conditions play a vital role in choosing the factors for a particular place or location. This has been the reason for getting so much disparity among the factors being considered in the various research papers. Some considered Rainfall, Pressure, Wind Speed in the dataset [1],
whereas in some Elevation, Distance from River and Water
Prediction of Rainfall Induced Landslides using
Machine Learning Algorithms
Bodies were chosen [2][7][9]. The Curvature Index and Rate of Displacement of Land were also considered where the movement of the land over time is being mapped. Some different factors like Aspect Ratio, Wetness Index, Water Index [9], Human Settlements/ Activities [3] were being considered. After going through each of the journals, it was found that the choice of the model/ algorithm varied a lot
[image:2.595.54.552.152.469.2]based on the location from where the data has been collected, the factors considered for creating the Dataset and the requirements of the model [15]. So, it is difficult to point out a single method/algorithm which could be proven to be reliable at each and every case.
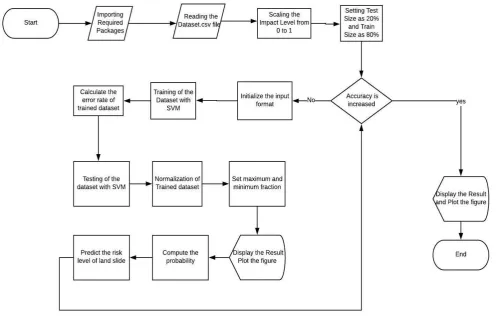
Fig. 1.Process of Data flowchart
Some new hybrid models were also used by fusing multiple models together and the results were found to be better than the existing models today [16]. Cases where adequately long series of reliable data on the required factors and combination of input– output data are available, the Machine Learning algorithms like ANN [8] and Multilayer Perceptron’s [6] gave good results. Also, in most of the cases the tree based approaches like Logistic Model Tree [2] and Random Forest [4] were seen working better than SVM and Regression. While, in some cases [9] Regression and Naïve Bayes were better than Random Forest [17].
A significant number of papers have been analyzed covering the studies from different parts of the world. A wide range of approaches and methodologies were identified and analyzed which varied considerably in physical scale and objectives. Although some methods performed better than others, no single method proved to be superior in all given conditions. So, just by choosing a model would not guarantee a reliable solution to the problem. So, it can be concluded from the literature study that no one singular method is the best and can be relied upon in all the cases [18]. The method or the Machine Learning algorithm should be chosen wisely based on the situation and circumstances, and similarly the required factors for the dataset should be considered [19]
[20].
III. MATERIALS AND METHODS
A. Proposed System
There are various methods and algorithms which could be used for the research. However, some methods perform better than others; no single method proves to be superior in all given conditions. So, just by choosing a model does not guarantee a reliable solution to the problem. Instead a skilled worker with a relatively poor model could still provide good results since there is not a huge difference between the achieved results.
Support Vector Machines proves to be a pretty reliable method which gives pretty decent results. So, SVM has been chosen as our proposed algorithm / method for carrying out the research. Also, since the dataset collected by us has everything which is required to be used in SVM algorithm. The fig.1 shows the flow chart of proposed systems.
Ongoing through the topic thoroughly, it found the following factors and has used them in our Dataset. These factors are Amount of Rainfall
(mm), Maximum Precipitation,
Pressure, Cloud Percentage, Average Wind Speed, Humidity, and Number of days of Consecutive Rainfall, Slope of Curvature and the Impact of the Landslide on a scale of 1 to 3.
B. Data Preprocessing
Set the correct parameters which were required for the dataset and for the system.
Based on the details from gsi.gov [12] and world weather online[11], the landslide data was prepared noting down the required values
For the cleaning, firstly we normalized the string values to integer values for simplification of use by the algorithm.
Also, the null values were removed and the units like ppm, mm were removed to remove ambiguity from the dataset.
SVM proves to be quite good in terms in finding relations among data and better in case of structured data, which our system uses to train itself.
Due to the generalization of the models in SVM, the risk of overfitting is less as compared to other methods
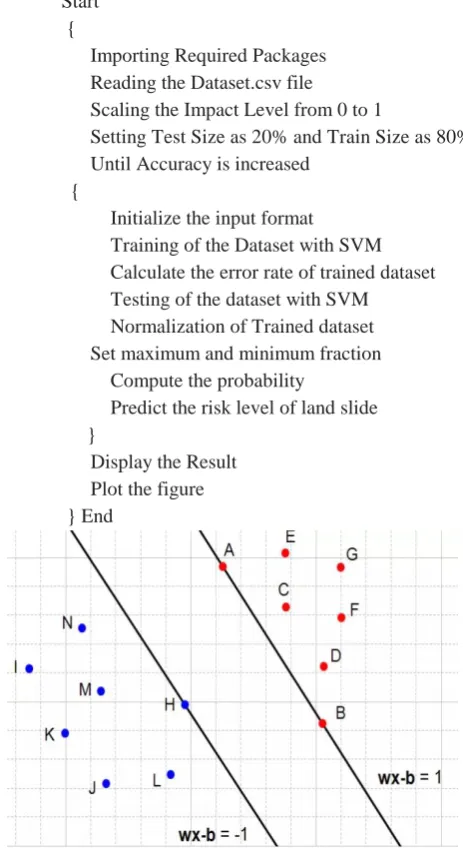
C. Coding Algorithm for Optimal Hyperplane in SVM The optimal hyperplane maximizes the margin between the training data which is used shown in fig.2. Hence, for finding the optimal hyperplane, following steps are followed:
Step1: Consider a dataset D, which need to classify. Let us suppose our data will be composed of n vectors xi. So, each vector xi will also be associated with a value yi which indicates the element belonging to a certain class. The dataset D can be written as the set of n couples of element (xi,yi)
Hence, D can be written as:
D={(xi,yi)∣xi∈Rp,yi∈{−1,1}}ni=1---(1)
Step 2: To select two hyperplanes separating the data with no points between them. So, assuming our dataset D is linearly separable, we can write any hyperplane as the set of points x satisfying
w⋅x+b=0 ---(2) For each vector xi,
w⋅xi+b≥1for xi having the class1 or--- (3)
w⋅xi+b≤−1for xi having the class−1 can be chosen
Step 3: To maximize the distance between the two hyperplanes present, the distance between them,
i.e. m=2/∥w∥ ---(4) Now, the higher the value of norm is, the smaller the margin becomes. Among all the possible hyperplanes which meet the constraints, only the hyperplane with the smallest ‖w‖ is chosen as it will have the biggest margin.
D. Landslide prediction algorithm and Design
The main Detection procedure for landslide prediction algorithm is given as:
Start {
Importing Required Packages Reading the Dataset.csv file
Scaling the Impact Level from 0 to 1
Setting Test Size as 20% and Train Size as 80% Until Accuracy is increased
{
Initialize the input format
Training of the Dataset with SVM Calculate the error rate of trained dataset Testing of the dataset with SVM Normalization of Trained dataset Set maximum and minimum fraction Compute the probability
Predict the risk level of land slide }
[image:3.595.310.542.56.489.2]Display the Result Plot the figure } End
Fig. 2.Hyperplanes
IV. RESULTS AND DISCUSSION
A. Analyzing the data using Histogram
Fig. 3.Analyzing the data using Histogram
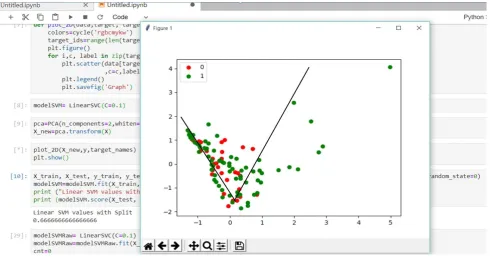
Fig. 4.SVM Classifier for Occurrences and Non-Occurrence
The internal structure of the algorithm involves training of the dataset and calculating the error rate of the trained dataset. Testing of the system is done with the test dataset and normalization of the trained dataset is performed. The probability is computed and the risk level is accessed. The accuracy is checked to have reached its maximum level and it is implemented until the accuracy of the system increases. The green dots represent the occurrence of landslides whereas the
red dots represent the non-occurrence. The figure depicted below Fig.4 depicts the SVM Classifier for Occurrences and Non-Occurrences of the system
It is found out that our model had only a prediction probability of 60-70 percentages which is not that impressive. However, we can say that for a particular range if we say line y=2x divides the graph into two
[image:4.595.52.543.384.642.2]has convincing probability values consisting of only green dots. Also, the line on the leftmost side is not as accurate but there is a slight margin which differentiates the happening and non-happening but it is very risky to as the accuracy is not very high. Hence the leftmost classification cannot be trusted.
V. CONCLUSION
The natural hazards are beyond human control but their destruction can be reduced if prediction mechanisms are carried out in advance. In this research, for creating a system is reliable in these circumstances. Though the results are quite decent but they are not very satisfying considering the risk which is involved in the Prediction. It’s need to be absolutely accurate for providing the results on such topics as a wrong prediction can prove to be very fatal and lead to great losses. The maximum accuracy was found to be 70.1 percent and can be improved with changing the parameters and also by increasing the size of the dataset. With further training and validation of the data, the system can be improved further to be even more precise and to provide more accurate results.
REFERENCES
1. Bui, D.T., Pradhan, B., Lofman, O., Revhaug, I. and Dick, Ø.B.,. Regional prediction of landslide hazard using probability analysis of intense rainfall in the Hoa Binh province, Vietnam. Natural hazards, 66(2), pp.707-730. 2013.
2. Tien Bui, D., Pham, B.T., Nguyen, Q.P. and Hoang, N.D., Spatial prediction of rainfall-induced shallow landslides using hybrid integration approach of Least-Squares Support Vector Machines and differential evolution optimization: a case study in Central Vietnam. International Journal of Digital Earth, 9(11), pp.1077-1097. 2016.
3. Hong, H., Pradhan, B., Xu, C. and Bui, D.T.,. Spatial prediction of landslide hazard at the Yihuang area (China) using two-class kernel logistic regression, alternating decision tree and support vector machines. Catena, 133, pp.266-281. 2015.
4. Zhou, C., Yin, K., Cao, Y. and Ahmed, B.,. Application of time series analysis and PSO–SVM model in predicting the Bazimen landslide in the Three Gorges Reservoir, China. Engineering geology, 204, pp.108-120. 2016.
5. Tien Bui, D., Pradhan, B., Lofman, O. and Revhaug, I.,. Landslide susceptibility assessment in vietnam using support vector machines, decision tree, and Naive Bayes Models. Mathematical problems in Engineering, 2012.
6. Ren, F., Wu, X., Zhang, K. and Niu, R., Application of wavelet analysis and a particle swarm-optimized support vector machine to predict the displacement of the Shuping landslide in the Three Gorges, China. Environmental earth sciences, 73(8), pp.4791-4804. 2015. 7. Chen, W., Pourghasemi, H.R., Panahi, M., Kornejady, A., Wang, J., Xie,
X. and Cao, S.,. Spatial prediction of landslide susceptibility using an adaptive neuro-fuzzy inference system combined with frequency ratio, generalized additive model, and support vector machine techniques. Geomorphology, 297, pp.69-85. 2017.
8. Lee, S., Hong, S.M. and Jung, H.S.,. A support vector machine for landslide susceptibility mapping in Gangwon Province, Korea. Sustainability, 9(1), pp.48. 2017.
9. Goetz, J.N., Brenning, A., Petschko, H. and Leopold, P.,. Evaluating machine learning and statistical prediction techniques for landslide susceptibility modeling. Computers & geosciences, 81, pp.1-11. 2015. 10. Zhou, C., Yin, K., Cao, Y., Ahmed, B. and Fu, X.,. A novel method for
landslide displacement prediction by integrating advanced computational intelligence algorithms. Scientific reports, 8(1), pp.7287. 2018.
11. https://www.gsi.gov.in/webcenter/portal. 12. https://www.worldweatheronline.com/
13. Kothari, U.C. and Momayez, M.,. Machine Learning: A Novel Approach to Predicting Slope Instabilities. International Journal of Geophysics, 2018.
14. Binh, P.T.,. Modeling of Landslide Hazard Assessment Using Geo-Informatics Techniques, 2014.
15. Nayak, M.A. and Ghosh, S.,. Prediction of extreme rainfall event using weather pattern recognition and support vector machine classifier. Theoretical and applied climatology, 114(3-4), pp.583-603. 2013.
16. Dodla, V.B.R. and Ratna, S.B.,. Mesoscale characteristics and prediction of an unusual extreme heavy precipitation event over India using a high resolution mesoscale model. Atmospheric Research, 95(2-3), pp.255-269. 2010.
17. Renuga Devi S, Agarwal P, Venkatesh C, Arulmozhivarman P. Daily Rainfall Forecasting using Artificial Neural Networks for Early Warning of Landslides, IEEE,International Conference on Advances in Computing, Communications and Informatics. Sep. p. 22,pp18–24. 2014
18. Sengupta A, Gupta S, Anbarasu K. Rainfall thresholds for the initiation of landslide at Lanta Khola in north Sikkim, India, National Hazards. Jan, 52(1):pp 31–42. 2010
19. Zhao X, Ji M, Cui X. Research On Landslide Prediction Model Based On Support Vector Model, The International Archives of the Photogrammetry. Remote Sensing and Spatial Information Sciences. Jun; 3:540–4. 2010.