© 2015, IRJET.NET- All Rights Reserved
Page 263
Formulation of Approximate, Generalized Field Data Based
Mathematical Model for PVC Pipe Manufacturing Process
Ashish D Vikhar
1, Dr. J.P.Modak
21
Ph.D. Research Scholar, SGB Amravati University, Amravati, Maharashtra, India
2
Emeritus Professor of Mechanical Engineering, AICTE Emeritus Fellow and Dean (Research & Development),
Priyadarshini College of Engineering, CRPF Campus, Hingna Road, Nagpur, Maharashtra,
---***---Abstract -
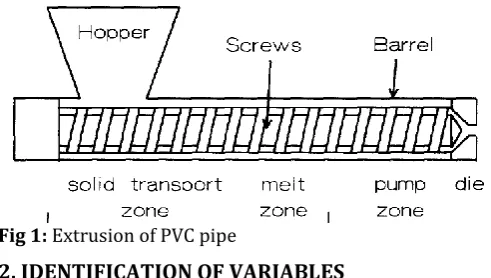
Polyvinyl-Chloride (PVC) is a plasticproduct which has matchless versatility. It effectively replaces wood, paper and metal in several applications. As such plastic pipes have been progressively replacing conventional pipes like G.I., Cast Iron, Asbestos Cement or Stone-ware for a number of important and uses. Among the various types of plastic pipes which are commonly used for such applications PVC pipes are the most widely used all over the world on account of their most favorable balance of properties. PVC pipes are light in weight, rates for use under pressure, easy to install, low frictional loss, low on maintenance cost, and have low frictional loss. PVC pipes have wide variety of uses in fields like city/town/rural water supply scheme, spray irrigation, deep tube well schemes and land drainage schemes. PVC pipes are used for a variety of purposes e.g. water supply schemes, spray irrigation, deep tube well schemes and land drainage schemes. A
need of comprehensive mathematical model
development is always felt important in this system operation and its performance analysis. The theory of experimentation is a good approach of representing the responses in terms of proper interaction of various inputs involved in any phenomenon. by using this approach, the present investigation is to develop
approximate, generalized field databased
mathematical model using dimensional analysis for the pvc pipe extruding operation. Simulation model does not take into account the electrical motor related factors, machine specifications and raw material related information’s. To investigate the effect of these variables on productivity the dimensional analysis is used. The independent variables are identified and are grouped together. The groups formed are electric motor related specifications, extruder machine specifications, specifications of the raw materials, dependent process parameters in pvc pipe plant. The parameters which were constant during the process
were recorded first. The process was planned to record the processing time, pip weight, pipe dimensions, measurement of process parameters and productivity. The model is developed to express the responses as a function of identified inputs. This paper presents a work executed for establishing mathematical model for pvc pipe extrusion process for responses of the system such as dependent process parameters (ΠD1), pipe dimensions (ΠD2), pipe weight (ΠD3) and productivity (ΠD4). The model is a strong estimator to simulate the process.
Key Words:
Field Data Based Mathematical Modeling, PVCExtruder, Dimensional analysis
…
1. INTRODUCTION
© 2015, IRJET.NET- All Rights Reserved
Page 264
Fig 1: Extrusion of PVC pipe2. IDENTIFICATION OF VARIABLES
Data sets contain information, often much more than can be learned from just looking at plots of those data. Models based on observed input and output data (from real life situation) help us abstract and gain new information and understanding from these data sets. When one is studying
any completely physical phenomenon but the
phenomenon is very complex to the extent that it is not possible to formulate a logic based model correlating causes and effects of such a phenomenon, then one is required to go in for the field data based models. In view of the dynamic nature of the context under investigation (which reveals complex phenomenon), it was decided that to formulate a field data based model in the present investigation rather than using a theoretical approach. Generalized field databased models for dependent process parameters (ΠD1), pipe dimensions (ΠD2), pipe weight (ΠD3) and productivity (ΠD4) are established adopting methodology of experimentation [5]. It is planned to collect the data by taking extensive observations in the process of PVC pipe extrusion process. The planning is carried out by using the classical plan of experimentation [6]. The response data is collected based on the entire generalized models. The methodology is briefly stated as follows:
Identification of physical quantities includes the process variables which are independent and dependent. Independent variables are the variables which can be changed without changing other variables of the process. Dependent variables are the variables which can only be
changed by varying one or more independent variables. Dimensional analysis is carried out in two steps (i) Identification of Physical quantities affecting the process, (ii) dimensional consideration & (iii) dimensionless similarity parameters. The process variables for PVC pipe extruder machines were identified and are tabulated in Table1.
Table 1: List of independent and dependent variables
© 2015, IRJET.NET- All Rights Reserved
Page 265
Dimensional analysis was carried out to established dimensional equations, exhibiting relationships between dependent Π terms and independent Π terms using Buckingham Π theorem. Dimensional analysis can be used primarily as an experimental tool to combine many experimental variables into one [1].
The various independent and dependent variables of the system with their symbols and dimensional formulae are given in nomenclature. There are several quite simple
ways in which a given test can be made compact in
operating plan without loss in generality or control. The best known and the most powerful of these is dimensional analysis. In the past dimensional analysis was primarily used as an experimental tool whereby several experimental variables could be combined to form one. The field of fluid mechanics and heat transfer were greatly benefited from the application of this tool [3]. Almost
© 2015, IRJET.NET- All Rights Reserved
Page 266
help. Using this principle modern experiments cansubstantially improve their working techniques and be made shorter requiring less time without loss of control. Deducing the dimensional equation for a phenomenon reduces the number of independent variables in the experiments [4]. The exact mathematical form of this dimensional equation is the targeted model. This is achieved by applying Buckingham’s Π theorem [5] [6].When we apply this theorem to a system involving n independent variables, (n minus number of primary dimensions viz. L, M, T) i.e. (n-4) numbers of Π terms are formed. When n is large, even by applying this theorem number of Π terms will not be reduced significantly than number of all independent variables. Thus much reduction in number of variables is not achieved. It is evident that, if we take the product of the terms it will also be dimensionless number and hence a Π term. This property is used to achieve further reduction of the number of variables. Dimensional analysis is used to reduce the variables and following Pi terms were evolved out of it.
Π1 = Electric motor related variables
=
Π2 = Specifications of extruder machine
=
Π3 = Raw material related data
=
ΠD1 = Dependent process parameters
=
ΠD2 = Pipe dimensions
=
ΠD3 = Pipe weight
ΠD4 = Productivity =
Table 2: Formulation of dimensionless pi terms Pi
term Code
Description of Pi
terms Pi term equation
Π1
C6 Acceleration due to
gravity mm/s2
C3
Diastance of electric
motor from the
extruder machine
C2 Mass or weight of the
electric motor (kg)
C5 Torque on electric
motor (N-mm)
Π2
A12 Weight of extruder
machine (kg)
x
x
x
A5 Hopper capacity (kg)
A1 Extruder machine
length (mm)
A2 Extruder machine
width (mm)
A3 Extruder machine
height (mm)
A4 Barrel centerline
from floor (mm)
A7 Screw outside
diameter (mm)
A8 Screw inside diameter
(mm)
A6 Hopper height (mm)
A9 Screw pitch (mm)
A10 Barrel length (mm)
A11 Barrel diameter (mm)
A14 Die length (mm)
A13 Die diameter or size (mm)
Π3
W1 Resin wastage (kg)
x
x
W2 Dust (kg)
W3 Filter (gm))
W4 Chemical wax (gm)
W5 TBLS powder (gm)
W6 Steric acid (gm)
W7 Wastage raw material size (mm)
W8 Powder size (mm)
W9 Filter material size
(mm)
ΠD1
D1 Screw speed (m/s)
ΠD1= x
x
D2 Melt viscosity
(N-s/m2) or (kg/m-s)
D3 Melt density (kg/m3)
D4 Extruder pressure
(kg/ms2)
D5 Die pressure
© 2015, IRJET.NET- All Rights Reserved
Page 267
D6 Extruder temperature
(0C)
D7 Die temperature (0C)
D8 Pipe diameter or size
(mm)
D9 Pipe wall thickness
(mm)
D10 Pipe weight (kg)
D11 Processing time (sec)
D12 Productivity
Y2 Processing time (sec)
ΠD4 T2 Productivity ΠD4 = x
The main purpose of this technique is making experimentation shorter without loss of control. As per dimensional analysis [1], response variables dependent process parameters (ΠD1), pipe dimensions (ΠD2), pipe
MATHEMATICAL MODELS TERMS OF PI TERM
Three independent pi terms (Π1, Π2, Π3,) and four dependent pi terms (ΠD1, ΠD2, ΠD3, ΠD4,) have been in the design of experimentation and are available for the model formulation. Independent terms = (Π1, Π2, Π3),
Dependent terms = (ΠD1, ΠD2, ΠD3, ΠD4,). Each
dependent is assumed to be function of the available independent terms,
For Process Parameters (ΠD1)
ΠD1 = k1 x (Π1)a1 x (Π2)b1 x (Π3)c1 --- (5) For Pipe Dimensions (ΠD2)
ΠD2 = k2 x (Π2)a2 x (Π2)b2 x (Π3)c2 --- (6) For Pipe Weight (ΠD3)
ΠD3 = k3 x (Π3)a3 x (Π3)b3 x (Π3)c3 --- (7) getting eight unknown terms in the equations,
Log ΠD1 = log k1+ a1log Π1+ b1log Π2+ c1log Π3 --- (9)
Let, Z1= log ΠZ1, K1 = log k1, A = log Π1, B = log Π2 C = log Π3
Putting the values in equations 9, the same can be written as equation 9 so that
Z1 = nK1 + a1*A + b1*B + c1*C
Z1*A = K1*A +a1*A*A + b1*B*A + c1*C*A Z1*B = K1*B +a1*A*B + b1*B*B + c1*C*B Z1*C = K1*C +a1*A*C+ b1*B*C + c1*C*C
In the above set of equations the values of the multipliers K1, a1, b1, c1 are substituted to compute the values of the unknowns (viz. K1, a1, b1, and c1). The values of the terms on L H S and the multipliers of K1, a1, b1, and c1 in the set of equations are calculated. After substituting these values in the above equations one will get a set of 4 equations, which are to be solved simultaneously to get the values of K1, a1, b1, c1,. The above equations can be verified in the matrix form and further values of K1, a1, b1, c1, can be obtained by using matrix analysis.
X1 = inv (W) x P1 ---(11)
The matrix method of solving these equations using ‘MATLAB’ is given below.
W = 4 x4 matrix of the multipliers of K1, a1, b1, c1, d1, e1, f1 and g1
P1 = 4 x 1 matrix of the terms on L H S and
X1 =4 x 1 matrix of solutions of values of K1, a1, b1, and c1 Then, the matrix obtained is given by,
Matrix
The same procedure is adopted for other response variables and after solving this matrix in MATLAB the various models are
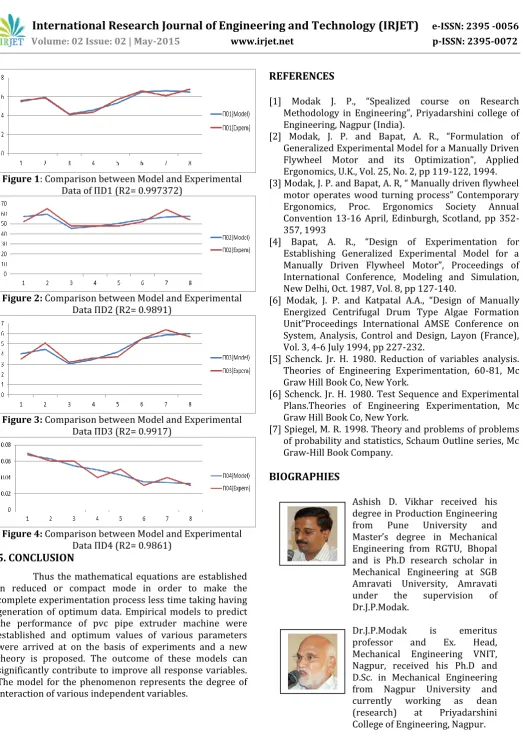
The graphical representation between the actual values of dependent terms and values obtained by model with coefficient of determination are shown in comparative form as below.
© 2015, IRJET.NET- All Rights Reserved
Page 268
Figure 1: Comparison between Model and ExperimentalData of ΠD1 (R2= 0.997372)
Figure 2: Comparison between Model and Experimental Data ΠD2 (R2= 0.9891)
Figure 3: Comparison between Model and Experimental Data ΠD3 (R2= 0.9917)
Figure 4: Comparison between Model and Experimental Data ΠD4 (R2= 0.9861)
5. CONCLUSION
Thus the mathematical equations are established in reduced or compact mode in order to make the complete experimentation process less time taking having generation of optimum data. Empirical models to predict the performance of pvc pipe extruder machine were established and optimum values of various parameters were arrived at on the basis of experiments and a new theory is proposed. The outcome of these models can significantly contribute to improve all response variables. The model for the phenomenon represents the degree of interaction of various independent variables.
REFERENCES
[1] Modak J. P., “Spealized course on Research Methodology in Engineering”, Priyadarshini college of Engineering, Nagpur (India).
[2] Modak, J. P. and Bapat, A. R., “Formulation of Generalized Experimental Model for a Manually Driven Flywheel Motor and its Optimization”, Applied Ergonomics, U.K., Vol. 25, No. 2, pp 119-122, 1994. [3] Modak, J. P. and Bapat, A. R, “ Manually driven flywheel
motor operates wood turning process” Contemporary
Ergonomics, Proc. Ergonomics Society Annual
Convention 13-16 April, Edinburgh, Scotland, pp 352-357, 1993
[4] Bapat, A. R., “Design of Experimentation for Establishing Generalized Experimental Model for a Manually Driven Flywheel Motor”, Proceedings of International Conference, Modeling and Simulation, New Delhi, Oct. 1987, Vol. 8, pp 127-140.
[6] Modak, J. P. and Katpatal A.A., “Design of Manually Energized Centrifugal Drum Type Algae Formation Unit”Proceedings International AMSE Conference on System, Analysis, Control and Design, Layon (France), Vol. 3, 4-6 July 1994, pp 227-232.
[5] Schenck. Jr. H. 1980. Reduction of variables analysis. Theories of Engineering Experimentation, 60-81, Mc Graw Hill Book Co, New York.
[6] Schenck. Jr. H. 1980. Test Sequence and Experimental Plans.Theories of Engineering Experimentation, Mc Graw Hill Book Co, New York.
[7] Spiegel, M. R. 1998. Theory and problems of problems of probability and statistics, Schaum Outline series, Mc Graw-Hill Book Company.
BIOGRAPHIES
Ashish D. Vikhar received his degree in Production Engineering
from Pune University and
Master’s degree in Mechanical Engineering from RGTU, Bhopal and is Ph.D research scholar in Mechanical Engineering at SGB Amravati University, Amravati
under the supervision of
Dr.J.P.Modak.
Dr.J.P.Modak is emeritus
professor and Ex. Head,
Mechanical Engineering VNIT, Nagpur, received his Ph.D and D.Sc. in Mechanical Engineering from Nagpur University and
currently working as dean
(research) at Priyadarshini