Volume 8, No. 5, May-June 2017
International Journal of Advanced Research in Computer Science RESEARCH PAPER
Available Online at www.ijarcs.info
ISSN No. 0976-5697
Comparison of Performance of Different Multi-Resolution Techniques for Image
Denoising
Niranjan Kumar
Dept. of Information Technology BBAU, Lucknow, India
Dhirendra Pandey
Dept. of Information Technology BBAU, Lucknow, India
Abstract: This paper aims in presenting a thorough comparison of performance and usefulness of multi-resolution based de-noising technique. Multi-resolution based image de-noising techniques overcome the limitation of Fourier, spatial, as well as, purely frequency based techniques, as it provides the information of 2-Dimensional (2-D) signal at different levels and scales, which is desirable for image de-noising. The multi-resolution based de-noising techniques, namely, Contourlet Transform (CT), Non Sub-sampled Contourlet Transform (NSCT), Stationary Wavelet Transform (SWT) and Discrete Wavelet Transform (DWT), have been selected for the de-noising of camera images. Further, the comparison of performance of the de-noising techniques have been carried out in terms of different noise variances and by using well defined metrics, such as Peak Signal-to-Noise Ratio (PSNR) and Root Mean Square Error (RMSE). Analysis of result shows that shift-invariant NSCT technique outperforms the CT, SWT and DWT based de-noising techniques in terms of qualitative and quantitative objective evaluation.
Keywords: Image De-noising, multi-resolution Domain Filtering, Non Sub-sampled Contourlet Transform
I. INTRODUCTION
Development in the field of computer and technology have given many exposure to the human which supports easy searching and develop any digital content on the internet. Over the years, the importance of digital images have been recognised and is used in many applications, such as,GIS, astronomy, computer tomography, etc. Images captured by image sensors are usually contaminated by noise. There are various factors accountable for degrading the quality of images such as, imperfect instruments, problems associated with the process of data acquisition, and interfering natural phenomena. Thus, de-noising is to be carried out first, before the digital images can be further utilized and analyzed. The process of de-noising can be accomplished by using efficient de-noising techniques to compensate for such data corruption [1-3].
Analysis of non-stationary image contaminated with time-varying noise, is a difficult task, as their characteristics change with time. Further, non-stationary image cannot be studied efficiently by only spatial and frequency domain representations. Therefore, in order to overcome this weakness, the spatial-scale domain combined with multi-resolution concept has been demonstrated to be a prevailing means for detection and analyzing of spatial-scale properties of non-stationary images in a more descriptive manner [4-6]. Multi-resolution based image de-noising techniques,such as DWT, SWT, CT and NSCT, overcome the shortcomings of the spatial,Fourier and frequency domain based techniques. However, it is found that DWT and SWT suffer from poor directionality, while, CT,from lack of shift invariance. Thus, to resolve the limitation of DWT, SWT and CT, NSCT has been introduced [8-13]. NSCT is the multi-direction and shift-invariant technique which is advantageous in image processing applications, such as, image de-nosing, edge detection, etc.
In the literature, wide range of literature published on image de-noising methods for the de-noising of images, however,
there is no such literature published, which provides a comparitive study of different multi-resolution techniques in terms of different noise models, noise varainces, subjective and objective performances.
Thus, the comparison of performance of multi-resolution techniques in terms of different noise models, variances, subjective and objective performances, is the central theme of this study.
II. IMAGE DE-NOISING TECHNIQUES
Before discussing the image de-noising techniques, first of all, it would be appropriate to discuss in general different types of noises, such as, Salt & Pepper, Poisson, Speckle and Gaussian noise. Salt & pepper noise also known as intensity spikes. It is generated due to errors in transmission of data and mutilation of pixel elements in the camera sensors; error occurs during digitization process, as well as, due to error in memory locations, while Gaussian noise arises due to detectors or amplifiers and is uniformly distributed over the image [5-6]. Here, in this study, Salt and Pepper, Gaussian and Speckle noises have been selected for testing, analysis and implementation purpose.Multi-resolution based image de-noising techniques, such as, NSCT, CT, SWT and DWT, have been selected and implemented. The brief description of DWT, SWT, CT and NSCT based de-noising techniques are discussed below:
A. Image De-noising by Discrete Wavelet Transform
(DWT)
performs an differencing operation to extract the lines, points and edges information of the non stationary image [7-8]. Thereafter, the output of filtering operation is decimated by 2. A 2-D transformation is achieved by performing two individual 1-D transforms. First, the image is filtered along the row and decimated by 2. It is then followed by filtering the sub-image along the column and decimated by 2. This operation splits the image into four bands namely
𝐿𝐿𝐿𝐿,𝐿𝐿𝐿𝐿,𝐿𝐿𝐿𝐿𝑎𝑎𝑎𝑎𝑎𝑎𝐿𝐿𝐿𝐿 respectively[8-10]. The de-noising procedure followed by DWT technique has been explained in the section D.
B. Image De-noising by Stationary Wavelet Transform
(SWT)
In order to resolve the problem of shift-variance associated with DWT, SWT based de-noising technique has been introduced [6-7].It is also known as ‘a` trous’ algorithm. In the SWT algorithm, the filter is up-sampled by inserting zeros between the filter coefficients and eliminating the down-sampling step. Further, it uses a 2-D filter bank obtained from the scaling function, which in turn produces two images, of which one is an approximation image, whereas, the other is a detailed image called the wavelet plane. A wavelet plane contains the horizontal, vertical and diagonal detail between 2j and 2j−1 resolution and is calculated as the difference between two successive approximations Il−1 and Il levels. All the approximation images obtained through this decomposition have equal number of rows and columns as the original image. This is due to the fact that the filters at each stage are up-sampled by inserting zeros between the coefficients, which in turn make the size of the image equal [8-10].The procedure for the de-noising of images by SWT has been explained in the section D.
C. Image De-noising by Contourlet Transform (CT)
To overcome the shortcomings of wavelets and curvelets, [12] proposed a newly method of image representations named contourlets, which is a "true" two dimensional transform that can capture the intrinsic geometrical structures information of images, as well as, provides flexible number of directions. The Contourlet Transform (CT) is a real 2-D transform, which is based on the concept of non-separable filter banks and provides an efficient directional multi-resolution image representation. The foremost two steps by means of which enactment of the CT is carried out: first, the Laplacian Pyramid (LP) is used to seize the point incoherence and then followed by a Directional Filter Bank (DFB) to join point discontinuities into linear structures [11-12]. The procedure for the de-noising of images by CT has been explained in the section D.
D. Image De-noising by Non Sub-sampled Contourlet
Transform (NSCT)
In order to reduce the frequency aliasing of contourlets, to achieve the property of shift-invariance, as well as, enhance directional selectivity, [13] proposed a method known as, Non Sub-sampled Contourlet Transform (NSCT). This is based on the Non Sub-sampled Pyramid Filter Banks (NSPFB) and the Non Sub-sampled Directional Filter Banks (NSDFB) structure. The former provides multi-scale decomposition using two channel non sub-sampled 2-D filter banks, while the later provides directional decomposition, which is used to split Band Pass (BP) sub-bands in each scale into different directions. Since, NSCT is shift-invariant technique, which in turn results in better frequency selectivity and regularity than CT [13-14]. The NSCT structure classify 2-D frequency domain into wedge-shaped directional sub-band as shown in Figure1.
Figure1.Two level NSCT decomposition (a) NSFB structure that implements the NSCT (b) the corresponding frequency partition
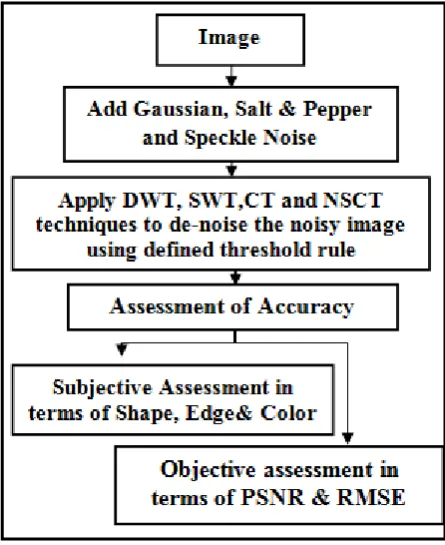
The general methodology adopted for the de-noising of images using DWT, SWT, CT and NSCT based de-noising techniques can be summarized as follows (Figure2);
• Decompose the noisy image into a contourlet and wavelet domain.
• Apply a specific thresholding rule to the coefficients in contourlet and wavelet domain
Figure2. Methodology adopted for image de-noising by DWT, SWT, CT and NSCT techniques
III. EVALUATION CRITERIA
In order to evaluate the quality of the de-noised image other than simple qualitative assessment of the images. Metrics such as, RMSE and PSNR have been used for the assessment of generated de-noised images. The mathematical representation of these measures has been discussed below:
• Root Mean Square Error (RMSE)
RMSE is one of the most usable and effective metric for the estimation of quality of image when reference image is present. RMSE is a good measure of accuracy [15].
𝑅𝑅𝑅𝑅𝑅𝑅𝑅𝑅 =�� ��𝐹𝐹(𝑖𝑖,𝑗𝑗)− 𝑅𝑅𝑜𝑜(𝑖𝑖,𝑗𝑗)� 2
𝑚𝑚×𝑎𝑎 𝑁𝑁
𝑗𝑗=1 𝑅𝑅
𝑖𝑖=1
… (1)
Where, 𝑚𝑚,𝑎𝑎 indicate the size of the image is𝑚𝑚×𝑎𝑎.
𝐹𝐹(𝑖𝑖,𝑗𝑗) and𝑅𝑅𝑜𝑜(𝑖𝑖,𝑗𝑗) indicate the de-noised and reference
image. Smaller the value of RMSE, lesser is the difference between the images.
• Peak Signal-to-Noise Ratio(PSNR)
PSNR is one of the most popular metric used to measure the distortion of the de-noised image compared with the reference image. Large value of PSNR indicates lesser
amount of image distortion, the value of PSNR should be large for better output [15].
𝑃𝑃𝑅𝑅𝑁𝑁𝑅𝑅= 10𝑙𝑙𝑜𝑜𝑙𝑙 �𝑅𝑅𝑅𝑅𝑅𝑅𝑅𝑅255 � 2
… (2)
IV. EVALUATION OF RESULTS AND DISCUSSION
The analysis of results of various image de-noising techniques belonging to multi-resolution techniques has been carried out using camera images. In order to analyze the performance and capability of the de-noising techniques used in this study, it is necessary to perform the assessment of accuracy and review the results. Further, a thorough analysis of the performance of the image de-noising techniques has been carried out for dataset, both visually and quantitatively.
A. Visual (Qualitative) Analysis
The visual comparison of the de-noised images is carried out for the subjective assessment, since, it is a simple, yet one of the effective method for assessing advantages and disadvantages of any de-noising technique. Here, in this study for the simulation purpose, image of size 512 × 512 has been taken. The de-noised images are visually evaluated in terms of different parameters as listed below:
i) Color Radiometry (CR),
ii) Shape of the object (SO)
iii) Edge Sharpening (ES)
[image:3.595.47.270.56.329.2]Further, these parameters have been used for the purpose of visual assessment. For visualization purposes, de-noising techniques have been categorized from “Excellent” to “Poor”, as shown in Table 1.
Table 1 Assessment of quality of image by qualitative method
Grade Absolute Measure Relative Measure
1 Excellent (E) The best in group
2 Good (G) Lower than the excellent level 3 Above Average Better than the average in group 4 Average (A) Average level in group 5 Below Average Lower than the average level 6 Poor (P) The lowest in the group
• Analysis of Image Contaminated with Gaussian Noise
for different noise variances
Original Image Image Contaminated with Gaussian Noise
Image contaminated with Gaussian Noise Variance = 0.10
Image contaminated with Gaussian Noise Variance = 0.15
Image contaminated with Gaussian Noise Variance = 0.20
(a) De-noising by DWT (b) De-noising by DWT (c) De-noising by DWT
(g) De-noising by CT (h) De-noising by CT (i) De-noising by CT
(j) De-noising by NSCT (k) De-noising by NSCT (l) De-noising by NSCT Figure3. De-noised images generated by different De-noising techniques for DS contaminated with Gaussian noise.
With reference to Figure 3 it is observed that the de-noised images generated by NSCT technique (Figure 3 (j), (k) & (l)), for different noise variances exhibit good geometric details, when compared to the original image. This is followed by CT (Figure3 (g), (h) & (i), SWT (Figure3 (d), (e) & (f)), and DWT (Figure3 (a), (b) & (c)) techniques. However, the intensity of color in the de-noised images generated by NSCT is slightly lighter, when compared to the original image, followed by CT, SWT and DWT based de-noising techniques. Further, the de-noised image generated by DWT technique yields lower spatial quality, when compared to NSCT, CT and SWT based
de-noising technique. This is due to the sub-sampling process involved in DWT technique, leading to the introduction of artifacts such as, existence of square blocks, making the linear features zigzag in the image, when images are zoomed in to see very small objects.
• Analysis of Image contaminated with Salt & Pepper
Noise for different noise variances
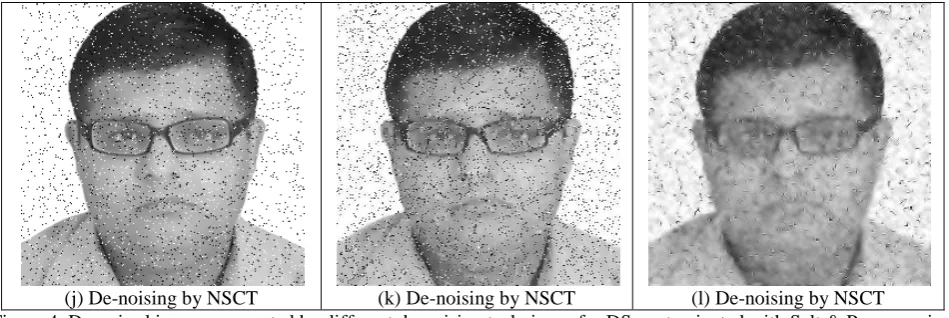
Figure4. shows the de-noised images generated by different de-noising techniques for dataset (DS) contaminated with Salt & Pepper noise, for different noise variances.
Image contaminated with Salt & Pepper Variance = 0.10
Image contaminated with Salt & Pepper Variance = 0.15
Image contaminated with Salt & Pepper Variance = 0.20
(a) De-noising by DWT (b) De-noising by DWT (c) De-noising by DWT
(d) De-noising by SWT (e) De-noising by SWT (f) De-noising by SWT
(j) De-noising by NSCT (k) De-noising by NSCT (l) De-noising by NSCT
Figure 4. De-noised images generated by different de-noising techniques for DS contaminated with Salt & Pepper noise.
With reference to Figure4 it is observed that the de-noised images generated by NSCT (Figure4(j), (k) & (l)), and CT (Figure4(g), (h) & (i)), techniques exhibit good geometric details, when compared to the original image. However, the intensity of color in the de-noised images generated by NSCT technique is slightly lighter, when compared to the original image, followed by SWT (Figure 4(d), (e) & (f)), and DWT (Figure 4(a), (b) & (c)), based de-noising techniques. However, the de-noised image generated by SWT and DWT technique yields lower spatial quality. Amongst the de-noising techniques, DWT yields lowest performance in terms of subjective measure. This may be
due to the limited directional selectivity i.e. horizontal, vertical and diagonal directions possess by the technique, which in turn deteriorate the geometry of the features in the de-noised images.
• Analysis of Image contaminated with Speckle Noise for
different noise variances
Figure5 shows the de-noised images generated by different de-noising techniques for dataset (DS) contaminated with Speckle noise, for different noise variances.
Original Image Image Contaminated with Speckle Noise
Image contaminated with Speckle Noise Variance = 0.10
Image contaminated with Speckle Noise Variance = 0.15
(a) De-noising by DWT (b) De-noising by DWT (c) De-noising by DWT
(d) De-noising by SWT (e) De-noising by SWT (f) De-noising by SWT
(g De-noising by CT (h) De-noising by CT (i) De-noising by CT
(j) De-noising by NSCT (k) De-noising by NSCT (l) De-noising by NSCT Figure5. De-noised images generated by different de-noising techniques for DS contaminated with Speckle noise.
With reference to Figure5 it is observed that the de-noised images generated by NSCT (Figure 5(j), (k) & (l)), and CT (Figure 5(g), (h) & (i)), techniques exhibit good geometric details, when compared to the original image. However, the intensity of color in the de-noised images generated by NSCT technique are slightly lighter, when compared to the
property. The comparison results of different de-noising techniques on the basis of visual object detection are listed
[image:9.595.32.558.109.278.2]inTable 2.
Table 2 Comparison of de-noising techniques on the basis of visual object detection
Dataset Type of Noise
Noise Varianc
e
De-noising Technique
DWT SWT CT NSCT
CR SO ES CR SO ES CR SO ES CR SO ES
DS
GAUSSI AN NOISE
0.10 A A A A A A A AA A G AA AA
0.15 A A A A A AA AA A AA AA AA AA
0.20 BA BA BA A A BA A A A AA AA A
SALT & PEPPER NOISE
0.10 A A A AA A A AA A AA G G AA
0.15 A A A A A AA AA A A AA AA AA
0.20 A A A A A A A A A AA AA AA
SPECKL E NOISE
0.10 A A A AA G AA G A A G G G
0.15 BA A BA A A AA A A A AA AA AA
0.20 BA BA BA BA A A A A A A A A
Table2 shows that NSCT based de-noising technique yields the highest performance for different types of noises for different variances, when compared to CT, SWT and DWT based de-noising techniques. In other words, the background of the de-noised images with NSCT appears smoother and removes the noise pretty well in the smooth regions, as well as, along the edges. Thus, visually, it can be inferred that NSCT de-noising technique for different noise variances works well and yields the better performance in terms of preservation of spectral, spatial and structural similarity information. This is followed by CT, SWT and DWT based de-noising techniques.
B. Quantitative Analysis
The investigation and analysis of results obtained from different de-noising techniques have been carried out using quantitative indicators, as mentioned in the Table 3 It is observed that all types of noises cause degradation in the image quality which in turn results in loss of information. The de-noising of degraded image is performed using NSCT, CT, SWT and DWT techniques. The de-noised image which will best preserve the spectral, spatial and
[image:9.595.310.533.343.440.2]structural similarity information of the original image is the one that has satisfied the following conditions (Table 3). Based on these parameters, the performance and accuracy of the de-noising techniques will be carried out.
Table 3 The ideal and error value of different quantitative indicators
S. No.
Metric Ideal
Value
Error Value
1 Root Mean Square Error (RMSE)
0 > 0
2 Peak Signal-to-Noise Ratio (PSNR)
NA > 1
1) Analysis based on RMSE
Generally, smaller RMSE value represents a greater accuracy measure in terms of image fidelity. The results of RMSE generated by different image de-noising techniques for different datasets are tabulated in Table 4.
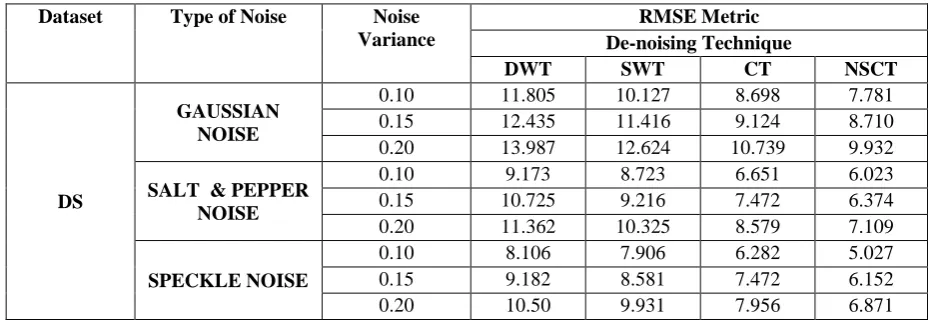
Table 4 shows the comparison of RMSE for dataset (DS) for various noise variances.
Table 4 Comparison of RMSE for DS dataset corrupted with Gaussian, Salt & Pepper and Speckle noise for different noise variances
Dataset Type of Noise Noise
Variance
RMSE Metric De-noising Technique
DWT SWT CT NSCT
DS
GAUSSIAN NOISE
0.10 11.805 10.127 8.698 7.781 0.15 12.435 11.416 9.124 8.710 0.20 13.987 12.624 10.739 9.932
SALT & PEPPER NOISE
0.10 9.173 8.723 6.651 6.023 0.15 10.725 9.216 7.472 6.374 0.20 11.362 10.325 8.579 7.109
SPECKLE NOISE
[image:9.595.64.533.599.761.2]a) Analysis of DS dataset
Analysis of result shows that the Gaussian, Salt & Pepper and Speckle noise affected images are effectively de-noised with NSCT based de-noising technique, as indicated by low RMSE value, when compared to CT, SWT and DWT based de-noising techniques. Amongst de-noising techniques, DWT based de-noising technique exhibits low performance in terms of RMSE metric. This is due to the sub-sampling process involved in DWT technique, leading to the introduction of artifacts such as, existence of square blocks, making the linear features zigzag in the image.
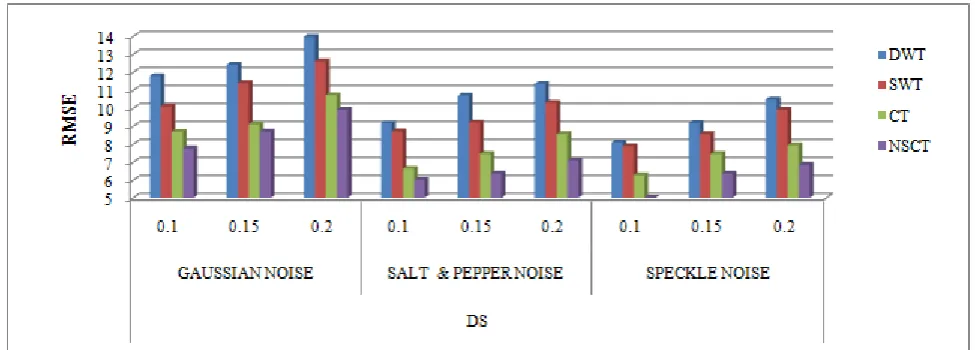
Thus, it can be concluded that NSCT based de-noising technique yields the highest performance in terms of preservation of edge information, when compared to CT, SWT and DWT de-noising techniques. In other words, NSCT technique is suitable for de-noising of images contaminated with Gaussian, Salt & Pepper and Speckle noise, when compared to other based de-noising techniques. The RMSE value corresponding to different de-noising techniques has been plotted for DS, as shown in Figure 6.
Figure6. RMSE values corresponding to different de-noising techniques for Gaussian Noise, Salt & Pepper and Speckle Noise for different noise variances using DS.
2) Analysis based on PSNR
Generally, higher values of PSNR reflect less amount of
[image:10.595.53.541.194.369.2]image distortion. The analysis of PSNR values for different de-noising techniques are tabulated in Table 5.
Table 5 Comparison of PSNR for DS dataset contaminated with Gaussian, Salt & Pepper and Speckle Noise for different noise variances
Data set
Type of Noise Noise Variance PSNR Metric
De-noising Technique
DWT SWT CT NSCT
DS
GAUSSIAN NOISE
0.10 23.919 24.321 25.124 26.058
0.15 22.138 23.859 23.729 24.286
0.20 20.901 21.572 22.271 23.510
SALT & PEPPER NOISE
0.10 24.104 24.519 25.325 26.987
0.15 22.354 23.286 25.286 26.286
0.20 21.216 22.710 23.212 24.257
SPECKLE NOISE
0.10 24.043 24.931 25.746 26.126
0.15 22.875 23.980 24.172 25.980
0.20 21.831 22.026 23.456 24.523
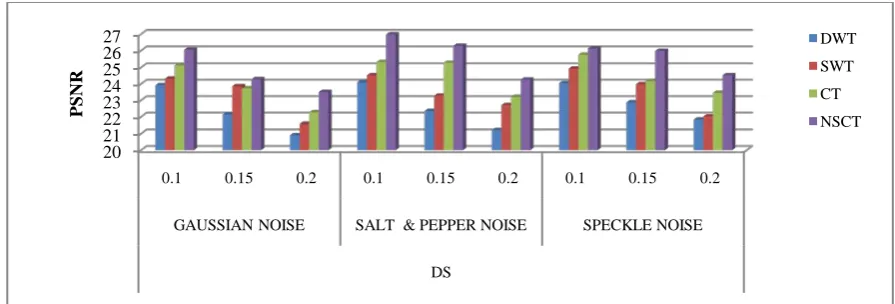
a) Analysis of DS dataset
With reference to Table 5, a high value for PSNR is observed for NSCT based de-noising technique. In other words, NSCT technique produces good quality de-noised image with high PSNR values in comparison to CT, SWT and DWT based noising techniques. Amongst the de-noising techniques, the de-noised image generated by DWT technique yields low values of PSNR. This may be due to the sub-sampling process associated with the DWT technique, leading to the introduction of artifacts in the
techniques outputs corresponding to PSNR values are shown for image in Figure 7.
technique, followed by CT, SWT and DWT based de- noising techniques.
[image:11.595.74.522.76.228.2].
Figure 7 PSNR values corresponding to different de-noising techniques for, Gaussian, Salt & Pepper and Speckle Noise for different noise variances using DS.
V. CONCLUSION
In this study, a comparison of performance of multi-resolution based de-noising techniques has been carried out in terms of different noise models, noise variances, quantitative and qualitative measures. The image is contaminated with Gaussian, Salt & pepper and speckle noises for varying noise variances. Analysis of result shows that de-noising of image by NSCT technique, yields the best result in terms of objective and subjective measures. Further, NSCT technique exhibits good performance in terms of PSNR and RMSE. This may be due to the reason that NSCT technique possesses the property of shift-invariant and multi-directionality, which in turn avoids the introduction of artifacts in the resulting image.
Thus, it can be concluded from this study that analysis and de-noising of 2D signals can be analyzed effectively by using shift-invariant NSCT technique, when compared to CT, SWT and DWT techniques. The outcome of this study could therefore be utilized for further image processing tasks.
REFERENCES
1. Jensen, J.R., 1988. Introductory Digital Image Processing: A Remote Sensing Perspective.Prentice Hall, New Jersey. 2. A.K. Jain, 1989. Fundamentals of digital image processing.
Prentice-Hall.
3. Gonzalez, R.C. and Woods, R. E., 2002. Digital Image Processing. Second Edition, Pearson Education Asia. 4. Lu, J., Weaver, J. B., Healy, D.M. and Xu, Y., 1992. Noise
reduction with multiscale edge representation and perceptual criteria,” in Proc. IEEE-SP Int. Symp. Time- Frequency and Time-Scale Analysis, Victoria, BC, 555–558.
5. Yang, R., Yin, L., Gabbouj, M., Astola, J. and Neuvo, Y., 1995. Optimal weighted median filters under structural constraints. IEEE Transaction Signal Processing, 43, 591– 604.
6. Moulin, P. and Liu, J., 1999. Analysis of multi-resolution image de-noising schemes using generalized Gaussian and complexity priors. IEEE Information Theory, 45(3), 909-919. 7. Mallat, S. G. and Hwang, W. L., 1992. Singularity detection
and processing with wavelets. IEEE Transactkion Information Theory, 38, 617–643.
8. Donoho, D. L., 2000. De-noising by soft-thresholding. IEEE Transaction Information Theory, 41(3), 613- 627.
9. Coifman, R. and Donoho, D., 1995. Translation invariant de-noising. in Lecture Notes in Statistics: Wavelets and Statistics, New York: Springer-Verlag, 125- 150.
10. Bui, T. D. and Chen, G. Y., 1998. Translation-invariant De-noising using multi-wavelets. IEEE Transactions on Signal Processing, 46 (12), 3414-3420.
11. Bamberger, R. H., & Smith, M. J. T., 1992. A filter bank for the directional decomposition of images: Theory and design. IEEE Transaction Signal Processing, 40(4), 882–893.
12. Do, M.N. and Vetterli, M., 2005. The contourlet transform: an efficient directional a multi-resolution image representation. IEEE Transactions on Image Processing, 14(12), 2091-2106. 13. Cunha, A.L., Zhou, J. and Do, M.N., 2005. Non sub sampled
Contourlet Transform: Filter Design and Applications in De-noising. In IEEE International Conference on Image Processing, 1, pp. 749-752.
14. Cunha, A.L., Zhou, J. and Do, M.N., 2006. The Non Sub- sampled Contourlet Transform: Theory, Design and Applications.IEEE Transactions on Image Processing, 15(10), 3089-3101.
15. Li, S., Li, Z. and Gong, J., 2010. Multi-variate statistical analysis of measures for assessing the quality of image fusion. International Journal of Image and Data Fusion, 1(1), 47–66. 20 21 22 23 24 25 26 27
0.1 0.15 0.2 0.1 0.15 0.2 0.1 0.15 0.2
GAUSSIAN NOISE SALT & PEPPER NOISE SPECKLE NOISE