Fatigue Life Estimation of Local Sharp-grooved
Circular Tubes with Different
Diameter-to-thickness Ratios under Cyclic Bending
Kuo-Long Lee1, and Wen-Fung Pan2
1
Department of Innovative Design and Entrepreneurship Management, Far East University, Tainan 744, Taiwan
2
Department of engineering Science, National Cheng Kung University, Tainan 701, Taiwan
Abstract
In this paper, the fatigue life estimation of local sharp-grooved 6061-T6 aluminum alloy tubes with different diameter-to-thickness ratios under cyclic bending are studied. Different diameter-to-thickness ratios of 16.5, 31.0 and 60.0 were considered. The experimental results revealed that the moment-curvature relationship exhibited an almost steady loop from the beginning of the first cycle. Due to small and localized grooves, the groove depth showed almost no influence on the moment-curvature relationship for local sharp-grooved 6061-T6 aluminum alloy tubes with a certain diameter-to-thickness ratio. In contrast, the ovalization-curvature relationship depicted an increasing and ratcheting way along with the bending cycle, whilethe groove depth showed a strong influence on this relationship. In addition, the finite element software ANSYS was used to analyze the moment-curvature and ovalization-curvature relationships. Through comparison with the experimental data, the ANSYS could properly simulate the experimental findings. Because the failure type was the fatigue fracture, the ANSYS was used to calculate the maximum and minimum stresses and strains for each cyclic bending case. Finally, according to the distribution of stress or strain amplitudes and fatigue life on a log-log scale, relevant fatigue models were proposed.
Keywords: Local Sharp-grooved 6061-T6 Aluminum Alloy Tubes, Different Diameter-to-thickness Ratios, Groove Depths, Cyclic Bending, Moment, Curvature, Ovalization, Finite Element ANSYS Analysis, Fatigue Life, Fatigue Models.
1. Introduction
In 1998, Pan et al. [1] designed and set up a new measurement apparatus. The apparatus was used with a cyclic bending machine to study various types of tube under different cyclic bending conditions. For examples: Pan and Fan [2] studied the effect of the prior curvature rate at the preloading stage on subsequent creep or relaxation behavior, Pan and Her [3] investigated the response and stability of 304 stainless steel tubes that were subjected to cyclic bending with different curvature rate, Lee et al. [4] studied the influence of the diameter-to-thickness ratio on the response and collapse of circular tubes under symmetrical cyclic bending, Lee et al. [5] experimentally explored the effect of the diameter-to-thickness ratio and curvature rate on the response and stability of circular tubes subjected to cyclic bending, Chang et al. [6] studied the mean moment effect on circular, thin-walled tubes under cyclic bending, and Chang and Pan [7] discussed the buckling life estimation of circular tubes subjected to cyclic bending.
Fig. 1 A picture of the circumferential sharp-notched tube.
Later, Lee et al. [13] studied the response and failure life of 6061-T6 aluminum alloy tubes with a local sharp notch (Fig. 2) subjected to cyclic bending. In addition, the finite element software ANSYS was employed to analyze the moment-curvature and ovalization-curvature relationships. Lee et al. [14] investigated the response and stability of SUS304 stainless steel tubes with local sharp-notched (Fig. 3) depths of 0.2, 0.4, 0.6, 0.8, and 1.0 mm and notch directions of 0°, 30°, 60°, and 90° under cyclic bending. Finite element analysis via ANSYS was used to simulate the moment-curvature and ovalization-curvature relationships, and an empirical model was proposed to simulate the controlled curvature-number of cycles required to ignite buckling relationship.
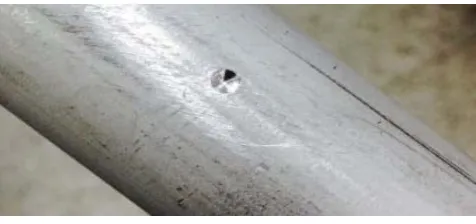
Fig. 2 A picture of the local sharp-notched (sharp-cut) tube.
Fig. 3 A picture of the local sharp-notched (sharp-grooved) tube.
2. Experiments
2.1 Experimental Devices
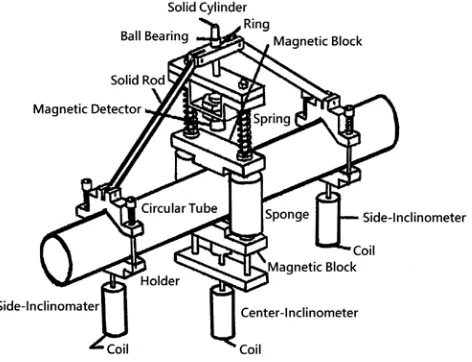
Fig. 4 schematically shows the experiment executed by a specially built tube-bending machine. This facility was set up to conduct monotonic, reverse, and cyclic bending tests. A detailed explanation of the experimental facility can be found in many papers (e.g., Pan and Her [3], Lee et al. [4]). Pan et al. [1] designed a new light-weight apparatus to measure the curvature and ovalization of the tube shown in Fig. 5. Two side-inclinometers in the apparatus were used to detect the angle variation of tubes during cyclic bending. The value of curvature can be obtained by a easy calculation according to angle changes.
Fig. 4 A schematic drawing of the tube-bending machine.
Fig. 5 A schematic drawing of the curvature-ovalization measurement apparatus.
2.2 Material and Specimens
6061-T6 aluminum alloy tubes were adopted for the cyclic bending tests. The tubes’ chemical composition (weight %) is Mg (0.937), Si (0.535), Fe (0.139), Zn (0.098), Mn (0.022), Cr (0.022), …., and a few other trace elements, with the remainder being Al. The 0.2% strain offset yield stress is 285 MPa, the ultimate tensile stress is 320 MPa and the percent elongation is 23 %.
The raw, smooth 6061-T6 aluminum alloy circular tubes had a length Lo of 800 mm, a Do of 35.0 mm and a t of 3.0 mm. The raw tubes
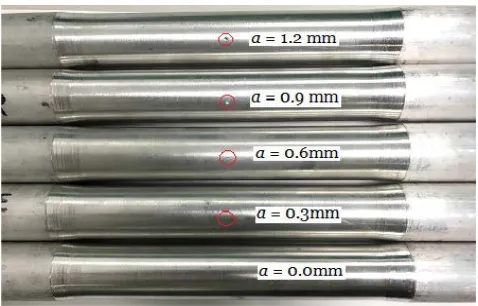
were machined on the outside surface to obtain the desired Do/t ratios of 16.5, 31.0 and 60.0 as shown in Fig. 6. Next, tubes with a
certain Do/t ratio were processed on the outside surface again to obtain the desired shape and depth of the groove. Fig. 7 shows a
respectively. Note that a = 0.0 mm represents a tube with a smooth surface. Fig. 8 shows a picture of local sharp-grooved 6061-T6 aluminum alloy tubes with Do/t = 16.5 and a = 0.0, 0.3, 0.6, 0.9 and 1.2 mm.
Fig. 6 A schematic drawing of tube’s dimensions for Do/t ratios of 16.5, 31.0 and 60.0.
2.3 Test Procedures
The test involved a curvature-controlled cyclic bending. The controlled-curvature ranges were from ± 0.2 to ± 1.3 m-1, and the curvature rate of the cyclic bending test was 0.035 m-1s-1. The magnitude of the moment was measured by two load cells mounted to the bending device. The magnitude of the curvature and ovalization were controlled and measured by the curvature-ovalization measurement apparatus. In addition, the the number of bending cycles required to ignite failure was also recorded.
Fig. 7 A schematic drawing of the local sharp-grooved circular tube.
3. Finite Element ANSYS Analysis
The mechanical behavior of local sharp-grooved circular tubes subjected to cyclic bending was numerically analyzed using the finite element software ANSYS. The mechanical behavior of tubes presented the relationship between moment and curvature, as well as that between ovalization and curvature. The elastic-plastic stress-strain response, model, mesh, boundary conditions, and loading conditions are introduced in next sections.
3.1 Elastic-plastic Stress-strain Curves
Fig. 9 shows the tested and ANSYS- constructed uniaxial stress (σ)-strain (ε) curves of the 6061-T6 aluminum alloy steel. The kinematic hardening rule was used as the hardening rule for reverse and cyclic loading.
3.2 ANSYS Element and Model
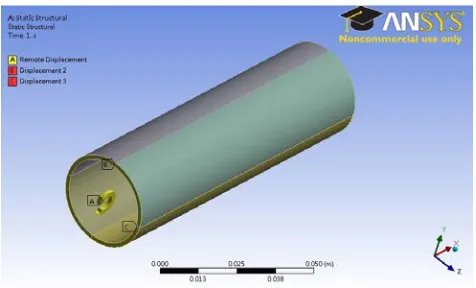
Owing to the three-dimensional geometry and elastic-plastic deformation of the tube, the SOLID 185 element was used for relative analysis. This element is a tetrahedral element built in ANSYS that is suitable for analyzing plastic and large deformations. In particular, this element is adequate for analyzing shell components subjected to bending. Owing to the right-left symmetry of tubes, only half of the tube model was constructed. Fig. 10 shows the mesh constructed by ANSYS.
Fig. 9 Tested and ANSYS-constructed data of the uniaxial σ-ε curve for 6061-T6 aluminum alloy.
Fig. 10 Mesh constructed by ANSYS for half tube.
3.3 Boundary and Loading Conditions
Fig. 13 demonstrates a tube subjected to pure bending. The rotation angle θ for the curvature-controlled cyclic bending was used as the input data, and curvature (κ) was related to θas follows:
κ = 1 / ρ = 2θ / Lo, (1) where ρ is the radius of the curvature, and Lo is the original tube length.
Fig. 11 Restrictions on the symmetrical plane constructed by ANSYS.
Fig. 13 Relationship between θ and κ for a tube under pure bending.
4. Experimental and Simulated Results
4.1 Mechanical Response
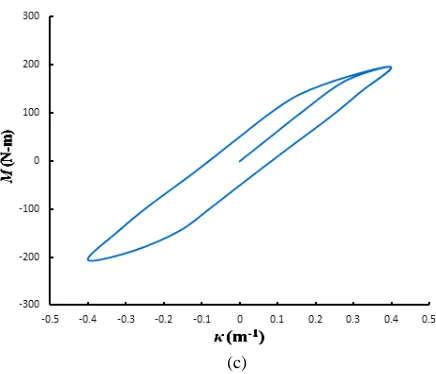
Figs. 14(a)-(c) shows typical sets of experimentally determined cyclic moment (M)-curvature (κ) curves for local sharp-grooved 6061-T6 aluminum alloy circular tubes with a = 0.3 mm and Do/t = 16.5, 31.0 and 60.0, respectively, subjected to cyclic bending. The tubes were cycled between κ = ±0.4 m-1. It was observed that the M-κ relationship was seen to be characterized by a nearly closed and steady hysteresis loop from the first bending cycle. Since the sharp groove is small and local, the groove depth has almost no influence on the
M-κ curve. Therefore, the M-κ curves for different as and Do/t ratios are not shown in this paper. Figs. 15(a)-(c) show the M-κ curves of
Figs. 14(a)-(c) as simulated by ANSYS.
(a)
(c)
Fig. 14 Experimental M-κ curves for local sharp-grooved 6061-T6 aluminum alloy tubes with a = 0.3 mm and Do/t = (a) 16.5,
(b) 31.0 and (c) 60.0 under cyclic bending.
(a)
(c)
Fig. 15 ANSYS-simulated M-κ curves for local sharp-grooved 6061-T6 aluminum alloy tubes with a = 0.3 mm and Do/t = (a) 16.5, (b) 31.0
and (c) 60.0 under cyclic bending.
Figs. 16(a)-(e) depict the experimental ovalization (ΔDo/Do)-curvature (κ) curves for local sharp-grooved 6061-T6 aluminum alloy tubes
with Do/t = 16.5 and a = 0.0, 0.3, 0.6, 0.9, and 1.2 mm, respectively, subjected to cyclic bending. The tubes were also cycled between κ =
±0.4 m-1. The ΔDo/Do-κ relationships exhibited a ratcheting and an increasing trend with the number of bending cycles. A larger a led to a more asymmetrical appearance of the ΔDo/Do-κ relationship. Moreover, a larger a of the sharp-grooved tubes caused a larger ovalization. Figs. 17(a)-(e) demonstrate the ANSYS-simulated ΔDo/Do-κ curves for local sharp-grooved 6061- T6 aluminum alloy tubes
with Do/t = 16.5 and a = 0.0, 0.3, 0.6, 0.9, and 1.2 mm, respectively, under cyclic bending.
(a) (b)
(c) (d)
Fig. 16 Experimental ∆Do/Do-κ curves for local sharp-grooved 6061-T6 aluminum alloy tubes with Do/t = 16.5 and a = (a) 0.0, (b) 0.3, (c) 0.6,
(d) 0.9 and (e) 1.2 mm under cyclic bending.
(a) (b)
(c) (d)
(e)
Fig. 17 ANSYS-simulated ∆Do/Do-κ curves for local sharp-grooved 6061-T6 aluminum alloy tubes with Do/t = 16.5 and a = (a) 0.0, (b) 0.3, (c) 0.6, (d)
0.9 and (e) 1.2 mm under cyclic bending.
Figs. 18(a)-(e) depict the experimental ∆Do/Do-κ curves for local sharp-grooved 6061-T6 aluminum alloy tubes with Do/t = 31.0 and a
= 0.0, 0.15, 0.3, 0.45, and 0.6 mm respectively, subjected to cyclic bending. Figs. 20(a)-(e) show the experimental ∆Do/Do-κ curves for local sharp- grooved 6061-T6 aluminum alloy tubes with Do/t = 60.0 and a = 0.0, 0.08, 0.15, 0.23, and 0.3 mm, respectively, under cyclic bending. Similar phenomena with local sharp-grooved 6061-T6 aluminum alloy tubes with Do/t = 16.5 were found. In addition, a
larger Do/t ratio has a smaller t, thus, the ∆Do/Do increases faster. Figs. 19(a)-(e) depict the ANSYS-simulated ∆Do/Do-κ curves for
local sharp-grooved 6061-T6 aluminum alloy tubes with Do/t = 31.0 and a = 0.0, 0.15, 0.3, 0.45, and 0.6 mm respectively, under cyclic bending. Figs. 21(a)-(e) show the ANSYS-simulated ∆Do/Do-κ curves for local sharp-grooved 6061-T6 aluminum alloy tubes with Do/t
= 60.0 and a = 0.0, 0.08, 0.15, 0.23, and 0.3 mm, respectively, subjected to cyclic bending.
(c) (d)
(e)
Fig. 18 Experimental ∆Do/Do-κ curves for local sharp-grooved 6061-T6 aluminum alloy tubes with Do/t = 31.0 and a = (a) 0.0, (b) 0.15, (c) 0.3,
(d) 0.45 and (e) 0.6 mmunder cyclic bending.
(a) (b)
(c) (d)
(e)
Fig. 19 ANSYS-simulated ∆Do/Do-κ curves for local sharp-grooved 6061-T6 aluminum alloy tubes with Do/t = 31.0 and a = (a) 0.0, (b) 0.15, (c) 0.3, (d)
(a) (b)
(c) (d)
(e)
Fig. 20 Experimental ∆Do/Do-κ curves for local sharp-grooved 6061-T6 aluminum alloy tubes with Do/t = 60.0 and a = (a) 0.0, (b) 0.08, (c) 0.15, (d)
0.23 and (e) 0.3 mmunder cyclic bending.
(a) (b)
(e)
Fig. 21 ANSYS-simulated ∆Do/Do-κ curves for local sharp-grooved 6061-T6 aluminum alloy tubes with Do/t = 60.0 and a = (a) 0.0, (b) 0.08, (c) 0.15,
(d) 0.23 and (e) 0.3 mm under cyclic bending.
4.2 Fatigue Failure
We discovered that the failure type of local sharp-grooved 6061-T6 aluminum alloy tubes under cyclic bending was the fatigue fracture. Because the finite element ANSYS could accurately simulate the M-κ and ΔDo/Do-κ relationships (Figs. 15(a)-(c), Figs. 17(a)-(e), Figs. 19(a)-(e) and Figs. 21(a)-(e)), so the ANSYS was used to calculate the maximum stress (σmax), minimum stress (σmin), maximum
strain (εmax) and minimum strain (εmin) for each cyclic bending case. Figs. 22(a)-(b) respectively show the stress and strain distribution of
local sharp-grooved 6061-T6 aluminum alloy tubes with Do/t =16.5 and a = 0.3 mm. The κ is +0.32 m-1. The σmax and εmax are 94.777
MPa and 0.0024548 at the groove, respectively.
Tables 1 show the σmax and σmin for local sharp-grooved 6061-T6 aluminum alloy circular tubes with Do/t =16.5 subjected to cyclic
bending and Tables 2 show the εmax and εmin for local sharp-grooved 6061-T6 aluminum alloy circular tubes with Do/t =16.5 subjected
to cyclic bending. The amount of a and κ are also demonstrated in these tables. The magnitudes of stress and strain were determined by ANSYS discussed in Sec. 3.Due to the symmetrical curvature-controlled cyclic bending (the maximum control curvature equals to the minimum control curvature) and a local and small groove, the amounts of maximum and minimum stresses and strains were not much difference for each loading case. Therefore, the mean stress effect did not consider in the fatigue analysis.
(a) (b)
Fig. 22 The (a) stress and (b) strain distribution of local sharp-grooved 6061-T6 aluminum alloy tubes with Do/t =16.5, a = 0.3 mm
and κ = +0.3 m-1.
Table 1 σmax and σmin for local sharp-grooved 6061-T6 aluminum alloy circular tubes with Do/t =16.5 under cyclic bending.
a (mm) κ(m-1) σmax (MPa) σmin (MPa)
0.3 0.35 158.452 -178.681 0.3 0.40 173.852 -182.130 0.3 0.55 215.221 -220.171 0.3 0.68 237.123 -245.042 0.6 0.30 104.563 -120.461 0.6 0.33 132.436 -158.560 0.6 0.39 164.601 -185.612 0.6 0.42 191.631 -207.043 0.6 0.46 208.853 -215.844 0.6 0.70 237.416 -250.211 0.9 0.34 162.752 -185.540 0.9 0.39 207.422 -224.023 0.9 0.47 212.538 -219.191 0.9 0.61 244.676 -248.697 1.2 0.30 157.079 -171.796 1.2 0.33 209.045 -212.484 1.2 0.35 220.478 -226.621 1.2 0.42 235.916 -238.483 1.2 0.50 244.522 -247.145
Table 2 εmax and εmin for local sharp-grooved 6061-T6 aluminum alloy circular tubes with Do/t =16.5 under cyclic bending.
a (mm) κ(m-1) εmax (× 10-3) εmin (× 10-3)
Fig. 23 shows the experimental data of the stress amplitude (σa) versus 2Nf in solid black circles for local sharp-grooved 6061-T6
aluminum alloy circular tubes with different Do/t ratios subjected to cyclic bending on a log-log scale. Note that σa = (σmax - σmin) / 2. It
was observed that although all data can be considered to be in a straight line, all the data seems to be a bit scattered.
A simple fatigue model was proposed to be
b a (2Nf)
' f
σ
σ = (2) or
) 2 log( log
log ' f
f b N
a= σ +
σ (3)
where ' f
σ and b are the fatigue strength coefficient and fatigue strength exponent, respectively. The straight line in Fig. 23 was determined by least-square fit. The magnitudes of '
f
σ and b were determined to be 294.118 MPa and -0.2167, respectively.
Fig. 23 Experimental and simulated σa-2Nfrelationships for local sharp-grooved 6061-T6 aluminum alloy circular tubes with different Do/t ratios under
cyclic bending on a log-log scale.
Fig. 24 shows the experimental data of the strain amplitude (εa) versus 2Nf in solid black circles for local sharp-grooved 6061-T6
aluminum alloy circular tubes with different Do/t ratios subjected to cyclic bending on a log- log scale. Note that εa = (εmax - εmin) / 2. It
can be seen in Fig. 24 that the experimental εa-Nf data were almost in a straight line. Therefore, a simple fatigue model was proposed to
be
c a (2Nf)
' f ε
ε = (4) or ) 2 log( log log f '
f c N
a= ε +
ε (5)
where ' f
ε and c are the fatigue ductility coefficient and fatigue ductility exponent, respectively. The straight line in Fig. 24 was determined by least-square fit. The magnitudes of '
f
ε and c were determined to be 0.01407 and -0.2576, respectively.
Fig. 24 Experimental and simulated εa-2Nf relationships for local sharp-grooved 6061-T6 aluminum alloy circular tubes with different Do/t ratios under
5. Conclusions
This study investigated the response and failure of the local sharp-grooved 6061-T6 aluminum alloy tubes with different Do/t ratios submitted to cyclic bending. Some important conclusions are sorted as follows according to the experimental and simulated results: (1) The experimental M-κ relationship for local sharp-grooved 6061-T6 aluminum alloy tubes with any a or Do/t ratio displayed a closed
hysteresis loop from the first bending cycle. Since the sharp groove was small and local, the a had almost no influence on the M-κ curve for a certain Do/t ratio.
(2) The experimental ΔDo/Do-κ relationship for local sharp-grooved 6061-T6 aluminum alloy tubes with any Do/t ratio or a revealed an increasing and ratcheting trend with the number of bending cycles. In addition, the tubes with a larger Do/t or a led to more asymmetrical trend and a larger ovalization.
(3) Using adequate stress-strain curve, mesh, boundary conditions and loading conditions, the finite element software ANSYS was used for simulating the behavior of local sharp-grooved circular tubes under cyclic bending; this behavior included the M-κ and ΔDo/Do-κ
relationships. The simulated results exhibited close correspondence to those obtained from experiments.
(4) According to the εa-2Nf relationship for local sharp-grooved 6061-T6 aluminum alloy circular tubes with different Do/t ratios under
cyclic bending. A simple fatigue model (Eq. (4)) was proposed and parameters ' f
ε and c were determined to be 0.01407 and -0.2576, respectively. It was found that the simulation was in good agreement with the experimental result as shown in Fig. 24.
Acknowledgment
The work presented was carried out with the support of the National Science Council under grant MOST 105-2221-E-006-073. Its support is gratefully acknowledged.
References
[1] W. F. Pan, T. R. Wang and C. M. Hsu, “A curvature-ovalization measurement apparatus for circular tubes under cyclic bending,” Exp. Mech., Vol. 38, No. 2, 1998, pp. 99-102.
[2] W. F. Pan and C. H. Fan, “An experimental study on the effect of curvature-rate at preloading stage on subsequent creep or relaxation of thin-walled tubes under pure bending,” JSME Int. J., Ser. A, Vol. 41, No. 4, 1998, pp. 525-531.
[3] W. F. Pan and Y. S. Her, “Viscoplastic collapse of thin-walled tubes under cyclic bending,” J. Eng. Mat. Tech., Vol. 120, No. 4, 1998, pp. 287-290.
[4] K. L. Lee, W. F. Pan and J. N. Kuo, “The influence of the diameter-to-thickness ratio on the stability of circular tubes under cyclic bending,” Int. J. Solids Struct., Vol. 38, No. 14, 2001, pp. 2401-2413.
[5] K. L. Lee, W. F. Pan and C. M. Hsu, “Experimental and theoretical evaluations of the effect between diameter-to- thickness ratio and curvature-rate on the stability of circular tubes under cyclic bending,” JSME Int. J., Ser. A, Vol. 47, No. 2, 2004, pp. 212-222. [6] K. H. Chang and W. F. Pan and K. L. Lee, “Mean moment effect of thin-walled tubes under cyclic bending,” Struct. Eng. Mech.,
Vol. 28, No. 5, 2008, pp. 495-514.
[7] K. H. Chang and W. F. Pan, “Buckling life estimation of circular tubes under cyclic bending,” Int. J. Solids Struct., Vol. 46, No. 2, 2009, pp. 254-270.
[8] K. L. Lee, C. Y. Hung and W. F. Pan, “Variation of ovalization for sharp-notched circular tubes under cyclic bending,” J. Mech., Vol. 26, No. 3, 2010, pp. 403- 411.
[9] K. L. Lee, “Mechanical behavior and buckling failure of sharp-notched circular tubes under cyclic bending,” Struct. Eng. Mech., Vol. 34, No. 3, 2010, pp. 367-376.
[10] K. L. Lee, C. M. Hsu and W. F. Pan, “Viscoplastic collapse of sharp-notched circular tubes under cyclic bending,” Acta Mech. Solida Sinica, Vol. 26, No. 6, 2013, pp. 629-641.
[11] K. L. Lee, C. M. Hsu and W. F. Pan, “Response of sharp-notched circular tubes under bending creep and relaxation,” Mech. Eng. J., Vol. 1, No. 2, 2014, pp. 1-14.
[12] C. C. Chung, K. L. Lee and W. F. Pan, “Collapse of sharp-notched 6061-T6 aluminum alloy tubes under cyclic bending,” Int. J. Struct. Stab. Dyn., Vol. 26, No. 7, 2016, 1550035 [24 pages].
[13] K. L. Lee, K. H. Chang and W. F. Pan, “Failure life estimation of sharp-notched circular tubes with different notch depths under cyclic bending,” Struct. Eng. Mech., Vol. 60, No. 3, 2016, pp. 387-404.
[14] K. L. Lee, K. H. Chang and W. F. Pan, “Effects of notch depth and direction on stability of local sharp-notched circular tubes subjected to cyclic bending,” Int. J. Struct. Stab. Dyn., Vol. 18, No. 7, 2018, 1850099 [23 pages].
Kuo-Long Lee received the Ph.D. degree in Dept. of Engineering Science from National Cheng Kung University in Taiwan in 2000. Currently working as Prof. in Dept. of Innovative Design and Entrepreneurship from Far East University in Taiwan.