78:2–2 (2016) 27–33 | www.jurnalteknologi.utm.my | eISSN 2180–3722 |
Jurnal
Teknologi
Full Paper
S
PEECH
E
MOTION
C
LASSIFICATION
U
SING
SVM
AND
MLP
ON
P
ROSODIC AND
V
OICE
Q
UALITY
F
EATURES
Inshirah Idris
a, Md Sah Hj Salam
b*, Mohd Shahrizal Sunar
ca
Computer Science Department, Sudan University of Science and
Technology, Khartoum, Sudan
b
Software Engineering Department, Universiti Teknologi Malaysia,
81310 UTM Johor Bahru, Johor, Malaysia
c
UTM-IRDA Digital Media Centre, Universiti Teknologi Malaysia,
81310 UTM Johor Bahru, Johor, Malaysia
Article history
Received
15 June 2015
Received in revised form
1 October 2015
Accepted
13 October 2015
*Corresponding author
[email protected]
Graphical abstract
Abstract
In this paper, a comparison of emotion classification undertaken by the Support Vector Machine (SVM) and the Multi-Layer Perceptron (MLP) Neural Network, using prosodic and voice quality features extracted from the Berlin Emotional Database, is reported. The features were extracted using PRAAT tools, while the WEKA tool was used for classification. Different parameters were set up for both SVM and MLP, which are used to obtain an optimized emotion classification. The results show that MLP overcomes SVM in overall emotion classification performance. Nevertheless, the training for SVM was much faster when compared to MLP. The overall accuracy was 76.82% for SVM and 78.69% for MLP. Sadness was the emotion most recognized by MLP, with accuracy of 89.0%, while anger was the emotion most recognized by SVM, with accuracy of 87.4%. The most confusing emotions using MLP classification were happiness and fear, while for SVM, the most confusing emotions were disgust and fear.
Keywords: Emotion Recognition, SMO, SVM, MLP Prosodic Features, Voice Quality Features
Abstrak
Kertas kerja ini melaporkan kajian perbandingan pengkelasan emosi suara antara Sokongan Mesin Vektor (SVM) dan Multi-Layer Perceptron (MLP) Rangkaian neural menggunakan ciri prosodic dan kualiti suara yang diekstrak daripada Pangkalan Data Emosi Berlin. Ciri-ciri ini diambil menggunakan perisian PRAAT manakala perisian WEKA digunakan untuk pengkelasan. Beberapa set parameter digunakan untuk kedua-dua SVM dan MLP semasa pelaksanaan untuk mendapatkan klasifikasi emosi yang optimum. Keputusan menunjukkan bahawa MLP mengatasi SVM dalam keseluruhan pengelasan emosi. Walau bagaimanapun, latihan untuk SVM adalah lebih cepat berbanding dengan MLP. Kadar pengecaman keseluruhan adalah 76,82% untuk SVM dan 78,69% bagi MLP. Emosi sedih adalah emosi yang paling tinggi dicam oleh MLP dengan kadar pengecaman 89.0% manakala emosi marah adalah emosi yang paling tinggi dicam oleh SVM dengan kadar pengecaman adalah 87.4%. Emosi paling mengelirukan menggunakan pengkelas MLP adalah emosi gembira dan emosi takut manakala bagi pengkelas SVM, emosi paling mengelirukan ialah emosi jijik dan emosi takut.
Kata kunci: Pengecaman Emosi, SMO, SVM, MLP, Ciri Prosodic, Ciri Kualiti suara
© 2016 Penerbit UTM Press. All rights reserved
Emotion Speech
Emotion Features Extraction
1.0 INTRODUCTION
There is a major difference between how human and machines understand speech. Humans understand speech via the perception of actions from the speaker, including hand gestures, eye movements and speech emotions, while this is not the case with machines.
Speech emotion recognition (SER) is a technology designed to identify the emotional or physical state of a speaker from his speech signal. It has attracted many researchers at the present time due to its importance in many applications, including E-Learning, Security, Healthcare, Automatic Translation Systems and Robotics.
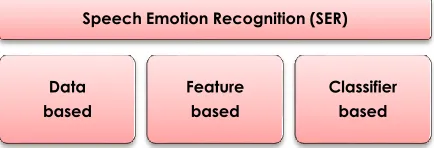
As Figure 1 shows, SAR researches can be divided into three different approaches, specifically the Data-based, Feature-based and Classifier-based approaches.
Figure 1 Block diagram of the Speech Emotion Approaches
The data-based approach concentrates on creating or searching for the best speech emotional database that could be used for testing or investigating speech emotion recognition systems. While some researchers use standard databases that are publicly available as in [1], others create their own dataset, as in [2].
The feature-based approach aims to extract and select the best speech features that can optimize SAR performance. Based on literature, many types of emotional speech features are used. Some researchers have worked on extracting one type of speech feature, as in [3], and others use two or more types of features and have proposed new features [4]. There are also researchers who provide issue in features selection [5].
The classification-based approach focuses on selecting and designing classifiers that can determine the actual mapping between different emotions [6]. Finding appropriate classification algorithms is the most difficult problem in this regard. Several types of classifiers have been used, such as the Hidden Markov Model (HMM), the K-Nearest Neighbors (KNN), the Artificial Neural Network (ANN), the Gaussian Mixtures Model (GMM) and the Support Vector Machine (SVM). The most popular classifiers in speech emotion recognition are the Support Vector Machine (SVM) [7], and the Artificial Neural Network (ANN) [8].
The Artificial Neural network (ANN) can be categorized into their main basic types: multilayer
perceptron (MLP), recurrent neural networks (RNN), and radial basis functions (RBF) networks. The latter is rarely used in speech emotion recognition [9].
A multilayer perceptron (MLP) is a feed forward artificial neural network of the back-propagation learning rule [10]. It is commonly used in speech emotion recognition, due to the simplicity of its implementations [9], [11].
On the other hand, the Support Vector Machine (SVM) is a binary classifier which is usually used for classifications and regression purposes [12], [13]. The SVM can basically handle only two class problems [14], [15]. It shows good performance with limited data [16] that has many features [17]. SVM classifiers are widely used in many pattern recognition applications, and are shown to outperform other well-known classifiers [9].
There has been no agreement on which classifier is the most suitable for emotion classifications, because each classifier has its own advantages and limitations. In this paper we compared SVM and MLP classifiers in terms of emotion classification accuracy of the speaker dependent, and the time spent building the model, using prosodic and voice quality features.
This paper is organized as follows: Section 2 reviews related works, Section 3 and 4 describes our experimental setup and evaluation, and Section 5 shows the classification results and discussion. Lastly, Section 6 is the conclusion and the future works.
2.0 RELATED WORKS
Recently, many studies have been undertaken to find a suitable classifier for speech emotion. For example the accuracy of support vector machine classifier was investigated using a prosodic feature related to pitch and speech rates [18]. The accuracy was 55.68%. Similarly, the accuracy of different classifiers was determined using prosodic features extracted from the NATURAL data set in [19]. The top performers are the SVM (RBF) (76.93%), then the Multi-layer perceptron (74.25%), and finally the SVM (polynomial) (69.50%).
Another study used SVM and NN, with 68 features related to pitch, energy, ZCR, power, and MFCC extracted from the Berlin database, to detect seven emotions including anger, happiness, fear, sadness, disgust, boredom, and a neutral emotion [20]. The average recognition rates for NN is up to 39.41%, and for SVM it is up to 53.22%. Using the same database, [9] compared there proposed classifier, the Gausian Mixture Autoregressive Model, with HMM, KNN and NN. The result showed that the proposed technique provides a classification accuracy of 76%, versus 71% for the Hidden Markov Model, 67% for the K-Nearest Neighbors, and 55% for Feed-Forward Neural Networks.
Support Vector Machines reported as the best classifier in investigating the accuracy of the emotion recognition of different classifiers, using different data Speech Emotion Recognition (SER)
Data based
Feature based
sets [21]. Berlin German corpus with linear kernel (E=1) and complexity parameter C=2 give an accuracy of 59.3%. Polish corpus with linear kernel (E=1) and complexity parameter C=2 give an accuracy of 68.7%. Italian corpus (acted emotions) with linear kernel (E=1) and complexity parameter C=3 give an accuracy of 56.5%. Italian corpus (real emotions) with linear kernel (E=1) and complexity parameter C=6 give an accuracy of 82.9%.
It can be noticed from previous works that emotion classification performance varies depending on the features and classifier used. The classification rate varied from 40% to 80%. SVM seemed to surpass NN in emotion classification. Nevertheless, the result depended on the experimental set up, the database used, and the parameters chosen.
3.0 EXPERIMENTAL SETUP
A simple structure of a speech emotion recognition module was selected to make a comparison between the two classifiers.
As Figure 2 shows, this model starts with the speech input which is represented by the emotional database, and the second stage will be the features extraction, this stage providing the emotional speech feature vector that will be fed to the classifier. In the classification stage, the different emotions will be recognized, and at the final stage the result will be a recognized emotion.
Figure 2 The structure of the speech emotion recognition model
3.1 Emotional Database
From the available literature, there are three types of databases used for studying speech emotions. They are the acted, spontaneous, and Wizard-of-Oz emotional speech databases. These three types of databases serve different purposes.
The spontaneous and Wizard-of-Oz databases can be a good baseline for creating real-life applications for a specific industry. However, the acted database is the easiest one to collect, and different studies prove that it can give good results. Therefore, the acted database is suitable for theoretical research.
In this work, the Berlin Emotional Acted Database (EMO-DB) was selected. This database is easily and freely available, and also it is used by many
researchers. EMO-DB is the acted German speech emotional database, which recorded at the Department of Acoustic Technology of Technical University of Berlin in Germany (funded by the German Research Community).
It was recorded using a Sennheiser microphone at a sampling frequency of 16 kHz, with the help of ten professional actors (five male and five female) who were asked to simulate seven emotions. These emotions include anger, boredom, disgust, fear, happiness, sadness and a neutral emotion. They did so using ten utterances, specifically five short and five longer sentences that can be used in daily communication, and can also be said with all the emotions. About 800 utterances were recorded.
After recording the database, twenty judges were asked to listen to the utterances in a random order, in front of a computer monitor. They listened to each sample only once, before they decided which emotional state the speaker had been in. After selection, the database contained a total of 535 speech files [22].
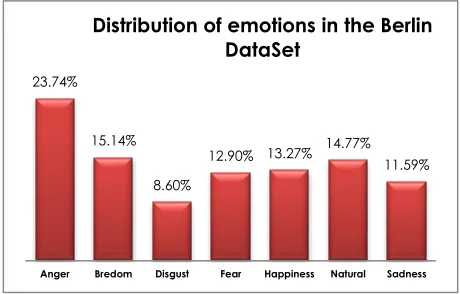
As shown in Figure 3, EMO-DB is an unbalanced database. This meant that not all the emotions have the same number of recorded samples, the highest number of samples being for the anger emotion (127), and the lowest being for disgust (46). All the available information regarding the speech database can be accessed via the internet.
Figure 3 Distribution of emotions in the Berlin Database
3.2 Features Extraction
To extract the features from the speech samples, the data mining tool PRAAT was employed. The PRAAT toolkit is a free scientific computer software package used for the analysis of speech in phonetics. In this research, PRAAT was used to extract a set of 80 prosodic and voice quality features.
Prosodic features are the most commonly used features in speech emotion recognition, because they provide reliable indications of emotions [9]. In contrast, voice quality features are the less frequently-used features [23]. However, studies have
23.74%
15.14%
8.60%
12.90% 13.27% 14.77% 11.59%
Anger Bredom Disgust Fear Happiness Natural Sadness
Distribution of emotions in the Berlin DataSet
Speech Input Features Extraction
proved that voice quality features complement prosodic features [4].
1) Voice Quality Features: The mean of the noise to harmonic ratio (NHR), harmonic to noise ratio (HNR) and auto-correlation features were extracted using the pitch, in addition to five different jitter measurements and six different shimmer measurements. From all the speech signals, 14 voice quality features were extracted. Table 1 shows the distribution of the features.
Table 1 Distribution of the Voice Quality Feature
Indices Features Description
1 HNR mean
2 NHR mean
3 Autocorrelation mean
4-8 Jitter local, local absolute, rap, ppq5, ddp
9-14 Shimmer local, local dB, apq3, apq5, apq11, ddp
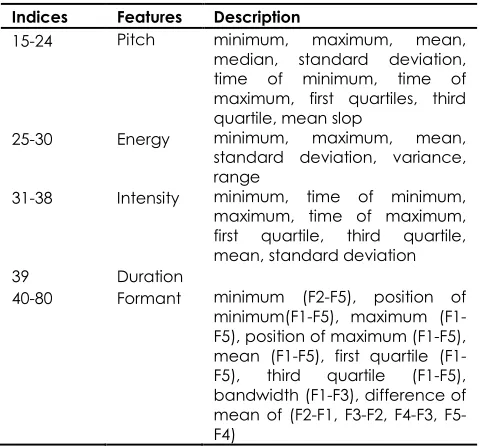
2) Prosodic Features: Different statistical measurements were used for the four types of prosodic features, including pitch, energy, duration and intensity. In addition, the formant feature, which does not belong directly to the category of prosodic features, was used. From all the speech signals, 66 prosodic features were extracted. Table 2 shows the distribution of the features.
Table 2 Distribution of the Prosodic Features
Indices Features Description
15-24 Pitch minimum, maximum, mean, median, standard deviation, time of minimum, time of maximum, first quartiles, third quartile, mean slop
25-30 Energy minimum, maximum, mean, standard deviation, variance, range
31-38 Intensity minimum, time of minimum, maximum, time of maximum, first quartile, third quartile, mean, standard deviation 39 Duration
40-80 Formant minimum (F2-F5), position of minimumF5), maximum (F1-F5), position of maximum (F1-(F1-F5), mean F5), first quartile (F1-F5), third quartile (F1-F5), bandwidth (F1-F3), difference of mean of (F2-F1, F3-F2, F4-F3, F5-F4)
3.3 Classification
SVM classifiers are mainly based on the use of kernel functions to nonlinearly map original features to a
high dimensional space, where data can be well classified using a linear classifier [9]. However, their treatment of non-separable cases is somewhat heuristic. In fact, there is no systematic way to choose the kernel functions, and hence, the reparability of the transformed features is not guaranteed [9].
ANN is a supervised learning classifier which commonly consists of an input layer, one or more hidden layers, and an output layer of computational nodes. The learning rule typically used for the multilayer neural network is the back-propagation rule, which allows the network to learn to classify.
Two different models for speaker dependent were utilized, using the WEKA (Waikato Environment for Knowledge Analysis) Tool version 3.7.12, using SVM and ANN classifiers. WEKA contains Java implementation, and it widely utilized in the academic community.
For validation, k-fold cross validation was used in this experiment. This validation method was used in many other works regarding EMO-DB. In this process, the database is divided into k subsets. Each time, one of the k subsets is used as the test set, and the other k-1 subsets form the training set. Error statistics are calculated across all k trials, specifically k=10 being used.
In WEKA, SVMs are implemented through John Platt’s sequential minimal optimization (SMO) algorithm, while ANN is implemented as Multilayer Perceptron (MLP).
To determine the best parameter for both classifiers, CVParameterSelection in WEKA explorer was used. CVParameterSelection is a meta-classifier in WEKA that allows the optimizing of some parameters of the classifier. However, it has a drawback in that it optimizes direct options of the classifier, and cannot optimize on nested options.
4.0 EVALUATION
There are several methods to evaluate the performance of supervised learning algorithms. Three methods would be used here, including confusion matrix, individual class’s accuracy, and overall accuracy. These methods were commonly used in SAR evaluation.
4.1 Confusion Matrix
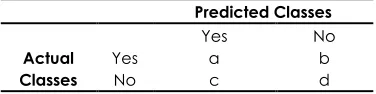
The confusion matrix is a visualization of the performance of supervised learning algorithms. It is used to show the relationships between actual and predicted classes, by presenting the number of correct and incorrect classes predicted by the model, compared with the actual classes in the test data.
column of the matrix representing the instances in a predicted class.
Table 3 shows an example of the confusion matrix for the classification model, which has been used to classify two classes, specifically yes and no.
Table 3 Example of the confusion matrix
Predicted Classes
Yes No
Actual Classes
Yes a b
No c d
For this example the entries in the confusion matrix have the following meaning:
- a is the number of correct predictions that an instance is yes.
- b is the number of incorrect predictions that an instance is no.
- c is the number of incorrect predictions that an instance is yes.
- d is the number of correct predictions that an instance is no.
All correct predictions are located in the diagonal of the table, so it is easy to visually inspect the table for errors. These will be represented by values outside the diagonal.
4.2 Classification Accuracy
The classification accuracy is the percentage of correctly classified instances over the total number of instances. It is determined using equation 1.
𝐴𝑐𝑐𝑢𝑟𝑎𝑐𝑦 =𝐶𝑜𝑟𝑟𝑒𝑐𝑡 𝑝𝑟𝑒𝑑𝑖𝑐𝑡𝑒𝑑 𝐼𝑛𝑠𝑡𝑎𝑛𝑐𝑒
𝑇𝑜𝑡𝑎𝑙 𝐼𝑛𝑠𝑡𝑎𝑛𝑐𝑒 ………..…… (1)
Two accuracy measurements were used, including individual class’s accuracy, which was calculated for every emotion, and overall accuracy.
4.3 Build Time
In addition to the previous three methods, build time was also used. Build time is the time required to build a classification model using the training database. Although building the classifier can be done offline, as building times may reach several days for certain classifiers, it is more convenient to have a shorter build.
5.0 RESULTS AND DISCUSSION
Firstly, the CVParameterSelection was used to determine the best cost value (C) for three SMO kernels. These include the Normalize Poly, Poly and RBF kernel. A comparison between the different kernels has been undertaken to determine the best accuracy among them. Table 4 shows that all parameter sets gave an accuracy of above 74%,
where the highest and lowest accuracy difference was slightly below 2%. The highest accuracy was 76.83%, using the RBF kernel function with a cost parameter with a value of 100.
Table 4 The accuracy for different SMO kernels
Kernel Cost Parameter Total Accuracy
Normalized Poly 51 74.95%
Poly 2 75.89%
RBF 100 76.82 %
Secondly, the CVParameterSelection is used to determine the best number of neurons (H) in a hidden layer for three different values of learning and momentum rate, that is:
1) A Learning rate of 0.3 and a momentum rate of 0.2, which is the default setting of WEKA.
2) A Learning rate of 0.25 and a momentum rate of 0.5.
3) A Learning rate of 0.1 and a momentum rate of 0.9.
The pairing of a learning rate and a momentum rate, of the values {0.25, 0.5} and {0.1, 0.9}, is the pair successfully used in speech recognition [24].
The number of epochs was set to 500. Error back propagation was used as a training algorithm; Table 5 shows the comparison result. Similar to SMO, all the results gave an accuracy of above 74%. Nevertheless, the difference between the highest and lowest accuracy is nearly 4%. The highest accuracy was 78.69%, using the paired learning rate and momentum rate values of 0.3 and 0.2 respectively, with the number of hidden nodes equal to 100.
Table 5 The accuracy of different MLP topology
MLP Parameters No. of
Neurons AccuracyTotal Learning
rate Momentum rate
0.3 0.2 100 78.69%
0.25 0.5 100 77.57%
0.1 0.9 51 74.77%
Table 6 The accuracy and build time for SMO and MLP
Classifiers Total Accuracy Build Time (seconds
)
SMO 76.82% 0.5
MLP 78.69% 60.48
In terms of the seven emotions classification, the performance varied significantly. Angry was the best emotion recognized by SMO, at 87.40%, while
sadness was the best emotion recognized using MLP, at 89.0%. Nevertheless, both emotions are among the highest recognized by both classifiers.
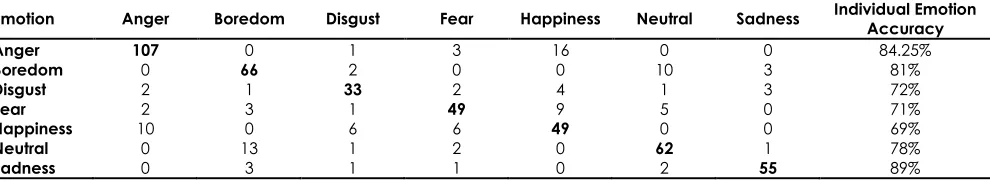
On the other hand, the most confusing emotions for SMO were disgust and happiness, with accuracies of 61% and 68% respectively. As for MLP, the most confusing emotions were fear and happiness, with accuracies of 71% and 69% respectively. The confusion matrix and individual emotion accuracy are shown in Table 7 and Table 8.
Table 7 Confusion matrix and individual emotion accuracy for SMO
Emotion Anger Boredom Disgust Fear Happiness Neutral Sadness Individual Emotion Accuracy
Anger 111 0 2 6 8 0 0 87.40%
Boredom 0 62 2 3 0 13 1 77%
Disgust 6 1 28 4 4 2 1 61%
Fear 2 3 2 48 8 5 1 70%
Happiness 11 0 3 9 48 0 0 68%
Neutral 0 13 1 3 0 62 0 78%
Sadness 0 3 3 0 1 3 52 84%
Table 8 Confusion matrix and individual emotion accuracy for MLP
Emotion Anger Boredom Disgust Fear Happiness Neutral Sadness Individual Emotion Accuracy
Anger 107 0 1 3 16 0 0 84.25%
Boredom 0 66 2 0 0 10 3 81%
Disgust 2 1 33 2 4 1 3 72%
Fear 2 3 1 49 9 5 0 71%
Happiness 10 0 6 6 49 0 0 69%
Neutral 0 13 1 2 0 62 1 78%
Sadness 0 3 1 1 0 2 55 89%
6.0 CONCLUSION AND FUTURE WORKS
This paper compared the performance of two popular classifiers in speech emotion recognition, specifically the Multilayer Neural Network (MLP) and the Support Vector Machine (SVM) using a sequential minimal optimization algorithm (SMO). The results obtained from the experiments showed that MLP overcomes SMO in regards to overall accuracy. However, the training for SMO took much less time when compared to MLP. Anger and sadness were the easiest emotions to be recognized with both classifiers, while disgust, fear and happiness were the hardest emotions to be recognized.
The results obtained are very promising, but there is still a trade-off between accuracy versus time. In the future we plan to investigate new classification algorithms that can provide higher accuracy in less time. We will also investigate memory usage. Evaluating a wider range of acoustic features, including spectral and wavelet features, is also left for further studies.
Acknowledgement
Special thanks to Ministry of Education (MOE) and Research Management Centre (RMC) providing financial support of this research. UTM-IRDA Digital Media Centre, Faculty of Computing, Universiti Teknologi Malaysia using Fundamental Research
Grant Scheme (FRGS) vot number
R.J130000.7828.4F253.
References
[1] Sathe-Pathak, B., and Panat, A. 2012. Extraction of Pitch and
Formants and its Analysis to Identify 3 Different Emotional States Of A Person. IJCSI International Journal of Computer Science. 9.
[2] Sidorova, J. 2007. DEA Report: Speech Emotion Recognition.
Appendix.
[3] Abelin, Å. and Allwood, J. 2000. Cross Linguistic
Interpretation Of Emotional Prosody. In ISCA Tutorial and Research Workshop (ITRW) on Speech Emotion.
[4] Marko Lugger and Bin Yang. 2008. Psychological Motivated Multi-Stage Emotion Classification Exploiting Voice Quality Features. INTECH Open Access Publisher.
[5] Arias, J., Busso, C. and Yoma, N. 2014. Shape-based
Emotion Detection In Speech. Computer Speech and Language. 28(1): 278-294.
[6] Hendy, N., and Farag, H. 2013. Emotion Recognition Using
Neural Network: A Comparative Study. World Academy Of Science. Engineering and Technology. 7: 1149-1155.
[7] Vogt, T., André, E., and Wagner, J. 2008. Recognition Of Emotions From Speech: A Review Of The Literature And Recommendations For Practical Realization. Springer. 75-91.
[8] Pao, T., Chen, Y., Yeh, J., and Li, P. 2006. Mandarin
Emotional Speech Recognition based on SVM and NN. In Pattern Recognition, 2006. ICPR 2006. 18th International Conference on. IEEE.1096-1100.
[9] El Ayadi, M., Kamel, M., and Karray, F. 2011. Survey On
Speech Emotion Recognition: Features, Classification Schemes, And Databases. Pattern Recognition. 44(3): 572-587.
[10] Tickle, A., Raghu, S., and Elshaw, M. 2013. Emotional
Recognition From The Speech Signal For A Virtual Education Agent. J. Phys. Conf. Ser. 450: 012053.
[11] Ingale, A., and Chaudhari, D. 2012. Speech Emotion
Recognition. International Journal of Soft Computing and Engineering (IJSCE). ISSN, 2231-2307.
[12] Chavhan, Y., Dhore, M. L., and Yesaware, P. 2010. Speech
Emotion Recognition Using Support Vector Machine.
International Journal of Computer Applications. 1(20): 6-9.
[13] Milton, A., Roy, S. S., and Selvi, S. 2013. Svm Scheme For
Speech Emotion Recognition Using Mfcc Feature.
International Journal of Computer Applications. 69(9): 34-39.
[14] Schuller, B., Reiter, S., and Rigoll, G. 2006. Evolutionary
Feature Generation In Speech Emotion Recognition. In
Multimedia and Expo, 2006 IEEE International Conference on. IEEE. 5-8.
[15] You, M., Chen, C., Bu, J., Liu, J., and Tao, J. 2006. Emotional
Speech Analysis On Nonlinear Manifold. IEEE. 91-94.
[16] Pan, Y., Shen, P., and Shen, L. 2005. Feature Extraction And
Selection In Speech Emotion Recognition. In IEEE Conference on Advanced Video and Signal Based Surveillance (AVSS 2005), Como, Italy.
[17] McGilloway, S., Cowie, R., Douglas-Cowie, E., Gielen, S.,
Westerdijk, M., and Stroeve, S. 2000. Approaching Automatic Recognition Of Emotion From Voice: A Rough Benchmark. In ISCA Tutorial and Research Workshop (ITRW) on Speech and Emotion.
[18] Lee, C., Yildirim, S., Bulut, M., Kazemzadeh, A., Busso, C., and
Deng, Z. et al. 2004. Emotion Recognition Based On Phoneme Classes. In Interspeech. 205-211.
[19] Morrison, D., Wang, R., and De Silva, L. C. 2007. Ensemble
Methods For Spoken Emotion Recognition In Call-Centres.
Speech Communication. 49(2): 98-112.
[20] Javidi, M., and Roshan, E. 2013. Speech Emotion
Recognition By Using Combinations Of C5. 0, Neural Network (NN), And Support Vector Machines (SVM) Classification Methods. J. Math. Comput. Sci. 6: 191.
[21] Fersini, E., Messina, E., and Archetti, F. 2012. Emotional States
In Judicial Courtrooms: An Experimental Investigation.
Speech Communication. 54(1): 11-22.
[22] Burkhardt, F., Paeschke, A., Rolfes, M., Sendlmeier, W., and
Weiss, B. 2005. A Database Of German Emotional Speech. In
Interspeech. 1517-1520.
[23] Schuller, B., Batliner, A., Steidl, S., and Seppi, D. 2011.
Recognising Realistic Emotions And Affect In Speech: State Of The Art And Lessons Learnt From The First Challenge.
Speech Communication. 53(9): 1062-1087.
[24] Salam, M. S., Mohamad, D., and Salleh, S. H. 2009. Improved