THE ROLE OF PSYCHOMETRIC ENTRANCE TEST IN ADMISSION PROCESSES FOR NON-SELECTIVE ACADEMIC DEPARTMENTS: STUDY CASE IN YEZREEL VALLEY
COLLEGE Tal Shahor
The Academic College of Emek Yezreel
Emek Yezreel 19300, Israel
Abstract
This study deals with admission processes of candidates for non-selective academic departments, i.e., departments where the number of open study-places is greater than the number of candidates. Currently, selection is carried out using two tools. One is the matriculation exam score, and the other is the score on the psychometric Entrance Test. The purpose of this study is to examine whether psychometric entrance tests are really necessary in college admission processes, or whether matriculation scores can be sufficient. The maim finding of the study is that while students with high psychometric scores usually succeed in their studies, students with low psychometric scores do not necessarily fail. This means that in departments where the purpose of the selection is to identify the best students, there is room for sorting through psychometric entrance tests. However, in places where the purpose of screening is to prevent the admission of weaker students, the efficiency of psychometric scores is very low.
Key words: matriculation exam, psychometric entrance test, admission processes
INTRODUCTION
This study deals with admission processes of candidates for non-selective academic departments, i.e., departments where the number of open study-places is greater than the number of candidates, a common situation in most Israeli colleges. Currently, selection is carried out using two tools, one is the matriculation exam score, and the other is the psychometric entrance test score. This method is largely based on a process developed in the past, during the days when higher education in Israel was primarily consisting of university studies, and in most departments the number of candidates was larger than the ability of the department to absorb, and thus, the goal of the selection process was to identify the best candidates (Beyth-Marom et al.; 1998). Under such conditions, selection based on matriculation scores alone was not enough, and entrance exams were required, which developed, over the years, into the current standardized psychometric entrance test.
However, during the last two decades the Israeli higher education system has attached into it many colleges, with the primary goal of making higher education available to population groups which, until then, did not have such access. These educational institutions have enough room for everyone who wants and can learn, and therefore the goal of the selection processes at these institutions is mainly aimed at identifying the unsuitable candidates.
In this context, the purpose of this study is to examine the role of psychometric testing in the described new conditions. However, examination of the relationship between matriculation and psychometric scores is problematic in our case, due to the phenomenon called ‘range restriction’, which can be explained as follows: academic success requires a variety of qualities, and while the psychometric entrance test better measures one type of qualities, matriculation exams are better in measuring another type1. Typically, students who are weak in both of these quality-types (that is, both their psychometric and matriculation scores are low), are not admitted into colleges (a condition called ‘institutional
1
Different measurement capabilities of the tests is a condition to using both of them simultaneously. If both tests measure the same thing, there is no reason not to be satisfied with only one of them.
selection’). On the other hand, students with high scores in both matriculation and psychometric tests tend to apply to more popular departments, a condition called ‘self- selection’. The result is that usually, college students with high psychometrics scores have low matriculation scores, and therefore their degree grades are not very high. Similarly, students with low psychometrics scores are likely to have high matriculation scores (otherwise they would not have been admitted), and their degree grades are unlikely to be low. All this means that even if the psychometric test is indeed a good predictor of student's ability to succeed in college, an empirical examination in concrete departments probably will not indicate it (in reality, usually we may see a small connection, or even no connection at all, between psychometric and average B.A. scores). The problem can be illustrated through the correlation coefficient between matriculation and psychometric scores. While the entire population’s coefficient is presumably positive, the correlation among economics students of the Emek Yezrael College is -0.04, and similar results were obtained in other studies as well (Davis & Linn, 1966). This unusual result is probably due to the two processes mentioned – on the one hand are students with low matriculation and psychometric scores who are not accepted, and on the other hand are students with high matriculation and psychometric scores who prefer other schools, which results in many students who have high scores in one test (matriculation or psychometric) and low scores in the other.
One way to deal with this problem is by applying the Hackman correction into the calculation. The correction is done by firstly calculating the selection equation for all potential candidates, which requires data on all students, including those who were not accepted (‘institutional selection’) and those who didn’t apply (‘self- selection’). However, while data for those who were not accepted is available, obtaining the data for students who preferred more popular schools is quite challenging. Consequently, while the correction may (possibly) solve the ‘lower’ range-restriction problem, that is, of those who applied and weren’t accepted (Institutional-selection), the self-selection bias of the ones who were ‘cut from the top’, can’t be corrected by it (Details of the correction formulas can be found in Linn, 1983). This means that the correction may fit much-wanted college departments (e.g. medical departments) which have no self-selection problem, but, unfortunately, this is not the case at most colleges and many university departments.
The problem of estimating the relationship between the ‘predictor’ (the psychometric score) and academic success criteria (academic studies’ scores), produced many debates among researchers. For example, Gamliel and Cahan (2004), who examined this relationship in Israel, found that the difference between weak and strong students is significantly greater in psychometric selection then it is in criteria scores (first year scores), a result indicating that the psychometric-score gap is greater than the true gap in student capabilities, and therefore raises doubts on the psychometric score’s ability to reliably assess academic success. Researchers at the National Institute for Testing and Evaluation retorted that when using more than one predictor in selection processes, the relation between predictor gap and criteria gap is increased (Navon, Ben-Shakhar and Tzelgov 2006; Kennet-Cohen, Bronner & Oren 1999). As in Israel the selection is done through two predictors (psychometric and matriculation scores), the relation increases as indicated. There is here, actually, a problem similar to the described ‘range restriction’ problem – students with low psychometric scores were admitted due to high matriculation scores, so they can be seen as an ‘improved’ group, of which only the best members were accepted. In the high-psychometric group, on the other hand, all members have been accepted – including those with low matriculation scores. The authors explain it as follow: Suppose that the average height of post-high-school boys is 175 cm, while high-school students’ average is 155 cm. Suppose a sports facility allows entry only to those who are taller than 150 cm. When comparing the average height of the two groups accepted into the facility, the gap is now smaller than that which existed between them before entering the facility.
Another argument that can be raised against the use of psychometric scores holds that even when studies found a correlation between psychometric and degree scores, it was relatively small. For example, the National Institute for Testing and Evaluation researchers Navon, Cohen and Bronner (2008) found that the correlation coefficient ranged from 0.432 to 0.567 in social sciences, and from 0.555 to 0.645 in exact sciences (results obtained after applying the range-restriction correction). Out of this, a question is raised, is it justified, based on such correlations, to deny students admission? Can’t such a procedure result in the rejection of many students who may do well in their studies?
One answer to this argument (Beyt-Marom et al.; 1998) proposes that candidate selection is not being done only by psychometric scores, but rather is also based on matriculation scores. They argue that the combination of the two grades together almost doubles academic success predictability. The success of the two-component selection stems, according to them, from the fact that each one of the two exams (matriculation and psychometric) tests different qualities. Matriculation exams are done after a long study period and tests the material studied, thus, these tests examine long-term learning ability (persistence). Psychometric tests, on the other hand, test learning-ability of new materials (thinking agility).
Notably, the above study looks at the years 1984 to 1993. Since then, the psychometric preparation system has become much more intense, professional and sophisticated, and it can be said that nowadays psychometric preparation is no less intense than matriculation studies. Hence today’s psychometric test may also be said to check learning-ability (rather than thinking agility), which raises the likelihood that today’s psychometric and matriculation exams test the same qualities. And indeed, a recent study of Yitzhaki, Pudalov and Krentzler (2013) of the Israeli Central Statistics Bureau, show that correlation between matriculation and psychometric scores is monotone, that is, students with high matriculation scores (almost) always also have high psychometric scores. It is predictable, therefore, that if we select candidates by matriculation scores only, i.e. accept the ones with high matriculation scores, we will find that they also have high psychometric scores, which means that selection done with two predictors would not give different results than a one-predictor selection. The conclusion of these findings is that a one-predictor selection is applicable, and since all candidates have matriculation scores, it seems most logical to avoid the psychometric test, at least in certain cases.
In this context, we should note that European countries do not utilize psychometric-based academic selection at all. According to Faybish and Goldshmidt (2006), France and Belgium academic studies are open to anyone who has earned a qualifying matriculation certificate. In Greece, Switzerland, Germany, Austria, Hungary, the United Kingdom, Denmark, the Czech Republic, Australia and New Zealand, academic admission is carried out utilizing matriculation scores only, while in the U.S. the selection method is similar to that in Israel.
Due to all the issues raised here, this study will not deal with the relationship between psychometric scores and academic success, but rather will focus on the practical question: should psychometric scores be a criterion in admission processes of academic departments similar to the Emek Yezrael’s Economics Department?
An additional issue examined here will be which psychometric component is most suitable for selection and admission processes in academic Economics Departments. As is known, the Israeli psychometric test consists of three sections: Quantitative, Hebrew, and Foreign Language (English), and the final score is a weighted average of these three parts. Up to this time, admission has been made in accordance with the weighted score. In this context our hypothesis is that for the Economics Department the quantitative section will make a better predictor of school-success.
The last part of the study examines the matriculation exam ability in predicting the B.A. success. Importantly, research like this should distinguish between selective departments, i.e., departments where applicant numbers exceed the available openings, and non-selective departments. While the purpose of selection in selective departments is to identify the best candidates, its purpose in non-selective departments is to prevent the admission of students who do not fit, in order to maintain a reasonable level of academic study. The Department of Economics at the Emek Yezrael College, like most Israeli college departments, and like many university departments, are counted among the non-selective departments, thus the goal of the selection process in these departments is to identify the students who do not fit the department level.
All these ‘background facts’ lead to our research question, which is: Should psychometric scores be a selection criterion in admission processes of non-selective academic departments?
METHOD
The study is based on the fact that the Emek Yezrael Economics Department sometimes accepts students who did not meet its psychometric threshold. Admission requirements for economics studies are a score of at least 540 in the general psychometric test, or 105 in the quantitative section of the test. However, over the years there have been quite a few applicants who were admitted, as exceptions, even though they did not meet the threshold conditions. The study examines the success of these students compared to the other students, under the assumption that if it turns out that there is no significant difference between the groups, it may indicate that the psychometric test is not an effective factor in selecting the right candidates.
This method may create, however, two problems. The first is that it is possible that students with low psychometrics succeed because they have high matriculation scores. To cope with this problem we compare students who met the psychometric threshold with students who did not meet the minimum and who have similar matriculation scores. The examination will be done using a regression (a wider explanation for it appears in this paper’s appendix).
The second problem to emerge from the research is what practical method can enable the selection of the right candidates without the assistance of the psychometric scores? To deal with this question, the research examine the option of selecting the right candidates using the math-section score of the matriculation exam. As mentioned, matriculation exams are done by all students anyway, and thus have no extra cost, and, at least economically, are superior to the psychometric test. The research-database includes Emek Yezrael economics students who began their studies through the years 2005 to 2011. After omitting students with incomplete data, the total number of students in the study is 580.
AN EMPIRICAL EXAMINATION
In the first stage we divide the students into three groups. The first group includes students who do not meet the acceptance psychometric threshold, i.e., those whose psychometric scores lower than 540, The second group includes students with psychometric scores between 540 and 599, and the third includes students with psychometric scores 600 and above. The comparison between groups consists of four variables:
1. Percentage of students who failed their B.A. studies.
2. Percentage of students with final B.A. scores lower than 75. This variable relates to the argument claiming that the purpose of admission requirements is not only to avoid failing students, but also to maintain an adequate level of study in the school. According to this argument, some weak students do gain a degree due to very hard work, yet their low academic level badly affects the rest of the class. The rate of students with B.A. scores lower than 75 should indicate the size of this group.
3. Median B.A. score. The reason the median, rather than the average score is used, is due to the fact that the study also examines students who haven’t graduated. Among such students, the GPA includes, in most cases, first year grades, which are usually lower than second and third year grades. Such grades can affect GPA, but not the median grade.
Variable comparison of the three groups is listed in the following table:
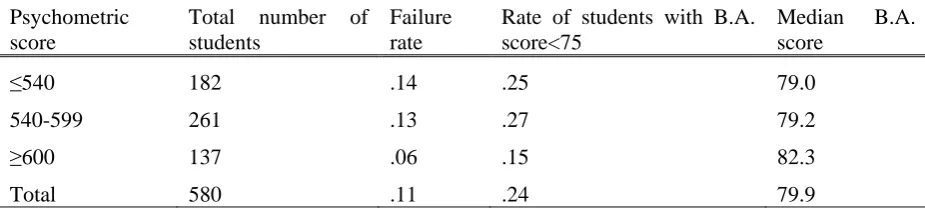
Table 1. Success rates by psychometric scores (standard deviation in parentheses)
Psychometric score
Total number of students
Failure rate
Rate of students with B.A. score<75
Median B.A. score
≤540 182 .14 .25 79.0
540-599 261 .13 .27 79.2
≥600 137 .06 .15 82.3
Total 580 .11 .24 79.9
The table shows that differences between students with psychometric scores lower than 540 and students with psychometric scores between 540 and 599 are small in all cases. Examination of statistical significance levels shows that no variable difference between the groups is significant. However, examination of the differences between the middle score group (540-599) and the high score group (>=600), find that all differences of all variables are large and significant.
Failure rate comparison:
χ
2(
1
,
398
)
=
4
.
5
,
P
=
.034
, and the effect:Cramer
'
s
v
=
.
1
Comparison between rates of students with B.A. grades lower than 75:
χ
2(
1
,
398
)
=
6
.
7
,
P
<
.01
, and the effect:Cramer
'
s
v
=
.
13
The results raise the suggestion that psychometric tests can accommodate cases where the goal is to identify the best candidates, but in cases where the goal is to prevent the acceptance of weak candidates the psychometric score is not effective.
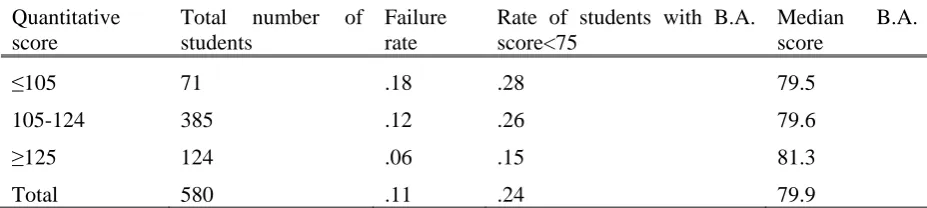
The following table shows similar test results for the quantitative section of the psychometric test. Admission threshold here is 105.
Table 2. Success rates by psychometric quantitative scores (standard deviation in parentheses).
Quantitative score
Total number of students
Failure rate
Rate of students with B.A. score<75
Median B.A. score
≤105 71 .18 .28 79.5
105-124 385 .12 .26 79.6
≥125 124 .06 .15 81.3
Total 580 .11 .24 79.9
Comparison of the differences between the low and the medium quantitative score-groups give the following results:
Failure rate comparison:
χ
2(
1
,
4
56
)
=
2
.
368
,
P
=
.124
, and the effect:Cramer
'
s
v
=
.
07
Comparison between rates of students with B.A. grades lower than 75:
χ
2(
1
,
4
56
)
=
0
.
18
,
P
=
.66
,and the effect:
Cramer
'
s
v
=
.
02
As can be seen, as in the general psychometric test case, here also there are no significant differences between the groups.
Comparison of the differences between the medium and the high quantitative score-groups give the following results:
Failure rate comparison:
χ
2(
1
,
5
09
)
=
2
.
757
,
P
<
.1
, and the effect:Cramer
'
s
v
=
.
073
Comparison between rates of students with B.A. grades lower than 75:
χ
2(
1
,
5
09
)
=
6
.
644
,
P
=
.01
, and the effect:Cramer
'
s
v
=
.
114
As can be seen, the differences between the two groups are significant, but very small. From these data it can also be concluded that the quantitative score is more effective in identifying the good candidates, and less effective in identifying the weak candidates.
COMPARISON OF STUDENTS WITH THE SAME MATRICULATION SCORES
As mentioned, the current admission process is based on two components, the psychometric and matriculation scores. It is possible therefore, that the relative success of students with low psychometric scores is due to their high matriculation scores. To examine this claim a comparison should be done between students with the same, or at least similar, matriculation scores. Such examination can be done using the following regression (a detailed explanation of why the regression allows the comparison can be seen in the paper’s appendix). The regression sample consists only of graduated students (total 514 students).
(1)
Grade
=
β
0+
β
1PSY
(
540
)
+
β
2PSY
(
600
)
+
β
3HSM
+
β
4M
4
+
β
5M
5
+
β
HHeb
Where the dependent variable ‘Grade’ is a dummy variable receiving the value 1 for failed students (students who failed first-year exams); ‘PSY(540)’ is a dummy variable for students with psychometric scores lower than 540 (total number of students in this group is 162); ‘PSY(600)’ is a dummy variable that receives the value 1 for students with psychometric scores 600 and above; HSM is the average of grade on the high school matriculation; ‘M5’ includes mathematics matriculation scores of students enrolled in 5 unit math matriculation exams (other students are given in the variable a ‘zero’ value); ‘M4’ includes matriculation scores for students enrolled in 4 unit math matriculation exams; ‘M3’ includes math scores for students enrolled in three unit math exams; ‘Heb’ is a dummy variable for students whose first language is Hebrew. Estimation results appear in the following table.
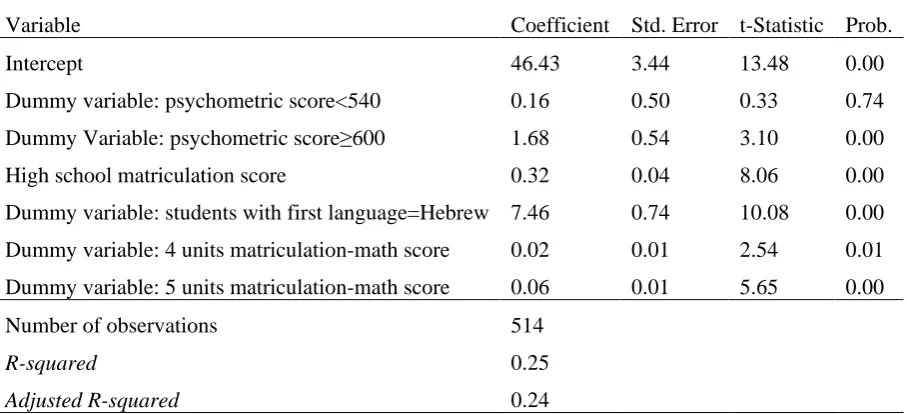
Table 3. Regression of factors that affect B.A. scores, including dummy variables for psychometric scores2
Variable Coefficient Std. Error t-Statistic Prob.
Intercept 46.43 3.44 13.48 0.00
Dummy variable: psychometric score<540 0.16 0.50 0.33 0.74
Dummy Variable: psychometric score≥600 1.68 0.54 3.10 0.00
High school matriculation score 0.32 0.04 8.06 0.00
Dummy variable: students with first language=Hebrew 7.46 0.74 10.08 0.00
Dummy variable: 4 units matriculation-math score 0.02 0.01 2.54 0.01
Dummy variable: 5 units matriculation-math score 0.06 0.01 5.65 0.00
Number of observations 514
R-squared 0.25
Adjusted R-squared 0.24
As can be seen, the coefficient of students with psychometric scores of 600 and above is positive, statistically significant and quite large, but the coefficient of students with psychometric scores lower than 540 is not statistically significant at all. Therefore we can conclude that while students with high psychometric scores are receiving higher B.A. scores, there is no difference, in this respect, between students with scores smaller than 540 and students with scores between 540 and 600.
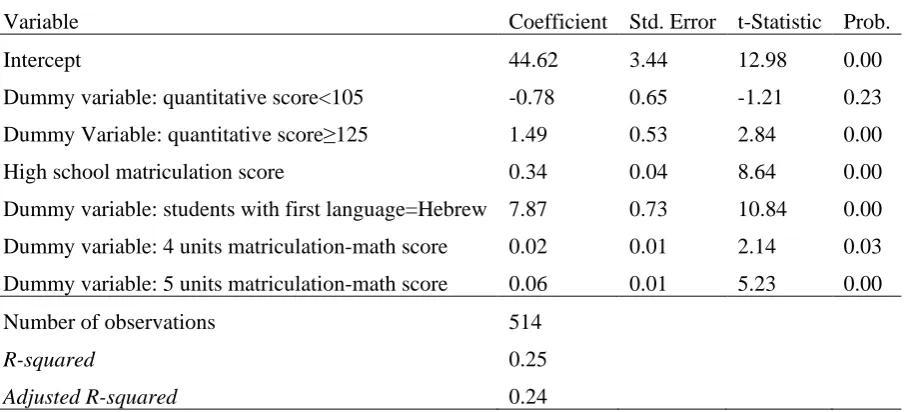
In the next phase of the study we use the regression to examine the selection ability of the psychometric quantitative section. To this end, we made two changes: (A) We replaced the dummy variable PSY(540) with a variable that receives the value 1 for students with quantitative psychometric score lower than 105, which makes a group of 68 students. (B) We replaced the dummy variable
2
The regression had heteroscedasticity problem, hence the White correction.
PSY(600) with a variable that receives the value 1 for students with a quantitative score of 125 or above, a group containing 116 students.
Table 4. Regression of factors that affect B.A. scores, including dummy variables for the quantitative section of the psychometric test3
Variable Coefficient Std. Error t-Statistic Prob.
Intercept 44.62 3.44 12.98 0.00
Dummy variable: quantitative score<105 -0.78 0.65 -1.21 0.23 Dummy Variable: quantitative score≥125 1.49 0.53 2.84 0.00
High school matriculation score 0.34 0.04 8.64 0.00
Dummy variable: students with first language=Hebrew 7.87 0.73 10.84 0.00
Dummy variable: 4 units matriculation-math score 0.02 0.01 2.14 0.03
Dummy variable: 5 units matriculation-math score 0.06 0.01 5.23 0.00
Number of observations 514
R-squared 0.25
Adjusted R-squared 0.24
As can be seen, here also the coefficient of students with low quantitative score is not significant, while the coefficient of students with high quantitative scores is positive and significant. In this respect, there is no noteworthy difference between the quantitative score and the general psychometric score.
DETERMINING ADMISSION CRITERIA BASED ON MATRICULATION MATH SCORES In the last phase of the study we examine whether the economics department candidates can be admitted based solely on their matriculation scores. Our assumption is that of all the matriculation components, mathematics is most relevant for economics studies, and therefore we focus our attention on math grades. As is known, matriculation math tests are done at three levels (3, 4 and 5 units), so our examination is done according to these levels. In the following table students are divided into groups according to study-units and matriculation math scores, and examined the success of each B.A. study-group according to the variables used in tables 1 and 2:
Table 5. B.A. success by matriculation-math grades
Math unites
Matriculation math score
Number of students
Failure rate
Rate of students
with B.A. score<75
B.A. average score
Median B.A. score
Psychometric score
3 91 .198 .35 75.1 77.4 565
4 <75 82 .183 .33 74.7 77.4 569
4 75 - 79 62 .129 .29 76.5 78.8 563
4 80 - 84 65 .092 .18 79.0 80.3 563
3
The regression had heteroscedasticity problem, hence the White correction.
4 85 - 89 84 .060 .17 79.5 80.9 565
4 90 - 100 104 .058 .14 81.4 81.0 556
5 <80 45 .089 .11 81.2 81.9 572
5 80 - 100 47 .085 .304 79.8 80.3 569
While examining the table data, it seems that students can be divided into two groups: the first includes students tested at 5 units with any score, or at four units with scores of 80 or above (lines 4 to 8 in the table), and the second group which includes all the remaining students. It is noticeable that the results of the first group are better in all variables. This observation is less distinct when looking at failure rates, but when examining B.A. average scores, B.A. median scores and rates of students with B.A. scores lower than 75, it becomes evident that this is the most reasonable division. The last table-column presents psychometric scores for each group, which shows that there is almost no difference between them. More explanation for these findings appears after the following table, which presents a comparison between the two groups, utilizing math scores and depends on the described division.
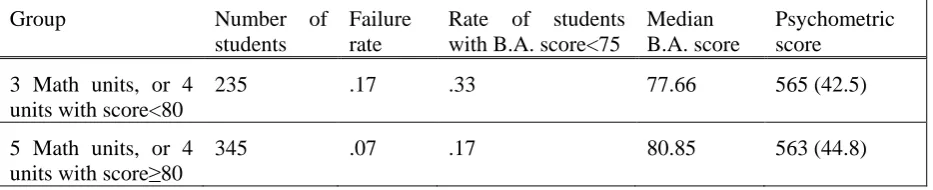
Table 6. B.A. success by matriculation-math grades (with two groups division)
Group Number of
students
Failure rate
Rate of students with B.A. score<75
Median B.A. score
Psychometric score
3 Math units, or 4 units with score<80
235 .17 .33 77.66 565 (42.5)
5 Math units, or 4 units with score≥80
345 .07 .17 80.85 563 (44.8)
In all cases the difference between the two groups is statistically significant.
Failure rate:
χ
2(
1
,
580
)
=
14
.
42
,
P
<
.01
, and the effect:Cramer
'
s
v
=
.
156
Rate of students with B.A. score<75:
χ
2(
1
,
580
)
=
18
.
32
,
P
<
.01
, and the effect:16
.
v
s
'
Cramer
=
As can be seen, in the first two indices (failure-rate and rate of students with B.A. scores<75), the effect is quite small, and, out of this, one might conclude that the difference between groups is not very large, and therefore matriculation-math selection is not effective. It should be remembered, however, that the ‘range restriction’ phenomenon also exists here – most students with low math scores were accepted because of their high psychometric scores, so it can be said that among students with low math scores only the best had been admitted, while in the second group, of those with high math scores, all students had been admitted. It is therefore likely that the academic ability of general-population students with low math scores is significantly lower than the academic ability of already-admitted students with low math scores (such as the ones appearing in Table 6). This means that if we compare all candidates with low math scores and all candidates with high math scores, the difference between groups (and apparently the effect) will be much larger. This claim can be supported by the last table column, which features each group’s psychometric scores. As can be seen, there is almost no difference in the average psychometric scores of the two groups. If we accept the argument that in the entire population students with high matriculation scores also have high psychometric scores, the
4
In this group, all students with B.A. scores smaller than 75 were those whose native language is not Hebrew. Their low results may stem from their Hebrew level, and it is possible that the solution for them should be additional educational assistance in this area.
notion is strengthened that of all students weak in math, only the strongest had been admitted, thus academic ability of the entire student-group with low math scores will be lower than presented in Table 6. The final conclusion of all this is that students with low math matriculation scores can’t be admitted to school without additional selection criteria, and therefore it seems that the admission process of candidates with low math matriculation scores will need to continue using psychometric scores also in the future.
Another way to examine the effectiveness of psychometric-based selection is to examine B.A. success rates of students who met the math criterion, but their psychometric scores are lower than the minimum acceptance threshold (540). Under current admission requirements, such students should not have been admitted, yet were admitted nonetheless, as exceptions, and it is interesting therefore to examine how they did in their studies. Data for this group appears in the second row of the following table. The other lines present data of the other students, for comparison purpose.
Table 7. B.A. success by matriculation-math and psychometric grades
Math matriculation Psychometric score
Number of students
Failure rate
Rate of students with B.A. score<75
B.A. score
5 Math units, or 4 units with score>=80
≥540 234 .064 .17 81
<540 111 .090 .18 79
3 Math units, or 4 units with score<80
≥540 164 .159 .31 76
<540 71 .211 .37 74
As stated, most interesting is the second line, presenting data for students who did not meet the psychometric threshold (i.e., who got scores smaller than 540), but did meet the math criterion. As can be seen, in this group the failure rate and the rate of students with a B.A. score<75 are quite low, and the B.A. score is fairly high. This means that admitting such students, even though they did not meet the psychometric threshold, was the right step to take, and that future admission of such candidates according to matriculation math grades only is possible and appropriate policy.
Another interesting point is the fact that the B.A. success of this group (those who met the math criterion but not the psychometric threshold) was higher in all parameters of those who met the psychometric threshold but not the math criterion (appearing in the third row). This result farther strengthens the claim that for the Emek Yezrael Economics Department the matriculation math score is a good tool for candidate selection.
SUMMARY
The purpose of this study is to examine if, and in which cases, can candidates be selected and admitted to academic institutions without requiring them to be tested in psychometric exams. Psychometric exams are costly, both personally and nationally, in terms of money and time, and it is therefore desirable to minimize the number of students who are required to take them. Thus, the study does not focus on the question of whether psychometric tests can predict academic success, but rather examines the cases in which matriculation scores in general, and certain components of them in particular, can be sufficient for the selection process.
The study focuses on economics students of the Emek Yezrael Academic College, but it seems to open a door for conducting similar studies in other academic institutions as well.
Its first interesting finding is that while students with high psychometrics scores usually succeed in their studies, students with low psychometrics do not necessarily fail. This means that in departments where the purpose of the selection process is to identify the best students, there is room for applying it
through psychometric tests. However, in institutions where the selection purpose is to prevent the admission of unfit students, the psychometric test’s efficiency is very low. Another interesting finding is that selection done by the quantitative section of the psychometric exam does not produce different result than the overall test.
Finally the study examined the possibility of selecting students utilizing matriculation exams exclusively, and it seems that to this end, in the case of the Emek Yezrael Economics Department, the most suitable tool is the matriculation-math section – students tested at the 5 unit exam or at the four unit exam with grades 80 or above were successful in their economics B.A., and it seems therefore that in the future such students can be admitted with no psychometric test. Students with lower math grades, however, still need to take the psychometric test, and if receiving high enough scores would be able to be admitted.
REFERENCES
Beyth-Marom, R, Beller, M, Braun, H, Brennan, R, Gafni, N, Hambelton, R, Cohen, R, Nevo, B & Tzelgov j 1998, The role of the psychometric exam in selecting students for higher education, National Institute for Testing & Evaluation, Jerusalem,(Hebrew).
Gamliel, E &Cahan, S 2004, 'Unfairness in university screening procedures: A modern version of the bible parable of the "poor man's sheep', megamot, vol. 43, no. 3, pp. 433-445.
Faybish, R & Goldshmidt, R 2006, Methods of admission processes for academic institutions– comparative review, (Hebrew) https://www.knesset.gov.il/mmm/data/pdf/m01518.pdf
Kennet-Cohen, T, Bronner, S & Oren, C 1999, The Predictive Validity of the Components of the Process of Selection of Candidate for Higher Education in Israel, Research Report, National Institute for Testing & Evaluation, Jerusalem, (Hebrew).
Linn, R L 1983, 'Pearson selection formulas: Implications for studies of predictive bias and estimates of educational effects in selected samples', Journal of Educational Measurement, vol. 20, no. 1, pp. 1-15.
Linn, R L & Davis, J A 1966, Correlates of academic performance of community college students in career and transfer programs: A pilot study, Research and Development Report, RDR 66-7, No. 2, College Entrance Examination Board, New York.
Navon, D, Ben Shakhar, G & Tzelgov j 2006, The announcement of the death of the SAT was premature: response to yogev and Ayalon 2000, Research Report No. 328, National Institute for Testing & Evaluation, Jerusalem, (Hebrew).
Navon, D, Cohen, Y & Bronner, S 2008, The factors which affect the estimation of the validity coefficient of the predictor used in selecting students for higher education, Research Report No. 347, National Institute for Testing & Evaluation, Jerusalem, (Hebrew).
Yitzhaki, S, Pudalov,T & Aviel Krentzler, A 2013, Matriculation and Psychometric Examinations in Mathematics and English, and the Relationship between Them, Working paper series No. 75, Central Bureau of Statistics, Jerusalem, (Hebrew).