An Analytical Model of Tests Generation Process for
Mobile Applications
E. E. Khatko
1, V. A. Filippov
2,*1Moscow Institute of Physics and Technology, State University, Moscow, Russian Federation
2Moscow Institute of Electronics and Mathematics of National Research University a higher School of Economy, Moscow, Russian
Federation
Abstract
Because of rapid mobile technologies expansion, there is a gap between the complexity of mobile applications and the complexity of employed testing techniques. This paper is aimed at reducing the gap from the practical point of view. Tests generation techniques are widely spread, but none of them are optimized for mobile applications. This paper proposes an analytical model of tests generation process, which is based on prototypes and takes mobile specificity into consideration. Along with this an analysis of existing tests generation approaches has beenmade. The flowchart of the proposed model has been submitted with the model. The efficiency of the model has been described in the numerical results section.Keywords
Testing, Tests Automation, Tests Generation, Mobile Applications1. Introduction
In the last few years, mobile technologies have been rapidly expanding in everyday life. Almost every person on earth has a mobile telephone. Mobile devices are becoming more and more complex as new types of devices such as Smartphones, Communicators, Tablets, etc., have appeared. Such devices hardware hasconfigurations similar to yesterday’s desktops’, and thus they should be treated as complex hardware and software systems controlled by operating systems. In the era of conventional phones, testing processes were simple as well. Manual testing processes predominated. However, accelerated evolution of mobile devices leads to formation of a technology gap between the complexity of mobile applications and the complexity of the corresponding testing methods. Manual testing is no longer enough these days. A new complex approach with special test automation tools should come in its place. Therefore the problem of testing methods optimization is very important from the exploratory point of view and urgent from the practical point of view.
Tests generation based on an application model or proto type is one of the optimization ways that couldbe followed (in this paper prototypes are considered as models which describe applications based on user interface). Further model or prototype use depends on the way of formalizing the generation problem.
* Corresponding author:
[email protected] (V. A. Filippov) Published online at http://journal.sapub.org/se
Copyright © 2012 Scientific & Academic Publishing. All Rights Reserved
2. Analysis of Existing Tests Generation
Techniques
There are different methods of formalizing the generation problem, but most of them do not take mobile specificity into consideration. In particular[1] describes an approach to UI level tests generation. The test suite generated this way, however, does not meet the requirement of mobile applications test criterion[2]. In[3] WEB-related tests generation techniques are described. The proposed approach makes use of WEB specificity – client-server architecture of the application and user-application sessions.Therefore this approach can’t be used for mobile tests generation.
There is a formalization that is based on an application’s representation as an extended finite state machine[4]. It’s well known[5] that extended finite state machines can be represented as graphs. EFSM’s states are considered as graph nodes and EFSM’s transitions – as graph edges.Therefore the tests generation problem is reduced to the graph traversal problem.Mobile applications testing coverage criterion[2], in terms of graph traversal, requires a maximum edge coverage result of traversal.[6] describesformal methods of tests generation. One of them is a «T-method» which is aimed at solving the Chinese Postman Problem (CPP)[7]. There are many particular solutions of the CPP,e.g. [7] describes a solution, based on the graph matching theory.
traversal is to approach the “solution” as closely as possible, namely: perform the traversal through all edges with a minimum number of each edge recurrences.
To solve the stated traversal problem, it’s appropriate to use graph path-finding algorithms. The main complication here is that the problem doesn’t define the start and end points of the path. The graph should be traversed until all of the edges are covered. There are different path-finding algorithms, so an appropriate modification of one of them could lead to a desired solution.
The Dijkstra's algorithm[9]finds closest paths from one node to the others. This algorithm is not suitable for dynamic graphs, where edges’ weights are changed according to the current context of the EFSM’s variables. The same situation is with the Bellman-Ford algorithm[9].
The Floyd-Warshall algorithm[10]finds closest paths between each pair of graph nodestherefore it’s not suitable, because the EFSM graph may change dynamically after each transition is made, so all pairs’ closest paths should be recalculated too often.
The Algorithm
A
*
[11]is the minimal-cost path finding algorithm. It’s a greedy algorithm which uses heuristics to find the most suitable route “at the current moment”.There are modifications [12]which allow traversing a graph until all edges are covered. A modification ofA
*
which is capable of containing the graph’s parameters and finding the path according to them is proposed in this paper.The costs function
F
is the base of the algorithm’s logic. The next edge to be covered is chosen according to the currentF
value. The smaller theF
value, the more suitable the corresponding transition is.3. Analytical Model of Tests Generation
Process
Having studied the CPP and the Euler circuit finding problems[13], it’s proposed to use the following approach of finding the “next” edge to cover while staying in the “current” one.Let
F G H
= +
, whereG
isthe path costs from the beginning edge to the “next” one.H
– heuristics that estimates the path costs from the next edge to the closest uncovered edge..
,
( )
0,
e price e cList
G e
cList
K
e cList
∈
=
+
×
∉
,where
e
- thecurrent edge,e price
.
- weight of the current edge,K
- scale factor.max (
i i)
i NodesK
=
∈in out
+
– wherein
i/out
i- the number of incoming / outgoing edges forthei
- thnode._ _
_
H
=
path to closest unc
– path costs to the closest uncovered edge.During the traversal process:
• Before each
G
andH
calculation, thegraph is updated according to the EFSM condition of the “next” edge. The edges that become inaccessible in context of the condition are removed from the graph temporarily, until the next transition.• The path to the closest uncovered edge is calculated, using the BFS algorithm[9].
Formally:
[
1 2, ,...,
n]
T
=
t t
t
-thearray of all EFSM transitions.[
i,|
i]
C
=
t t соvered
−
-thearray of all covered transitions. The array is changed during the traversal process.[
1, ,...,
2 n]
W
=
w w
w
- thearray of all edges weights. The array is changed during the traversal process.1,
0,
i i it C
c
t C
∈
=
∉
- theflag which indicates if the current edge is covered.i
P
- thepath from the current edge to the closest uncovered one.N
-thescale factor that prioritizes conditions: uncovered edges are chosen first, after that the closest edge to the next uncovered one is chosen.So the following is the expression of finding the
F
value for thei
-th edge:(4)
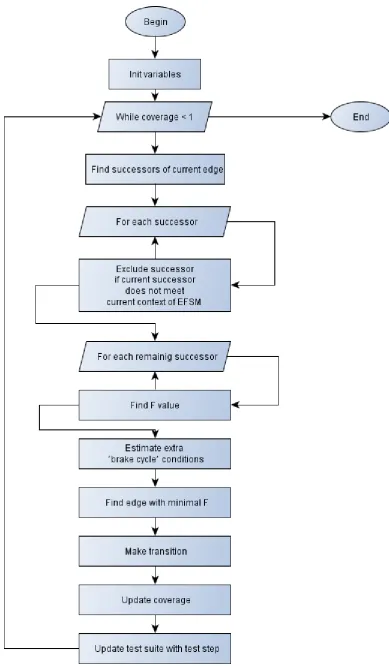
Flowchart of the analytical model
Let’s consider a flowchart of finding the path which covers all edges of the EFSM graph. The elements “Find F value” and “Estimate extra ‘brake cycle’ conditions” will be covered below, as they are not that simple.
Findingthe F value
- thebase expression.
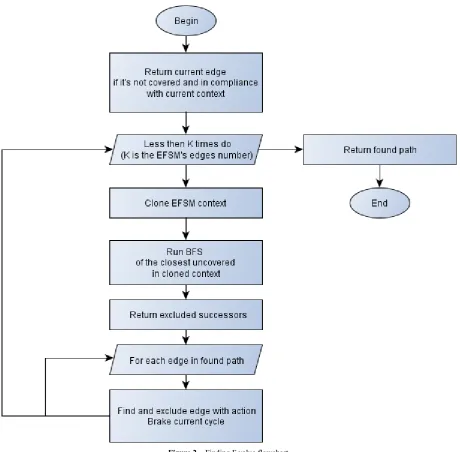
To find the value of for the -th transitionit’s required to find the following sum: . The procedure based on
BFS algorithms is used for finding the sum.In Figure 2the flowchart of the procedure is presented.
Extra brake conditions
There are circumstances which brake the main cycle, returning the AppError: «Unable to find next transition in the current context, because of incorrect prototype parameters»
• Found paths are all equal to each other and contain all graph edges for all of the remaining successors of the current edge
• No paths are found for each of the remaining successors of the current edge
(
)
i
i i i
P
F
=
C c
+
× +
N
∑
w
(
)
i
i i i
P
F
=
C c
+
× +
N
∑
w
Figure 2. Finding F value flowchart
4. Numerical Results
Let’s estimate the efficiency of the proposed modelwith the help of following expression[2]:
( ) ( )
( ( )) ( ( ))
comp G F G
N comp G L comp G
=
× , where
EFSM graph complexity
comp K M P C
( , , , )
:2 2 2 2 2
( )
(
)
comp G
=
K
+
M
+
V C
+
P
, whereK
– thenumber of graph nodesM
–thenumber of graph edgesP
– thenumber of graph parametersC
– thenumber of graph edge conditionsV
–thepriority factorOn average, the number of mobile application states lies within the following edges:
K
∈
[
2,...,20
]
.The graphs of mobile applications EFSMs are always connected, therefore,the minimum number of edges is:
M
MIN= −
K
1
.The estimate of the maximum number of edges is:2
MAXK Max
M
=
×
, wheremax (
i i)
i NodesMax
in out
∈
=
+
-the maximum sum of incoming and outgoing edges through all the nodes. Thus, the average edges number is:
2
1
2
4
K Max
Max
M
=
×
+ − ≈
K
+
K
. The analysis ofthe existing prototypes shows, that the average
Max
value is 5, so7
2
4
M
≈
K
≈
K
.with graphml –an XML based graph description language. The tool allows setting different stop conditions, including the “100% transitions coverage” condition. This generator
also makes use of the
A
* algorithm, but probably with a differentF
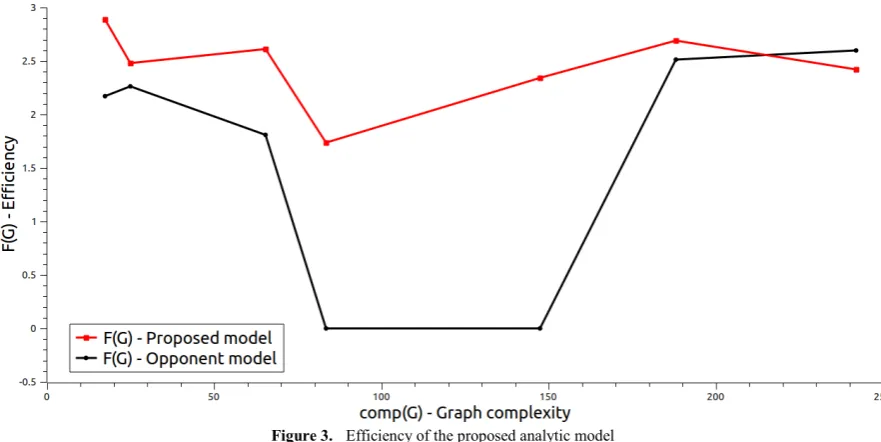
expression. The following results were obtained when measuring generation processes efficiency:Table 1. Efficiency of the proposed analytic model
Prototype graph K M P C Proposed model Opponent model
6 8 1 1 2,89 2,17
6 9 1 2 2,48 2,26
6 15 2 6 2,61 1,81
13 26 5 6 1,74 0
16 36 9 11 2,34 0
16 48 2 18 2,69 2,51
21 66 3 23 2,42 2,60
Figure 3. Efficiency of the proposed analytic model
It can be stated from this curves, that the proposed model is more efficient than the analogue model, evidently because of the “correct” expression of the
F
function.5. Conclusions
The analysis of existing tests generation approaches has been made. An analytical model of tests generation process which is based on prototypes and takes mobile specificity into consideration is proposed. The scheme of the proposed model is submitted. The efficiency of the model is described in the numerical results section.
REFERENCES
[1] Рубинов, К. В., Веденеев, В. В. and Парфенов, В. Г. Метод
разработки тестов для программных интерфейсов
приложений на основе конечно-автоматной модели
тестирования. Санкт-Петербург: Санкт-Петербургский
государственный университет информационных
технологий, механики и оптики.
[2] Khatko, E. E. and Fillipov, V. A. Mobile applications testing processes metrics and optimization criteria. Software Engineering. 2012, Vol.?
[3] Шмейлин, Б. З. Современные технологии тестирования
WEB приложений. Системы и средства информатики. 2009, pp. 138-147.
[4] Хатько, Е. Е. Об одном методе тестирования
«мобильных» приложений. Труды МФТИ. 2012.
[5] Карпов, Ю. Г. Теория автоматов. Санк-Петербург: Питер,
2003.
[6] Ural, H. Formal methods for test sequence generation. Computer communications. 1992, Vol. 15.
[7] Johnson, E. and Edmonds, J. Matching, Euler tours and the Chinese postman. Ontario: University of Waterloo, Waterloo, Ontario, Canada, 1972.
[8] Skiena, S. Eulerian cycle / Chinese postman. The algorithm design manual. New York: Springer, 2012.
[9] —. The algorithm design manual – Graph Traversal. The algorithm design manual. London: Springer, 2008, pp. 162-169.
[10] Кормен, Т. Х., et al. Алгоритмы: построение и анализ. Москва: Вильямс, 2006.
[11] Decher R., Pearl J. Generalized Best-First Search Strategies and the Optimality of A*. Journal of the Association for Computing Machinery. 1985, Vol. 32, 3.
[12] Современные проблемы фундаментальных и прикладных
наук. Хатько, Е. Е. Москва, Долгопрудный: s.n., 2010.
Один способ реализации алгоритма генерации тестов в
тестировании на основе моделей. Vol. 1, pp. 92-95. 52.
[13] Edmonds, J. Matching, Euler tours and the Chinese postman. Canada: University of Waterloo, 1972.
[14] Хатько, Е. Е. and Филиппов, В. А. Алгоритмы генерации тестовых сценариев для повышения качества
программного обеспечения многозадачных
пользовательских комплексов. Качество. Инновации.
Образование. 2011, Vol. 10, pp. 47-52.
[15] Open Source Software Engineering Tools. mbt.tigris.org. [Online] http://mbt.tigris.org/.