ISSN: 1992-8645 www.jatit.org E-ISSN: 1817-3195
EDGE DETECTION TECHNIQUE OF MICRO ACCESSORY
PENGLE CHENG
School of Technology, Beijing Forestry University, Beijing, 100083, China
ABSTRACT
In order to improve the precision of vision inspection system for micro accessory, edge detection technique of micro accessory was studied. Firstly, the imaging features of the micro accessory inspection system were analyzed. Fraunhofer diffraction happens, because the light wave is restricted by microscope. Secondly, optical characteristics of micro images were analyzed. The gray curve of the micro image edge does not change with the different inspected accessories. The threshold function of the edge detection was put forward according to the Analysis of dividing rule diffraction fringe. Finally, the threshold function of the edge detection was applied to gauge block and pendulum block. Experimental results indicate that the maximum error of the gauge block inspection is 0.22µm and the maximum error of the pendulum block
inspection is 0.28µm. The measuring precision of figures is up to sub-pixel and the measuring precision of
micro accessories is up to submicron. It can satisfy the system requirements of the micro accessory inspection.
Keywords: Micro Accessory, Computer Vision, Edge Detection, Fraunhofer Diffraction, Subpixel
1. INTRODUCTION
Inspection technique of micro accessory is one of the advanced techniques in advanced manufacturing technology and has been studied in many countries [1-3].The dimension of micro accessory geometric features lies between 0.01mm to 10mm. It is also called intermediate scale accessory from international view [4, 5]. Micro dimension, complicated shape, high precision are the characteristics of micro accessory. Traditional inspection technique can not meet the measurement of micro accessory, so it is an urgent need to develop a high accurate, simple and low costing inspection method [6]. The vision inspection system based on CCD can meet the measurement of micro accessory [7-9].
Increase of the CCD pixels and decrease of the view field can improve the precision of the vision inspection system. Increase of the CCD pixels may cause cost increase greatly. For the dimension of the micro accessory is small, microscope is used as optical imaging element in the micro accessory inspection system. The micro accessory is measured based on CCD image. Image edge is the main characteristic information of the micro accessory image and provides the important structural information of the micro accessory, so edge inspection is very important to the micro accessory inspection system.
The edge of the micro digital image has a smooth gray change in background. It is similar to the ordinary digital image. There is a transition region between object and background. The real edge of the micro accessory exists in the transition region. There are many studies on edge inspection of the ordinary image based on transition region [10-12]. The object of the microscopic observation is micro object in short distance. The feature of the microscope is the small aperture of objective lens and the short focal length. Fraunhofer diffraction happens, because the light wave is restricted by microscope. The transition region of the micro digital image edge is different with the ordinary digital image edge. The exiting detection algorithms of the image edge based on the ordinary digital image do not take the influence of the imaging system into consideration. There is a certain width in the detected edge, so the exiting detection algorithms are not suitable to micro digital image detection.
MVM-1 Type microcomputer inspection instrument (CCD resolution 1392×1040; pixel size 6.45µm×6.45µm) was used in this experiment. The
ISSN: 1992-8645 www.jatit.org E-ISSN: 1817-3195
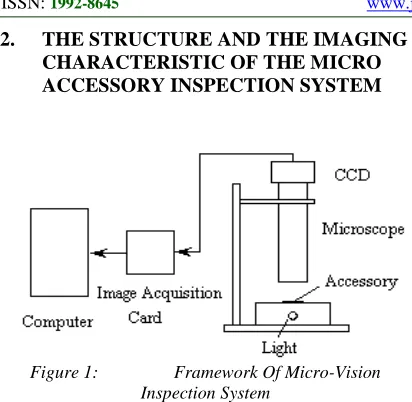
[image:2.612.90.296.80.281.2]2. THE STRUCTURE AND THE IMAGING CHARACTERISTIC OF THE MICRO ACCESSORY INSPECTION SYSTEM
Figure 1: Framework Of Micro-Vision Inspection System
2.1The Structure of The Micro Accessory Inspection System
The micro accessory inspection system consists of light, microscope, CCD, image acquisition card, computer and image processing software, as shown in Fig. 1. The micro accessory image is formed on the CCD through microscope. The image is acquired in real time by the image acquisition card. Then the image can be observed on the screen and can be recognized and measured by the image processing software.
2.2 The Imaging Characteristic of The Micro Accessory Inspection System
Microscope imaging system was used to improve the resolution and the detection precision of the micro accessory inspection system. The detection precision was up to micron-size. It was already close to wavelength, so the detection precision and the resolution were effected mostly by the ripple effect of the lightwave. The minimum resolution of the system must meet with Eq. (1)
0.61 0
. . m
y
N A λ
δ = (1)
in which λ0 is the wavelength of the light used
in the system, andN A. .the numerical aperture of the microscope. The numerical aperture of this system is 0.65. The light of the system is yellow light. It’s wavelength is 600nm. Substituting the
parameters into Eq.(1), we obtain δym=0.56
µm
Figure 2: Schematic Diagram Of Diffraction Imaging
As shown in Fig. 2, fraunhofer diffraction happens, because the light wave is restricted by microscope. A point object on the object plane can not be obtained as a point on the image plane. It becomes intensity distribution on the image plane. The image of a point object can not be a point. The points on the object are transformed to overlapping diffraction spots on the image plane. The points on the digital image can not reflect the real points of the object. One of inspection tasks is to obtain the corresponding relationship between the points in the edge region on image and the points on the micro accessory edge.
3. ANALYSIS ON THE EDGE FEATURES OF MICRO DIGITAL IMAGE
3.1 The Edge Features of Micro Digital Image Overlapping diffraction spots appear under irradiation of diffused light. All the diffraction spots have the same function form, fraunhofer diffraction[13], as shown in Fig. 3. The transition of the edge region between the micro accessory and the background in the digital image is a smooth transition. The transition function of the edge region must meet with fraunhofer diffraction function:
2 1 0
2 ( ) ( ) ( J x ) I x I
x
= (2)
in which J x1( ) is the first order bessel function,
0
I the ideal light intensity function, and I x( ) the light intensity function along the diffraction image.
Figure 3: Micro-Image Edge Intensity Profile
[image:2.612.321.508.458.619.2]ISSN: 1992-8645 www.jatit.org E-ISSN: 1817-3195
3.2 The Calibration of the Micro Digital Image
Figure 4: Micro Image Of Dividing Rule
The pixel counts of the micro accessory image must be converted to the actual dimensions of the micro accessory during the micro accessory inspection. The actual dimensions represented by one pixel are different in different amplification, so the system must be calibrated before inspection to set up the scale. The optical length scale is imaged through the micro accessory inspection system when the system is calibrated. The actual dimension of optical length scale divides the corresponding pixel counts. This is the scale of the micro accessory inspection system. The image of the optical length scale used in the system is shown in Fig. 4. The dimension of each bright fringe is 5µm and the dimension of each dark fringe is also
5µm. The error of each fringe dimension is 0.01µm.
The scale of the system: b k
n
= (3)
in which b is the actual dimension of the fringe, and n the corresponding pixel counts in the digital image.
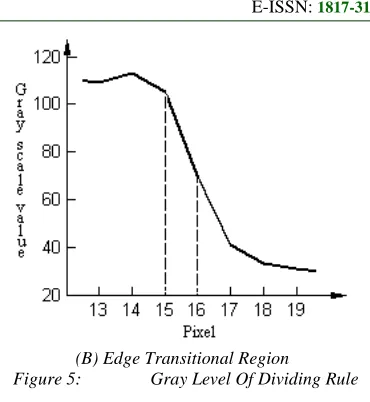
(A) GreyLevel Of Section
[image:3.612.328.513.78.279.2](B) Edge Transitional Region
Figure 5: Gray Level Of Dividing Rule
According to Eq. (2), the light intensity along the edge in the micro accessory image is only related to the system features. If the microscope, CCD, and the light do not change, the light intensity along the edge will not change. The light intensity along the
edge is not related to the accessory, so I x I( ) 0
calculated through the optical length scale can be used to detect the edge of the micro accessory.
The profile gray scale of the optical length scale is shown in Fig. 5. In one cycle of bright and dark, the width of the optical length scale is eighteen pixels. The width of the bright fringe is the same with the dark fringe, so the width of one fringe is nine pixels. As shown in Fig. 4, the edge point of the bright fringe is the fifteenth point. The gray value of the fifteenth point is 105. The edge point of the dark fringe is the sixteenth point. It's gray value is 70. According to Eq. (3), the scale factor of the micro accessory inspection system:
5µm 0.556 9
k= = µm (4)
One pixel in the digital represents the actual dimension of the micro accessory, 0.556µm. The
actual edge position between the bright fringe and the dark fringe should contain between the fifteenth point and the sixteenth point.
(15) (16)
( ) 87.5
2
I I
I x = + = (5)
The calculation of I0 consults the average
gradient algorithm in the Ref. [11]. The value of I0
is 109.
0
( )
[image:3.612.108.275.83.253.2]ISSN: 1992-8645 www.jatit.org E-ISSN: 1817-3195
4. THE EXPERIMENT AND THE RESULT OF THE INSPECTION
Smooth grinding and LIGA micro accessories were selected to be inspected in order to test and verify the threshold function.
(A) Micro Image Of Gauge Block
(B) Edge Transition Region
Figure 6: Micro Image And Edge Feature Of Gauge Block
4.1 The Measurement of The Gauge Block The width of the gauge block is 0.5mm. The micro image and the right edge feature are shown in Fig. 6.
The edge features of the gauge block are the same with the edge features of the optical length scale. They all correspond to the fraunhofer diffraction. The position of the edge is calculated with the Eq. (6). The calculation indicates that the position of the right edge is the position of the broken line, as shown in Fig. 6(b). The left edge can be calculated in the same method. The width of the gauge block is 900.2 pixels, 0.50011mm. The error of the measurement is 0.11µm. The gauge
[image:4.612.103.516.75.738.2]block was measured ten times under the same condition, and the result was shown in Tab. 1.
Table 1: Measuring Result Of Gauge Block
Measurement
times Pixel Length(mm) Error(µm)
1 900.2 0.50011 0.11
2 900.4 0.50022 0.22
3 899.8 0.49989 0.11
4 900.1 0.50006 0.06
5 900.0 0.50000 0.00
6 899.6 0.49978 0.22
7 899.7 0.49983 0.17
8 899.6 0.49978 0.22
9 900.1 0.50006 0.06
10 900.3 0.50017 0.17
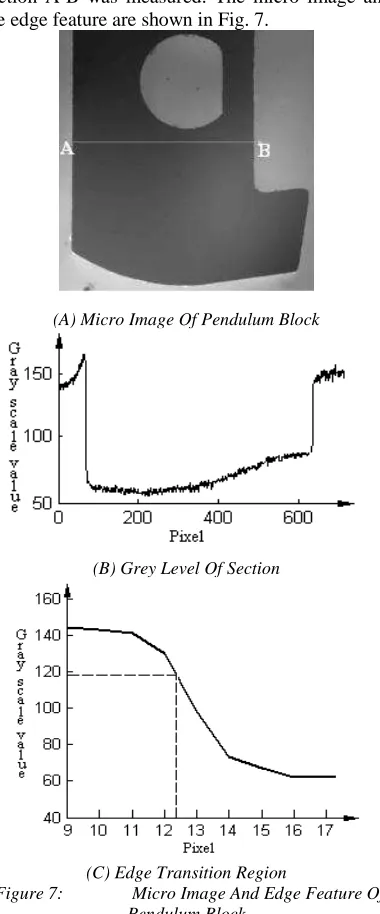
4.2 The Measurement of the Pendulum Block The micro pendulum block made with LIGA craft was selected to be measured. The width of section A-B was measured. The micro image and the edge feature are shown in Fig. 7.
(A) Micro Image Of Pendulum Block
(B) Grey Level Of Section
[image:4.612.310.528.104.219.2](C) Edge Transition Region
[image:4.612.326.516.266.723.2]ISSN: 1992-8645 www.jatit.org E-ISSN: 1817-3195
The edge features of the pendulum block are the same with the edge features of the optical length scale. They all correspond to the fraunhofer diffraction. The position of the edge is calculated with the Eq. (6). The calculation indicates that the position of the left edge is the position of the broken line, as shown in Fig. 7(c). The right edge can be calculated in the same method. The width of the pendulum block is 568.3 pixels, 0.31572mm. The error of the measurement is 0.28µm. The
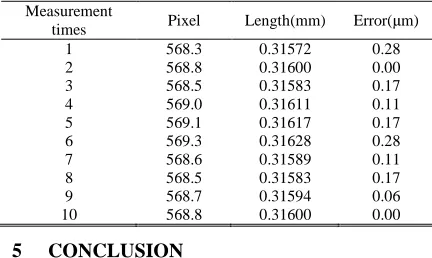
[image:5.612.84.300.254.383.2]pendulum block was measured ten times under the same condition, and the result was shown in Tab. 2.
Table 2: Measuring Result Of Pendulum Block
Measurement
times Pixel Length(mm) Error(µm)
1 568.3 0.31572 0.28
2 568.8 0.31600 0.00
3 568.5 0.31583 0.17
4 569.0 0.31611 0.11
5 569.1 0.31617 0.17
6 569.3 0.31628 0.28
7 568.6 0.31589 0.11
8 568.5 0.31583 0.17
9 568.7 0.31594 0.06
10 568.8 0.31600 0.00
5 CONCLUSION
According to the features of the micro accessory and the high measurement precision, the micro vision inspection methord was put forward. The structure and the operating principle were analyzed. The edge optical feature of the micro accessory image was studied. Fraunhofer diffraction happens, because the light wave is restricted by microscope. According to fraunhofer diffraction function, the light intensity along the edge in the micro accessory image is only related to the system features. If the microscope, CCD, and the light do not change, the light intensity along the edge will not change. The light intensity along the edge is not related to the accessory. The system was calibrated with the optical length scale to ascertain the threshold function. Experimental results indicate that the maximum error of the gauge block inspection is 0.22µm and the maximum error of the
pendulum block inspection is 0.28µm. It can satisfy
the system requirements of the micro accessory inspection.
ACKNOWLEDGEMENTS
This Project supported by National Natural Science Foundation of China (Grant No.31200431)
REFERENCES:
[1] K. Kling, D. Mewes, "Quantitative measurements of micro- and macromixing in a stirred vessel using planar laser-induced fluorescence," Journal of Visualization, Vol. 6, No. 2, 2003, pp. 165-173.
[2] J. B. Liao, M. H. Wu, R. W. Baines, "A coordinate measuring machine vision system," Computers in Industry, Vol. 38, No. 3, 1999, pp. 239-248.
[3] V. H. Chan, C. Bradley, G. W. Vickers, "A multi-sensor approach to automating coordinate measuring machine-based reverse engineering[," Computers in Industry, Vol. 44, No. 3, 2001, pp. 105-115.
[4] Workshop Report, "Workshop on micro/meso-mechanical manufacturing," Evanston, Illinois, USA, Northwestern University, 2000.
[5] Z.J. Zhang, X. Jin, M. Zhou, "Precise and microminiature manufacturing theory, technology and its appliance," Chinese Journal of Mechanical Engineering, Vol. 43, No. 1, 2007, pp. 49-61.
[6] Y.H. Wu, H.G. Jia, L.D. Wang, "Micro Measurement: Development and Application," Optics and Precision Engineering, Vol. 6, No. 2, 1998, pp. 15-17.
[7] Q. Liao, L. Mi, Y. Zhou, "Design for precision measurement system based on machine vision," Journal of Chongqing University, Vol. 25, No. 12, 2002, pp. 21-23.
[8] J.G. Wu, H.Z. Bin, "Dimensional inspecting system of thin sheet parts based on machine vision," Optics and Precision Engineering, Vol. 15, No. 1, 2007, pp. 124-129.
[9] Z.J. Zhang, F. Du, X. Jin, "Complex edge recognition algorithm of micro-accessory," Optics and Precision Engineering, Vol. 17, No. 2, 2009, pp. 356-361.
[10] Y.J. Zhang, "Transition region and image segmentation," Acta Electronica Sinica, Vol. 24, No. 1,1996, pp. 12-17.
ISSN: 1992-8645 www.jatit.org E-ISSN: 1817-3195
[12] Y. Tian, J.J. Liu, Y.B. Xie, "Extraction of transition region and image segmentation based on local fuzzy variance," Journal of Infrared and Millimeter Waves, Vol. 26, No. 5, 2007, pp. 386-389.