Context-Aware Network Security
by
Sushant Sinha
A dissertation submitted in partial fulfillment of the requirements for the degree of
Doctoral of Philosophy (Computer Science and Engineering)
in The University of Michigan 2009
Doctoral Committee:
Professor Farnam Jahanian, Chair Professor Kang G. Shin
Assistant Professor Rahul Sami Research Scientist Michael D. Bailey
c
Sushant Sinha 2009 All Rights Reserved
ACKNOWLEDGEMENTS
First and foremost I would like to thank my advisor Farnam Jahanian for the exciting and fruitful research that we have done at the University of Michigan. He invested a significant amount of time and effort discussing research problems and critically questioning my research ideas. His unrelenting support for exploring new ideas was of great importance to me. I will always remember Farnam’s emphasis on going the extra mile to show the practical utility of a research project.
I thank Michael Bailey for working with me on a number of research projects. His ability to quickly distill important ideas from research projects is truly outstanding, and I am still learning from him. I would like to thank Jignesh Patel for interesting discussions on performance improve-ment of software systems. I would also like to thank my committee members Kang G. Shin and Rahul Sami for going through the dissertation and providing me useful feedback.
Additionally, I would like to thank Evan Cooke for his help with research papers and in demon-strating the importance of passion in one’s work. I would also like to thank my office mates Jon Oberheide, Mona Attarian, Dan Peek, Benjamin Wester, Ya-Yunn Su, Manish Anand, Ed Nigh-tangale, Kaushik Veeraghavan, Eric Vander Weele, Kaustubh Nyalkalkar, Yunjing, and Thomas Holland in providing an excellent environment for discussion and debates.
Last, but not the least, I thank my family for supporting my ”never ending” Ph.D journey, and my wife Khushbu for coping with my final, yet busy, days of dissertation.
TABLE OF CONTENTS
DEDICATION . . . ii
ACKNOWLEDGEMENTS . . . iii
LIST OF TABLES . . . vi
LIST OF FIGURES . . . viii
ABSTRACT . . . x
CHAPTERS 1 Introduction . . . 1
1.1 Context . . . 3
1.1.1 What is Security Context? . . . 5
1.1.2 Does Security Context Change? . . . 5
1.2 Main Contributions . . . 8
1.3 Organization of the Dissertation . . . 11
2 Workload Aware Intrusion Detection . . . 12
2.1 Related Work . . . 14
2.2 Designing a Workload-Aware IDS . . . 16
2.2.1 Separating Rules by Protocol Fields . . . 17
2.2.2 Formal Description . . . 23
2.2.3 Our Approach . . . 24
2.3 Evaluation . . . 28
2.3.1 Datasets and Computing Systems . . . 28
2.3.2 Processing Time and Memory Usage . . . 31
2.3.3 Application-specific Rules . . . 31
2.3.4 Variation with Threshold . . . 35
2.3.5 Comparison with Bro . . . 37
2.4 Dynamically Adapting to Changing Workload . . . 38
2.5 Conclusions and Directions for Future Work . . . 39
3 Network Aware Honeynet Configuration . . . 40
3.2 Limitations of Ad Hoc Honeynet Configurations . . . 44
3.2.1 Impact of Ad Hoc Configuration on Visibility . . . 44
3.2.2 Impact of ad hoc configuration on fingerprinting . . . 46
3.3 The Properties of Honeynet Configuration . . . 49
3.3.1 Need for Automatic Configuration . . . 50
3.3.2 Individual Host Consistency and Proportional Representation . . . 52
3.4 A Simple Technique for Honeynet Configuration . . . 53
3.4.1 Evaluating Correctness of Representative Configurations . . . 57
3.4.2 Evaluating Visibility of Representative Configuration by Network Monitoring . . . 57
3.4.3 Evaluating Visibility of Honeynet Configurations by Real Deploy-ments . . . 59
3.5 Conclusion . . . 60
4 Context-Aware Blacklist Generation . . . 62
4.1 Background and Related Work . . . 64
4.2 Effectiveness of Current Blacklists . . . 66
4.2.1 Experimental Setup . . . 66
4.2.2 Validating SpamAssassin . . . 67
4.2.3 Evaluation . . . 68
4.3 Exploring Inaccuracy of Current Techniques . . . 73
4.3.1 New Spamtrap Deployment . . . 73
4.3.2 Fixing Inaccuracy in SpamAssassin . . . 74
4.3.3 Mails on the Live Network . . . 74
4.3.4 Causes of Inaccuracy . . . 75
4.4 Context Aware Blacklist Generation . . . 78
4.4.1 Ratio-based Blacklisting . . . 80
4.4.2 Speculative Aggregation . . . 80
4.4.3 Implementation . . . 81
4.5 Evaluation . . . 83
4.5.1 Comparing the Three Approaches . . . 84
4.5.2 Stability of the Threshold-based Versus the Ratio-based Approach 85 4.5.3 Impact of Parameters on Speculative Aggregation . . . 85
4.5.4 Performance . . . 86
4.6 Discussions . . . 87
5 Conclusions and Directions for Future Work . . . 89
5.1 Lessons Learned . . . 89
5.1.1 Determining the Contextual Information . . . 90
5.1.2 Discovery of Contextual Information . . . 91
5.1.3 Incorporating Context Into the Security System . . . 91
5.2 Extending Context Aware Security To New Domains . . . 92
LIST OF TABLES
Table
1.1 Comparing the vulnerable population in four networks, by operating systems and TCP ports(from [72]). Different networks have different vulnerability profiles. . . . 6 1.2 The network application usage (Kbps) at 4 different networks. Different networks
have different usage models. . . 6 3.1 The lack of visibility into both the threat landscape, as well as the vulnerable
popu-lations for a variety of different honeynet configurations. . . 45 3.2 The top 5 TCP ports observed in a /24 sensor in network B/16, over a period of 5
months. Exploits change quickly over time. . . 50 3.3 Comparing the vulnerable population in four networks, by operating systems and
TCP ports. The vulnerable populations are different across networks. . . 51 3.4 The number of unique host configurations observed at six production networks for
various tests and their combinations. Each network has a surprisingly large number of unique configurations. . . 52 3.5 Evaluating representative honeynet configuration by visibility into the vulnerable
population. The percentage of vulnerable hosts for the top five services and top five operating systems in network B/16 match closely to the representative honeynet. . . 55 3.6 The visibility of configurations into the exploits on the network. The percentage
of network hosts that observed each of the top five exploits in network B/16 is compared with the distribution in the representative configuration. . . 57 3.7 The impact of different configuration approaches into threat visibility. Non-representative
configurations are misleading about the real threats to the network. . . 58 3.8 The importance of context. The top three attacks captured on honeynets
representa-tively configured for five different production networks, but placed within the same network. . . 59 4.1 The false positive and false negative rates for SpamAssassin (at different
thresh-olds) on four mail accounts that were manually sorted into spam and ham. Overall, SpamAssassin performs well. . . 68 4.2 False positive rate in percentage (overall and unique source IPs) for four different
blacklists. . . 71 4.3 False negative rate in percentage (overall and unique source IPs) for the blacklists.
4.4 Our spamtrap deployment by top level domains, number of emails received, and number of unique sources. . . 73 4.5 The false positive and false negatives rates when the spamtrap deployment is
ex-panded domain by domain. . . 75 4.6 The values of the threshold-based and ratio-based approaches and the corresponding
LIST OF FIGURES
Figure
1.1 (a) Packet rate as seen by each sensor normalized by /24 (from [24].) (b) The num-ber of darknets (of 31) reporting a port in the top 10 ports over a day, week, and month time frame (from [17].). Different networks have different attack surfaces. . 4 2.1 Average number of rules (out of 2,059) rejected by checking different protocol
fields for the DARPA dataset (99-test-w4-thu). . . 19 2.2 Average number of rules (out of 2,059) rejected by checking different protocol
fields for data from the border router of a large academic network. . . 20 2.3 An example evaluation tree that checks protocol fields to determine the set of rules
for matching an incoming packet. . . 21 2.4 Memory usage when rules are hierarchically arranged by protocol fields in the
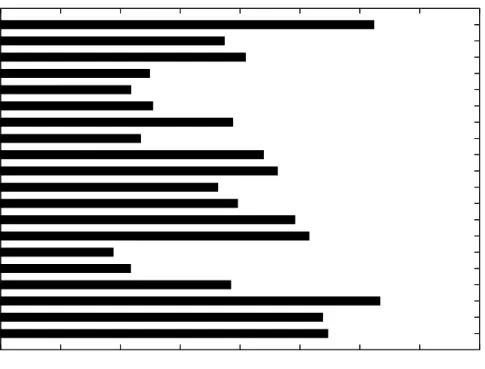
spec-ified order using the DARPA dataset (99-w4-thu). . . 22 2.5 Factor improvement, in terms of number of packets processed per second, when
compared to Snort for the 1998 and 1999 DARPA testing datasets. . . 29 2.6 Percentage of memory saved for each of the 1998 and 1999 DARPA datasets, when
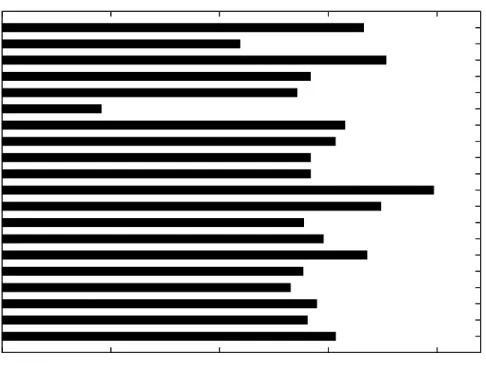
compared to Snort. . . 30 2.7 Factor improvement in number of packets processed per second, when compared to
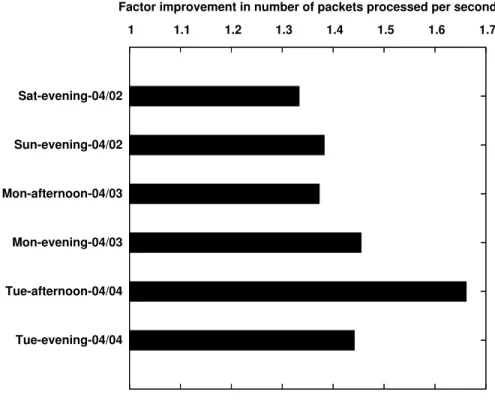
Snort, on data from a border router in an academic network. . . 32 2.8 Factor improvement in number of packets processed per second, when compared to
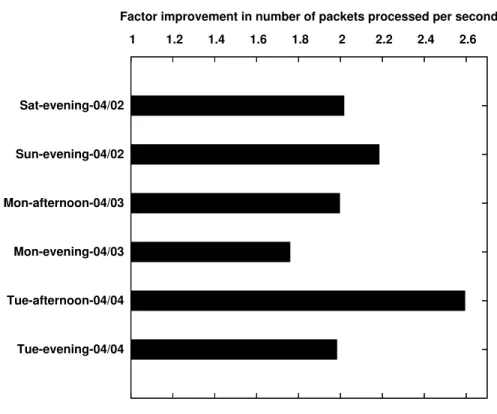
Snort, for web-based rules. These experiments were on traffic from a border router at an academic network. . . 33 2.9 Factor improvement in number of packets processed per second by Wind when
com-pared to Snort for web-based rules. The datasets include the 1998 and 1999 DARPA intrusion detection datasets. . . 34 2.10 The change in number of packets processed with the threshold for minimum number
of rules to be rejected, when compared to Snort (dataset: 98-test-w1-mon). . . 35 2.11 Variation in memory saving with the threshold for minimum number of rules to be
rejected, when compared to Snort (dataset: 98-test-w1-mon). . . 36 2.12 Factor improvement when comparing Bro with Snort and Wind for the number of
packets processed per second (dataset: 99-test-w1-wed). . . 37 3.1 The rank of the first anomaly with ad hoc honeynet configurations in six networks
for various combinations of tests that identify operating systems and services. Most honeynets represent the first, or most, anomalous subnet in a network . . . 48
3.2 Evaluating representative honeynet configuration by resistance to fingerprinting. The representative honeynet is very resistant to fingerprinting. . . 55 4.1 Existing approaches to blacklist generation. Blacklisting policy is set globally and
enforced locally. . . 65 4.2 Number of mails per hour observed on the academic network. The overall mail rate
is further divided by ham, spam, and failed connections. . . 69 4.3 Cumulative distribution of SpamAssassin score for successfully delivered mail on
the network (total = 1,074,508). . . 69 4.4 The source IP distribution and the destination IP distribution for spam and ham. . . 70 4.5 A venn diagram showing the overlap in blacklists for correctly flagged spam
(over-lap in true positives). There is a significant over(over-lap among the blacklists. . . 72 4.6 A venn diagram to show the overlap in blacklists in incorrectly flagging ham as
spam (overlap in false positive). The blacklists rarely agree on these email messages. 72 4.7 (a) Number of mails sent by external spamming sources that were not observed
on any spamtrap. Most of these sources sent just one spam to our network. (b) The difference in false negatives when blacklisting only spammers whose activity appears in a short window, versus those whose activity appear at anytime in the past. (c) The amount of legitimate mail sent by our network to networks that sent us spam and legimate mail. . . 77 4.8 Our approach to reputation-based blacklist generation. Rather than enforcing a
global “one size fits all” policy, a local generation algorithm combines local us-age patterns (i.e, email usus-age), allocation information (i.e., BGP reachability), and global information (i.e., spamtraps) to make localized, tailored blacklist policies. . 79 4.9 The cumulative distribution function for cardinal distance between spamming sources. 80 4.10 Trade-off curve of the false positive rate and the false negative rate for the three
methods. . . 85 4.11 Impact of three parameters on the false positive rate and false negative rate for
spec-ulative aggregation. . . 87 4.12 (Left) The growth of the blacklist size for the three approaches. (Right) The impact
of blacklist size on the time to look up an IP address. The index size grows linearly, but the lookup time for an entry is very fast. . . 87
ABSTRACT
Context-Aware Network Security
by Sushant Sinha
Chair: Farnam Jahanian
The rapid growth in malicious Internet activity, due to the rise of threats like automated worms, viruses, and botnets, has driven the development of tools designed to protect host and network resources. One approach that has gained significant popularity is the use of network based security systems. These systems are deployed on the network to detect, characterize and mitigate both new and existing threats.
Unfortunately, these systems are developed and deployed in production networks as generic
systems and little thought has been paid to customization. Even when it is possible to customize these devices, the approaches for customization are largely manual or ad hoc. Our observation of the production networks suggest that these networks have significant diversity in end-host characteris-tics, threat landscape, and traffic behavior – a collection of features that we call thesecurity context
of a network. The scale and diversity in security context of production networks make manual or ad hoc customization of security systems difficult. Our thesis is that automated adaptation to the se-curity context can be used to significantly improve the performance and accuracy of network-based security systems.
In order to evaluate our thesis, we explore a system from three broad categories of network-based security systems: known threat detection, new threat detection, and reputation-network-based mitiga-tion. For known threat detection, we examine a signature-based intrusion detection system and show that the system performance improves significantly if it is aware of the signature set and the traffic characteristics of the network. Second, we explore a large collection of honeypots (or honeynet) that
are used to detect new threats. We show that operating system and application configurations in the network impact honeynet accuracy and adapting to the surrounding network provides a significantly better view of the network threats. Last, we apply our context-aware approach to a reputation-based system for spam blacklist generation and show how traffic characteristics on the network can be used to significantly improve its accuracy.
We conclude with the lessons learned from our experiences adapting to network security context and the future directions for adapting network-based security systems to the security context.
CHAPTER 1
Introduction
The Internet has significantly simplified public communication and enabled a variety of elec-tronic activities such as shopping, banking, reading blogs, and social networking. Many of these activities require end-users to divulge personal information, which is then automatically stored and processed by software components. With the increasingly ubiquitous nature of the Internet and the large number of vulnerabilities in software systems, the Internet has become an easy medium for information theft and abuse. Threats in the form of worms, viruses, botnets, spyware, spam, and denial of service [13, 19, 78, 48] are rampant on today’s Internet.
To counter these threats, a number of systems have been developed to protect host and network resources. The host-based security systems have visibility into the filesystem, processes, and net-work access on the machine at a very fine level of granularity. However, they require instrumenting end-hosts, and that can adversely impact the availability and performance of a production service. On the other hand, network-based security systems are easy to deploy because they require little or no modifications to the end-hosts. They receive an aggregated view of the network but have limited visibility into the end-hosts.
Due to the ease of deployment, network-based security systems have gained significant popular-ity in recent years. They can be broadly classified into three categories, i.e.,known threat detection systems,new threat detection systems, andreputation-based detection systems. Known threat detec-tion systems generally use signatures of known threats and include systems like Nessus [5] to detect vulnerable network services and Snort [67] to detect and mitigate known intrusions. New threat de-tection systems include anomaly dede-tection systems and unused resource monitoring systems such as
honeypots (e.g., honeyd [63]). Reputation-based systems use some measure of good or bad activity and then use it to detect new threats. These include domain blacklisting like Google Safe Browsing API [38] and spam blacklists like SpamHaus [11]. Since reputation-based systems use some known way to detect good or bad and then use the reputation to detect future threats, they fall somewhere in between the known threat detection systems and the new threat detection systems.
While network-based security systems themselves have improved considerably over time, they still take a “one-size fits all” approach when deployed in different networks. These systems are typically viewed as generic solutions and fail to leverage the contextual information available in the networks to customize their deployment. Unfortunately, this information may be critical to the performance and accuracy of these systems as the networks they are deployed in differ significantly with each other in terms of policy, the topological layout, the vulnerability landscape, the exploits observed, the traffic characteristics, etc.
Many network-based security systems acknowledge the need to adapt to the network. However, such adaptation is often decided in an ad hoc fashion or left to be manually configured. For ex-ample, honeypot systems like honeyd [63] come with a default configuration file for the operating system and the vulnerability configuration of the honeypots. While such systems can be manually configured by a network administrator, the scale of configuration and the diversity among different networks make it very challenging. For example, configuring honeynet in a network may require one to come up with operating system and application configuration for thousands of hosts. In ad-dition, the diversity among networks make it difficult for people to share their configurations and mitigate this effort.
Our thesis is that automatic adaptation to the network context will significantly improve the performance and accuracy of network-based security systems. In order to evaluate our thesis, we explore a system from three broad categories of network-based security systems: known threat detection, new threat detection, and reputation-based mitigation. For known threat detection, we examine a signature-based intrusion detection system and show that the system performance im-proves significantly if it is aware of the signature set and the traffic characteristics of the network. Second, we explore a large collection of honeypots (or honeynet) that are used to detect new threats. We show that operating system and application configurations in the network impact honeynet ac-curacy and adapting to the surrounding network provides a significantly better view of the network
threats. Last, we apply our context-aware approach to a reputation-based system for spam blacklist generation. We show how traffic characteristics on the network impact its accuracy and then develop a technique for automatically adapting the system to the traffic characteristics.
While we do not propose an automatedway to adapt any network-based security system, we lay down a rigorous path for analyzing the impact of context on the performance and accuracy of the system and then developing techniques that automatically take the context into account. The extensive studies that we present lay down the foundation for adapting a new security system to a given network context.
Adding context to computing so that they can better serve human needs has received significant attention from the academic community. Explicitly adding context for each user is too cumbersome and so most of these attempts have tried to leverage user group activities to automatically infer the context. In the mobile computing community, context in the form of location, role and time has been used to automatically adapt a mobile device [52]. For example, a cell phone can vibrate instead of ringing if it knows that a person is in a meeting. Search engine technologies have leveraged user clicks to determine the context for a query and improve search ranking [42]. They do not take explicit feedback from the users but automatically determine the context for a query by exploiting the large amount of click-through data.
In the following sections, we first explain what is meant by the security context of a network and argue that security context changes significantly over time and space. We then provide a brief overview of our techniques to automatically adapt three types of network-based security systems and show how these techniques significantly improve the performance and accuracy of these systems.
1.1
Context
Context can mean a variety of things to computer scientists, from one’s physical location, to one’s current desktop environment, to the task being performed, etc. We begin, therefore, by pro-viding a definition of what we mean by context and more specifically, context-aware security. We show that the properties important to context-aware security are, in fact, non-trivial to measure. However, we argue that if they can be measured, context may be used in a variety of ways that improve performance and accuracy of existing and new security applications.
(a) 0 10 20 30 40 Port ID 0 10 20 30 40
Number of Sensors Reporting Port
1 Day 1 Month 1 Week
(b)
Figure 1.1: (a) Packet rate as seen by each sensor normalized by /24 (from [24].) (b) The number of darknets (of 31) reporting a port in the top 10 ports over a day, week, and month time frame (from [17].). Different networks have different attack surfaces.
1.1.1 What is Security Context?
Short of unplugging our computers from the network and locking them in a room, there is no absolute security. At its most fundamental level, the security is a risk analysis activity in which prac-titioners decide what they wish to protect from whom and at what cost. The key to understanding these tradeoffs are three properties, which we define to make up a network’s security context:
• Vulnerability profile: The vulnerability profile represents the space of all possible targets and ideally all methods of unauthorized access to those services. In the traditional sense, this is a mapping between the device (i.e., machine), operating system, applications, and the list of known vulnerabilities for each. More broadly, this encompasses unknown vulnerabilities in server software and the social engineering path for access acquisition in client software.
• Attack surface: The attack surface represents the unique threats posed by attackers to the defenders of a particular network. In a traditional sense, it is a measure of the remote network exploits (either attempted or successful) directed at a particular network. In a broader sense, it encompasses the notion of who the attackers are, what resources they are interested in, and the current techniques for acquiring those resources. For example, while a network might run a large number of (potentially vulnerable) printer services, attackers may avoid these services due to their uniqueness (and hence difficulty in exploiting), as well as the limited value in compromising them. Of course, other attackers may feel just the opposite about having access to printed documents – the context matters.
• Usage model: While the attack surface helps prioritize the potential targets specified in the vulnerability surface by defining what the attackers are interested in and the current tools used to achieve them, the usage model helps defenders prioritize the importance of the services on the network. This prioritization may be as simple as defining what services are most used on a network, but may layer in notions of data importance, disclosure liability, opportunity costs on failure in availability, etc.
1.1.2 Does Security Context Change?
In the previous section, we defined security context to include a network’s attack surface, its vulnerability profile, and its usage model. However, before we talk about adaptation of security
Operating Networks System A/16 B/16 C#1/17 D#1/19 Windows 44 25 76 77 Cisco IOS 14 7 - -Apple 9 36 - -Linux 9 7 15 6 .HP printer 3 13 - -Solaris 9 7 1 2 *BSD 1 - 8 15 TCP Networks Port A/16 B/16 C#1/17 D#1/19 139 42 17 - -22 41 53 30 25 135 39 10 42 69 23 27 34 4 5 445 27 11 - -80 21 26 93 96 25 12 10 70 83 21 8 24 77 79 427 4 26 - -497 3 28 - -110 1 - 39 17
Operating Systems TCP ports
Table 1.1: Comparing the vulnerable population in four networks, by operating systems and TCP ports(from [72]). Different networks have different vulnerability profiles.
Hospital Library Regional Network Government Small College
APPL. IN OUT APPL. IN OUT APPL. IN OUT APPL. IN OUT
RTSP 96.25 1.91 HTTP 17,590 2,200 HTTP 1,390 231.43 HTTP 58,420 13,710 DNS 1.69 1.85 HTTPS 651.6 116.39 SSH 11.85 195.87 FLASH 4,080 84.75 HTTPS 3.49 .001 FLASH 706.02 13.13 HTTPS 108.49 98.11 HTTPS 1,280 1,400 SMTP 1.99 1.32 TCP/81 16.41 287.16 ESP 98.97 32.64 XBOX 1,010 1,610 LOTUS 1.73 .158 SMTP 100.83 166.51 SMTP 55.72 73.00 UNIDATA 947.91 950.88 NOTES -LDM
Table 1.2: The network application usage (Kbps) at 4 different networks. Different networks have different usage models.
device to the security context it is important to determine whether the security context changes. In this section, we examine the two main reasons for context change: the diversity among networks (spatial variation) and the dynamic nature of context (temporal variation). We argue that these changes are significant making any manual approach to context adaptation very difficult.
1.1.2.1 Spatial Variation of Context
As network and security practitioners, it should come as no surprise that different networks exhibit different characteristics. What we have found during our research, however, is that these differences are surprisingly large, pervasive, and have significant impacts on all aspects of the se-curity in an organization. For example, consider the issue of an organization’s vulnerability profile.
Table 1.1 compares the vulnerable population in these of four networks in two ways: by the operat-ing system and by the TCP port. Of the four production networks (A/16, B/16, C/17 and D/19), two of these networks (A/16 and B/16) are academic networks and two (C/17 and D/19) are web server farms. The second largest operating system in network A/16 is surprisingly Cisco IOS, which is found in the wireless access points and routers in the academic campus. On the other hand, Apple Mac OS is the dominant operating system in network B/16. As expected, the web-server farms were dominated by Windows servers. While SSH seems to be predominant service found in A/16 and B/16, HTTP, FTP and SMTP seems to be the dominant services in the web server farms. Therefore, the vulnerability profile may differ significantly depending on the network.
Today’s attacks are global and everyone see the “same stuff” right? Unfortunately, the threat landscape also differs significantly for different networks. Cooke et al. [24] monitored unused address spaces (darknets) in different networks. Since unused addresses do not have any legitimate services, the traffic directed to these addresses are suspicious. Figure 1.1 shows the packet rates observed by different sensors and normalized by /24 address range. It shows that some networks receive significantly more suspicious traffic than others. In Baileyet al.[17], we examined, for 31 darknets, the top 10 destination ports, based on the number of packets, and compared these lists across darknets. Figure 1.1 shows the number of darknets that had a particular destination port in their top 10 list. The analysis is performed for the top 10 destination ports over a day, a week, and a month time span. This figure shows that there are over 30 destination ports that appear on at least one darknet’s top 10 list. A small handful of these destination ports appear across most darknets (1433, 445, 135, 139), but most of the destination ports appear at less then 10 of the darknets. Not only are there more or less attacks based on where you are, those attacks are targeting different services as well.
The traffic characteristics of a network may also be significantly different than others. For ex-ample, the list of IP addresses that legitimately access services on a given network may be different from other networks. Similarly, HTTP may be the most prominent protocol in web server farms and SMTP may be the most prominent protocol in a mail service provider network. Consider the data in Table 1.2. While some applications (e.g., web) are global popular, many are not (e.g., Lotus Notes, XBox). Note also the stark differences in the magnitude of traffic as well as the different behavior as either servers (e.g., high in bound traffic) or clients (i.e., high outbound traffic) of a particular
service.
1.1.2.2 Temporal Variation of Context
Another interesting observation of our work is that these unique individual contexts are highly dynamic in nature. Attack surfaces, usage models, and even vulnerability profiles change rapidly as new attacks are released, flash crowds are formed, or new application emerge. As an example, consider Table 3.2 which shows the top five TCP ports and the number of packets observed over a day for five months on the a /24 darknet in the B/16 network. We find that new services were targeted heavily each month. The TCP ports 6000 and 1080 were the unusual ones targeted in April, the TCP port 5000 was targeted in May, the TCP ports 22 and 5900 were targeted in June, and TCP port 4444 in July. The highly variable nature of this threat landscape makes chasing exploits difficult for the defenders, who must adjust their vision of the attack surface to today’s or this week’s most popular attacks.
1.2
Main Contributions
In the previous section, we found that the security context changes significantly with time and space. Our thesis is that such differences can be exploited to significantly improve the performance and accuracy of network-based security system. We justify our thesis by showing such improvement for three types of security systems namely: the known threat detection systems, the new threat detection systems and the reputation-based systems. We first explore how context information in the form of network traffic and signature set can be used to improve performance of signature-based security systems. We then look at why end-host characteristics and application configuration is important in the accuracy of the honeynet system and show how it can be automatically used to improve detection of new threats. Third, we investigate how network traffic impacts the accuracy of a reputation-based system like blacklist generation and show how traffic on a network may be utilized to generate accurate blacklists. We elaborate on these ideas in the remaining part of the thesis and we start by providing an overview of our main contributions:
Intrusion detection and prevention systems (IDS/IPS) take a set of signatures and detect in-trusions by matching them with network traffic. Existing approaches to signature evaluation apply statically-defined optimizations that do not take into account the network in which the IDS or IPS is deployed or the characteristics of the signature database. We argue that for higher performance, IDS and IPS systems should adapt according to the workload, which includes the set of input signatures and the network traffic characteristics.
We developed an adaptive algorithm that systematically profiles attack signatures and net-work traffic to generate a high performance and memory-efficient packet inspection strategy. We implemented our idea by building two distinct components over Snort: a profiler that ana-lyzes the input rules and the observed network traffic to produce a packet inspection strategy, and an evaluation engine that pre-processes rules according to the strategy and evaluates in-coming packets to determine the set of applicable signatures. We have conducted an extensive evaluation of our workload-aware Snort implementation on a collection of publicly available datasets and on live traffic from a border router at a large university network. Our evaluation shows that the workload-aware implementation outperforms Snort in the number of packets processed per second by a factor of up to 1.6x for all Snort rules and 2.7x for web-based rules with reduction in memory requirements. Similar comparison with Bro shows that the workload-aware implementation outperforms Bro by more than six times in most cases.
• Network-aware honeynet configuration
Honeynet is a collection of sacrificial hosts explicitly deployed to be scanned, compromised, and used in attacks. Honeynets have recently become popular to detect and characterize threats such as worms, botnets and malware. Unfortunately, existing approaches to deploying honeynets largely ignore the problem of configuring operating systems and applications on individual hosts, leaving the user to configure them in a manual and often ad hoc fashion. We demonstrate that such ad hoc configurations are inadequate: they misrepresent the security landscape of the networks they are trying to protect and are relatively easy for attackers to discover. Therefore, a honeynet configuration should take the deployment context i.e., the network in which it is deployed to provide visibility into attacks and resistance to fingerprint-ing.
We show that manually building honeynet configurations for each network is hard, as each network has its own unique threat and vulnerability spaces, and the potential number of hosts to configure in the honeynet is quite large. We argue that honeynets with individually consis-tent hosts and proportional representation of the network will achieve the two desired goals of visibility into network attacks and resistance to discovery. We develop an automated tech-nique based on profiling the network and random sampling to generate these honeynet con-figurations. Through experimental evaluation and deployment of configurations generated by our technique, we demonstrate significantly more visibility and higher resistance to discovery than current methods.
• Context-aware blacklist generation system
Blacklists have become popular among the operational community to filter or block the ex-plosive growth of unwanted traffic on the Internet. Blacklists generated from firewall logs are used to block compromised hosts and blacklists generated from spamtraps are used to block spam. While these techniques have gained prominence, little is known about their effective-ness and potential draw backs.
We performed a preliminary study on the effectiveness of reputation-based blacklists namely those that are used for spam detection. We examined the effectiveness, in terms of false positives and negatives, of four blacklists, namely NJABL, SORBS, SpamHaus and SpamCop and investigated into the sources of the reported inaccuracy. We found that the black lists studied in our network exhibited a large false negative rate. NJABL had a false negative rate of 98%, SORBS had 65%, SpamCop had 35% and SpamHaus had roughly 36%. The false positive rate of all blacklists were low except that of SORBS, which had an overall false positive rate of 10%. The false positive of SORBS came mostly from blacklisting six Google mail servers that sent significant amount of ham to our network. However, since very little is known about the approaches taken by these services to generate their blacklists, and only the results of the generation are available (not the raw data), no one has explored in depth the reasons for these failures.
To solve this problem, we propose a new context-aware approach to blacklist generation. By making use of local usage and reachability information, as well as the global information
provided by blacklists, we can provide a significant improvement over existing approaches. In particular, this context-aware paradigm enables two specific techniques: ratio-based black-listing and speculative aggregation. In the ratio-based blackblack-listing approach, the traffic on the live network is compared to the traffic on the spamtraps to determine if it is safe to blacklist an IP address. We call this approach the ratio-based approach as the ratio of email messages on the live network to the email messages on the spamtrap is used as a measure to blacklist an IP address. In the second approach, speculative aggregation, we use local reachability information as well as application history to predict where new spam messages will come while limiting the chance that these predicted hosts or networks are of use to the local net-work. A deployment of context-aware blacklists for over a month in a large academic network demonstrated significant improvement in blacklist accuracy.
1.3
Organization of the Dissertation
The remaining dissertation is structured as follows: Chapter 2 shows how performance of an intrusion detection and prevention system can be significantly improved by adapting to the network traffic and the rule set. Chapter 3 argues that configuration of a honeynet should account for sur-rounding network and proposes an automated approach to configure such honeynets. Chapter 4 shows that the current methods for generating blacklists are inaccurate and presents a more accurate blacklist generation approach that is aware of the network context. Finally, Chapter 5 concludes our current work and presents future plans to explore new types of context information to improve network-based security systems.
CHAPTER 2
Workload Aware Intrusion Detection
Intrusion Detection Systems (IDS) and Intrusion Prevention Systems (IPS) are widely deployed in a large number of organizations to detect and prevent attacks against networked devices. This chapter explores the performance bottlenecks of IDSs and IPSs and demonstrates that an adaptation to the deployment context will significantly speed up these systems.
The core component of popular IDSs, like Snort [67], is a deep packet inspection engine that checks incoming packets against a database of known signatures (also called rules). The perfor-mance of this signature-matching system is critical to the scalability of IDS and IPS systems, in-cluding packet per second rate. The dominant factor in determining the performance of this signa-ture matching engine, whether implemented in software or hardware, is the number and complexity of the signatures that must be tested against incoming packets. However, both the number and complexity of rules appears to be increasing. For example, the recent Windows Meta-File (WMF) exploit [49] required inspecting and decoding more than 300 bytes into the HTTP payload which could quickly overwhelm the CPU of the IDS or IPS, causing massive packet drops [43].
As a result, there has been significant effort in developing methods for efficient deep packet inspection. Current IDSs like Snort and Bro attempt to evaluate as few rules as possible in a highly parallel way. For example, Snort pre-processes rules to separate them by TCP ports, and then parallelizes the evaluation based on port. However, these groupings can be inefficient because all of the rules in a given group do not apply to incoming packets. Moreover, separating rules by multiple protocol fields in a naive way does not solve the problem because of the additional memory overhead associated with managing groups.
In this chapter, we argue that IDS and IPS should dynamically adapt the parallelization and separation of rules based on the observed traffic on the network and the input rules database. That is, all IDS and IPS workloads are not the same, and systems should adapt to the environment in which they are placed to effectively trade-off memory requirements for run-time rule evaluation. To demonstrate this idea, we have developed an adaptive algorithm that systematically profiles the traffic and the input rules to determine a high performance and memory efficient packet inspection strategy that matches the workload. To effectively use memory for high performance, the rules are separated into groups by values of protocol fields and then these rule groups are chosen to be maintained in memory following a simple idea of “the rule groups that have a large number of rules and match the network traffic only a few times should be separated from others.” This idea follows our observation that if rules with valuev for a protocol field are grouped separately from others, then for any packet that does not have valuevfor the protocol field, we can quickly reject all those rules, and if only a few packets have that value, then those rules will be rejected most of the time. Therefore, our workload-aware scheme aims to determine a small number of effective groups for a given workload.
Our algorithm determines which rule groups are maintained in the memory by choosing pro-tocol fields and values recursively. It first determines the propro-tocol field that is most effective in rejecting the rules, and then separates those groups with values of the chosen protocol field that reject at least a threshold number of rules. After forming groups for each of these values, the algo-rithm recursively splits the groups by other protocol fields, producing smaller groups. In this way, we generate a hierarchy of protocol fields and values for which groups are maintained. By lower-ing the threshold, memory can be traded-off for performance. Uslower-ing this systematic approach for computing a protocol evaluation structure, we automatically adapt an IDS for a given workload.
In this chapter we develop a prototype Snort implementation based on our workload-aware framework, which we call Wind. The implementation has two main components. The first com-ponent profiles the workload (i.e., the input rules and the observed network traffic) to generate the hierarchical evaluation tree. The second component takes the evaluation tree, pre-processes the rules, and matches incoming packet to the rules organized in the tree.
We evaluate our prototype workload-aware Snort implementation on the widely recognized DARPA intrusion detection datasets, and on live traffic from a border router at a large live
aca-demic network. We find that our workload-aware algorithm improves the performance of Snort up to 1.6 times on all Snort rules and up to 2.7 times for web-based rules. Surprisingly, we also find that the algorithm reduces memory consumption by 10−20%. We also compare the workload-aware algorithm with Bro, and find it outperforms Bro by more than six times on most workloads.
To summarize, the main contributions of this chapter are:
• We propose a method for improving the performance of IDS and IPS systems by adapting to the input rules and the observed network traffic.
• To demonstrate our idea, we constructed a workload-aware Snort prototype called Wind that consists of two components: a component that profiles both the input rules and the observed network traffic to produce an evaluation strategy, and a second component that pre-process the rules according to the evaluation strategy, and then matches incoming packets.
• We evaluate our prototype on publicly-available datasets and on live traffic from a border router. Our evaluation shows that Wind outperforms Snort up to 1.6 times and Bro by six times with less memory requirements.
The rest of the chapter is organized as follows: Section 2.1 discusses the related work. Sec-tion 2.2 presents the design of Wind and SecSec-tion 2.3 presents empirical results comparing Wind with existing IDSs. Section 2.4 discusses techniques for dynamically adapting Wind to changing workloads. We finally conclude with directions for future work in Section 2.5.
2.1
Related Work
The interaction between high-volume traffic, number of rules, and the complexity of rules has created problems for Intrusion Detection Systems that examine individual flows. Dregeret. al.[29] present practical problems when Intrusion Detection Systems are deployed in high-speed networks. They show that current systems, like Bro [60] and Snort [67], quickly overload CPU and exhaust the memory when deployed in high-volume networks. This causes IDS to drop excessive number of packets, some of which may be attack incidents. Therefore, they propose some optimizations to reduce memory consumption and CPU usage which are orthogonal our approach.
Leeet. al.[46] find that it is difficult to apply all possible rules on an incoming packet. There-fore, they evaluated the cost-benefit for the application of various rules and determined the best set of rules that can be applied without dropping packets. However, they trade-off accuracy for achiev-ing high bandwidth. Kruegel and Valeur [45] propose to slice traffic across a number of intrusion detection (ID) sensors. The design of their traffic slicer ensures that an ID sensor configured to apply certain rules on a packet does not miss any attack packet.
Sekaret. al.[69] developed a high-performance IDS with language support that helps users eas-ily write intrusion specifications. To specify attack signatures within a payload, they used regular expressions. This specification is different from Snort in which attack signatures contain exact sub-strings, in addition to regular expressions, to be matched with a payload. Using regular expressions is a more generic approach than using substrings to specify an attack signature. However, regu-lar expressions are more expensive to evaluate than exact substring matches. (The complexity of checking a regular expression of sizemover a payload of sizenisO(mn)[40] and it is more expen-sive than checking for exact substring within a payload, which has a time complexity ofO(n)[40]). Aho-Corasick [40] matches a setof substrings over a payload inO(n). Alternative schemes like Wu-Manber [86] speed up matching by processing the common case quickly. The multi-pattern optimizations to speed up an Intrusion Detection System are complementary to our approach, as we speed up an IDS by reducing the expected number of patterns to be checked with a packet.
Versions of Snort prior to 2.0 evaluated rules one by one on a packet. This required multiple passes of a packet and the complexity of intrusion detection grew with the number of rules. To elim-inate redundant checking of protocol fields, rules that have the same values for a protocol field can be pre-processed and aggregated together. Then, a check on the protocol field value would equiva-lently check a number of rules. By clustering rules in this way and arranging the protocol fields by their entropy in a decision tree, Kruegel and Toth [44], and Egorov and Savchuk [30] independently demonstrated that Snort (version 1.8.7) performance can be improved up to three times. However, these papers only examined the input rules to determine the rule evaluation order. In contrast, we analyze the traffic, as well as the rules, to determine the rule evaluation order. Secondly, they use entropy as an ordering metric, whereas we use a more intuitive metric for selecting as few rules as possible. Lastly, a naive arrangement of protocol fields would drastically increase memory usage, and these papers have not considered the memory costs associated with their approaches. Wind
improves performance and at the same time reduces the memory usage of an intrusion detection and prevention system.
Snort 2.0 [56] uses a method in which rules are partitioned by TCP ports, and a packet’s des-tination and source port determines the sets of applicable rules. Then, the content specified by these applicable rules are checked in one pass of the payload, using either the Aho-Corasick or the Wu-Manber algorithm, for multiple substring search. If a substring specified in some attack rule matches with the packet, then that rule is evaluated alone. We found that the parallel evaluation sig-nificantly sped up Snort. Snort now takes 2-3 microseconds per packet, when compared to earlier findings of 20-25 [30] microseconds per packet for Snort versions prior to 2.01. This optimization significantly improved Snort performance. Nevertheless, we further speed up a multi-rule Snort on many workloads. This is achieved by leveraging the workload to partition rules in an optimized evaluation structure.
Recently, specialized hardware [68, 21] for intrusion detection in high-volume networks has been developed. These solutions have used Field-programmable gate array (FPGA) to implement the intrusion detection systems. As a result hardware-based solutions are complex to modify (e.g., to change the detection algorithm). The automated adaptation technique presented in this paper can be implemented using FPGA’s as well and further improve the performance of these systems.
Our work is also related, and inspired, by database multi-query optimization methods that have long been of interest to the database community (see [32, 71, 70, 59] for a partial list of related work). However, rather than finding common subexpressions amongst multiple SQL queries against a static database instance, the problem that we tackle requires designing a hierarchical data structure to group network rules based on common subexpressions, and using this data structure in a data streaming environment.
2.2
Designing a Workload-Aware IDS
In this section, we first show that checking a protocol field can reject a large number of rules, and the number of rejected rules varies significantly with the protocol field. Then, we take this observation a step further and construct an evaluation strategy that decomposes the set of rules recursively by protocol fields and constructs a hierarchical evaluation tree. However, a naive strategy
that separates rules by all values of a protocol field will use too much memory. To address this issue, we present a mathematical model that addresses the trade-off between memory occupied by a group of rules and the improvement in run-time packet processing. Finally, we present a novel algorithm and a concrete implementation to capture statistical properties of the traffic and the rule set to determine a high-performance and memory-efficient packet inspection strategy.
2.2.1 Separating Rules by Protocol Fields
An IDS has to match a large number of rules with each incoming packet. Snort 2.1.3 [67] is distributed with a set of 2,059 attack rules. A rule may contain specific values for protocol fields and a string matching predicate over the rest of the packet. For example, a Snort rule that detects the Nimda exploit is shown below:
alert tcp EXTERNAL NET any -> HOME NET 139 (msg:‘‘NETBIOS nimda .nws’’; content:‘‘|00|.|00|N|00|W|00|S";)
This rule matches a packet if the value of transport protocol field is TCP, the value in the source address field matches the external network, the destination address field contains an address in the home network, the value of destination TCP port field is 139, and if the payload contains the string
‘‘|00|.|00|N|00|W|00|S".
A simple approach for evaluating multiple rules on an incoming packet is to check each rule, one-by-one. However, this solution involves multiple passes over each packet and is too costly to be deployed in a high-speed network. Therefore, the evaluation of the rules should be parallelized as much as possible and evaluated in only a few passes over the packet. To evaluate a protocol field in the packet only once, we need to pre-process rules and separate them by the values of the protocol field. Then, by checking the value of just one protocol field, the applicable rules can be selected. The advantage of separating rules by the protocol field values is that a large number of rules can be rejected in a single check. In Snort, the rules are pre-processed and grouped by destination port and source port. The TCP ports of an incoming packet are checked to determine the set of rules that must be considered further, and all other rules are immediately rejected. The expected number of rules that will be rejected by checking a protocol field of an incoming packet depends on two factors: the traffic characteristics and the rule characteristics. Consider an input rule set with a large number of rules that check if the destination port is 80. Assuming that the rules are grouped together
by the destination port, for a packet not destined to port 80, alargenumber of port-80 rules will be rejected immediately. If only a few packets are destined to port 80, then alargenumber of rules will be rejectedmostof the time.
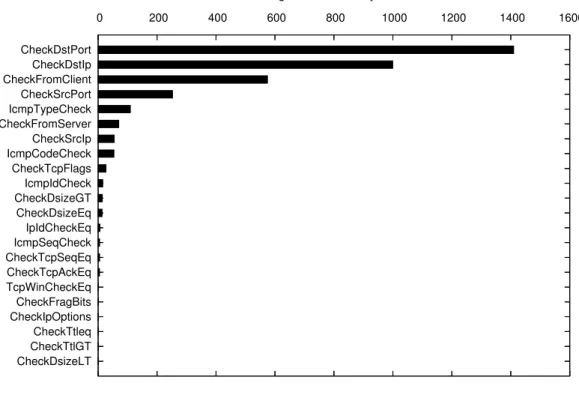
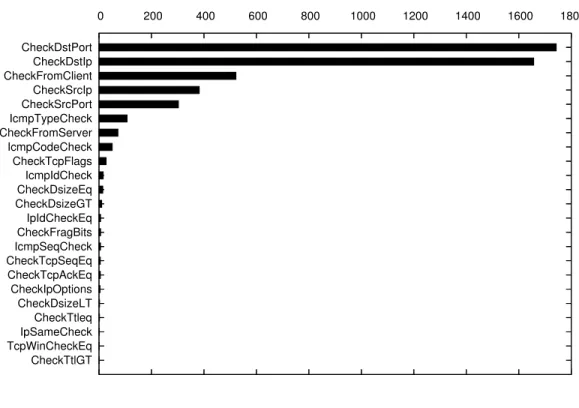
Figure 2.1 shows the number of rules that can be rejected immediately for an incoming packet when rules are grouped by different protocol fields. For this figure, we used the 2,059 rules that came with Snort 2.1.3 distribution and the traffic is from the Thursday on the fourth week of 99 DARPA dataset (99-test-w4-thu). Figure 2.2 shows a similar graph, using the same set of rules on a border router in a large academic network. The graphs show that checking the destination port rejects the maximum number of rules, which is followed by destination IP address and then by the check that determines whether the packet is from a client. The source IP address is fourth in the list for the border router traffic and seventh in the DARPA dataset. After this, most other protocol fields reject a small number of rules. Therefore, the graphs show that the rule set and the traffic mix cause varying number of rules to be rejected by different protocol fields.
Now, checking whether a payload contains a particular string is a costly operation, but checking the value of a protocol field is cheap. So, it is preferable to check protocol fields to reduce the number of applicable rules. To use multiple protocol fields for reducing the applicable rules, the rules have to be pre-processed in a hierarchical structure in which each internal node checks a protocol field and then divides the rules by the values of the protocol field. Finally, the leaf node is associated with a set of rules and a corresponding data structure for evaluating multiple patterns specified in the rules. We are agnostic to the multi-pattern search algorithm and the only objective of this hierarchical evaluation is to reduce the number of applicable rules, so that a packet is matched with as few rules as possible.
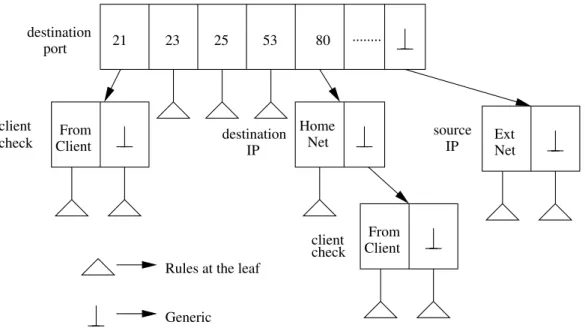
Figure 2.3 shows an example of an evaluation tree in which protocol fields are hierarchically evaluated to determine the set of applicable rules. It first checks for destination port. If the desti-nation port matches a value for which the set of rules is maintained then those groups of rules are further analyzed, or else the generic set of rules is picked. If the destination port is 21, the connec-tion table is checked to determine if the packet came from the client who initiated the connecconnec-tion, and the corresponding rules are picked. If the destination port is 80, then the destination IP address of the packet is checked. Then, depending on whether the packet is destined to the Home Network or not, the correct set of rules are picked to further evaluate on the packet. However, maintaining
0 200 400 600 800 1000 1200 1400 1600 CheckDstPort CheckDstIp CheckFromClient CheckSrcPort IcmpTypeCheck CheckFromServer CheckSrcIp IcmpCodeCheck CheckTcpFlags IcmpIdCheck CheckDsizeGT CheckDsizeEq IpIdCheckEq IcmpSeqCheck CheckTcpSeqEq CheckTcpAckEq TcpWinCheckEq CheckFragBits CheckIpOptions CheckTtleq CheckTtlGT CheckDsizeLT
avg. num. of rules rejected
Figure 2.1: Average number of rules (out of 2,059) rejected by checking different protocol fields for the DARPA dataset (99-test-w4-thu).
0 200 400 600 800 1000 1200 1400 1600 1800 CheckDstPort CheckDstIp CheckFromClient CheckSrcIp CheckSrcPort IcmpTypeCheck CheckFromServer IcmpCodeCheck CheckTcpFlags IcmpIdCheck CheckDsizeEq CheckDsizeGT IpIdCheckEq CheckFragBits IcmpSeqCheck CheckTcpSeqEq CheckTcpAckEq CheckIpOptions CheckDsizeLT CheckTtleq IpSameCheck TcpWinCheckEq CheckTtlGT
avg. num. of rules rejected
Figure 2.2: Average number of rules (out of 2,059) rejected by checking different protocol fields for data from the border router of a large academic network.
IP From Client From Client ... 80 53 25 23 21 Home
Net ExtNet
Generic Rules at the leaf client check destination port destination IP client check source
Figure 2.3: An example evaluation tree that checks protocol fields to determine the set of rules for matching an incoming packet.
a naive hierarchical index structure, in which every specific value of a protocol field is separated, consumes a significant amount of memory for the following two reasons:
1. Groups require memory: Multiple patterns from a set of rules have to be searched in a payload in only one pass of the payload. Therefore, additional data structures are maintained for fast multi-pattern matching. This structure can be a hash table as in the case of the Wu-Manber [86] algorithm, or a state table as in the case of the Aho-Corasick [40] algorithm. These structures consume a significant amount of memory.
2. Rules are duplicated across groups:If groups are formed by composing two protocol fields hierarchically, then the number of distinct groups may increase significantly. For example, assume that the rules are first divided by destination port, and then each group so formed is further divided by source port. A rule that is specific in source port but matchesany desti-nation port has to be included in all groups with a particular destidesti-nation port. If the groups that are separated by destination port are further divided by source port, then separate source port groups would be created within all the destination port groups. For a set of rules withn
source port groups andmdestination port groups, the worst number of groups formed, when rules are hierarchically arranged by the two protocol fields, isn×m.
0 100 200 300 400 500 600 destination_port actual_snort destination_port+from_client destination_port+destination_ip destination_port+destination_ip+from_client destination_port+source_port memory usage (MB)
Figure 2.4: Memory usage when rules are hierarchically arranged by protocol fields in the specified order using the DARPA dataset (99-w4-thu).
To investigate the memory consumed when rules are grouped hierarchically by different proto-col fields, we instrumented Snort to construct this structure for a given list of protoproto-col fields. We then measured the memory consumed for different combinations of protocol fields. Figure 2.4 shows the memory consumed when different protocol fields are hierarchically arranged, and a separate bin is maintained for every specific value in a protocol field (trace data was 99-w4-thu from DARPA dataset and the 2059 rules of Snort-2.1.3 distribution). This shows that the memory consumed by the combination of destination port and client check is 50% more than just the destination port. The memory required for the combination of destination port and destination IP address is two times, and for the combinations of destination port, destination IP address and client check, the memory consumed is three times than only using the base destination port. From the graph, the increase in memory is evident when the rules are hierarchically grouped by destination port and source port. Therefore, constructing such a hierarchy immediately raises two important questions:
1. What is the order in which the protocol fields are evaluated in the hierarchy?
2. What are the values of a protocol field for which groups are maintained?
In what follows, we first present a mathematical description of this problem, analyzing the cost and benefit of different orders of protocol fields and the field values for which the rules are maintained. We then argue that these questions can be answered by capturing properties of the workload, namely the traffic-mix characteristics and the input rule set characteristics.
2.2.2 Formal Description
In this section, we formulate the problem of determining the order of evaluation and the values of protocol fields for which the groups are maintained. As argued earlier, the cost in maintaining a separate group is mostly the memory consumed by the group. Intuitively, the benefit obtained by maintaining a group of rules can be measured by howmanyrules this group separates from the rule set and howfrequentlythis group is rejected for an incoming packet. We begin by formalizing the problem.
Considernprotocol fieldsF1,F2, . . . ,Fn. Letv1i,vi2, . . . ,vimi bemi specific values of the protocol
fieldFipresent in various rules in the rule set. Let
P
= (Fr1 =vr1 j1)∧(Fr2=v r2 j2)∧. . .∧(Fri =v ri ji)be
the predicate for a group that is picked only when the packet matches specific values foriprotocol fields, and f(
P
)denote the probability that the protocol fields for an incoming packet matches the predicateP
, i.e.,vr1j1 for protocol fieldFr1, v
r2
j2 for protocol fieldFr2, . . . , v
ri
ji for protocol fieldFri.
f(
P
)actually captures statistics on the network traffic. The probability that an incoming packet does not have the values for protocol fields as the predicateP
is 1−f(P
). Let the benefit of rejecting ruleRbe measured by improvement ofbRin run time. Then, every time a packet does not have the values for protocol fields as
P
, benefit of∑R=rule with valuePbRis obtained by maintaining a separate group of rules with valuesP
. Therefore, the overall benefit of creating a group with specific values for protocol fields present in the predicateP
includes traffic characteristics in f(P
)and rule properties in the rule set as:(1−f(
P
))×∑
R=rule with valueP
bR (2.1)
predicate
P
. Then, the problem of an effective hierarchical structure is to determine the set of groups such that they maximize the benefit measured by improvement in run time for a given total cost, measured by the total amount of memory that is available. Formally, the objective is to determinemandmdistinct predicates
P
1,P
2, . . . ,P
mthat maximizes m∑
i=1
[(1−f(
P
i))×∑
R=rule with valuePi
bR] (2.2)
with the cost constraint
m
∑
i=1
c(
Pi
)≤maximum memory (2.3)The problem is similar to minimizing the number of leaf nodes in a decision tree [31]. However, decision tree problem assumes that there is no ambiguity in element classification and that there is no overlap between the groups. In our problem, a rule can be possibly placed in multiple groups and the objective is to identify the set of groups that maximizes the benefit function.
2.2.3 Our Approach
In this section, we design an algorithm that captures the properties of input rules and traffic characteristics to produce an effective set of rule groups, separated by values of protocol fields. These groups are then arranged in a hierarchical evaluation structure, which determines the order in which protocol fields are evaluated on an incoming packet. We begin with some assumptions that simplify the above mathematical model for a realistic treatment and then present our algorithm.
2.2.3.1 Assumptions
It is not easy to precisely determine the cost of creating a data structure for matching multiple patterns and the absolute benefit achieved by rejecting a rule. For some exact substring-match algo-rithms (like Aho-Corasick), the memory space occupied by the data structure may not grow linearly with the number of patterns. For hash-based algorithms, the memory consumed is independent of the number of patterns. This makes estimating cost for a multi-pattern-matching algorithm difficult. At the same time, for most algorithms that perform multi-pattern matching, it is hard to estimate the benefit of excluding a single pattern. Therefore, we will make two simplifying assumptions that allows us to easily compute the cost and benefit:
1. The cost of creating a multi-pattern data structure for any group of patterns is constant. This assumption is valid for hash-based matching algorithms, like Wu-Manber, that allocate fixed hash space. However, this assumption is incorrect for the Aho-Corasick algorithm in which the required space may increase with the increase in the number of patterns.
2. The benefit of rejecting any rule is a one-unit improvement in run time (i.e.,bR=1) except for rules that have content of maximum length one. The rules that have content length one significantly degrade multi-pattern matching and should be separated if possible. Therefore, rules with a content length of one are assigned a large benefit (mathematically infinity). It is possible that other patterns may adversely impact the performance in multi-pattern search, but we choose to ignore such interactions for simplicity.
It is important to note that our assumptions help us to easily estimate the cost and benefit of creating a group, and more accurate estimates will only improve our scheme.
2.2.3.2 The Algorithm
Instead of specifying a fixed memory cost and then maximizing the benefit, we specify the trade-off between the cost and the benefit. We say that any specific value of a protocol field that rejects at least a minimum THRESHOLD number of rules should be assigned a separate group and hence, memory space. This specification allows us to more easily tune real-time performance.
The mathematical model allows us to compare two groups with specific values for a number of protocol fields. The problem is then to determine a set of groups in which each group rejects at least a THRESHOLD number of rules and the set maximizes the overall benefit. However, this may require generating all possible sets, which is computationally infeasible. Therefore, we do not attempt to produce an optimal set of groups, but instead to discover possible groups heuristically. The main intuition behind our algorithm is to place all rules in a bin and iteratively split that bin by the protocol field that produces the maximum benefit, and at each split separate values of the chosen protocol field that reject at least a THRESHOLD number of rules on average.
We now explain our algorithm in detail. First, all rules are placed in a bin. Then, a few packets are read from the network and protocol fields in each rule are evaluated. Then, the benefit obtained by a value in a protocol field is computed using the benefit Equation 2.1. For valuevijof the protocol
fieldFi, f(
P
)reduces to f(Fi=vij)and∑R=rule with valuePbRreduces toSFi=vij whereSP indicatesthe number of rules with protocol field values specified by the predicate
P
. This simplification is possible becausebRis one. The overall benefit of a protocol field is the sum of benefit of all values, and the protocol field is chosen that produces maximum benefit. Then groups are formed for each specific value in the protocol field that rejects at least THRESHOLD number of rules, or has a rule with content length one. Then, we partition the bin into those specific values and recursively compute other protocol fields for each of these bins. We stop splitting a bin if none of the protocol fields can reject at least THRESHOLD number of rules.When we partition a bin into specific values, we replicate a rule that may match multiple of these specific values in all those bins. For example, if the rules are divided by destination port, then a rule that matches‘any’destination port is included in all of those bins. This ensures that when a set of rules with a specific value for a protocol field are picked, other applicable rules are also matched with the packet. This is essential for correctness. Generally a rule with valuevjfor a protocol field is included in a rule set with specific valuevi ifvj∩vi6=0. If there is an order in which the values are checked during run-time, then a rulevj is included invi only if it appears before it, and if it satisfies the previous property.
Packets rejected by a protocol field may correlate with packets rejected by another protocol field, and so computing protocol fields independently may give misleading information. For example, a source port and a source IP address may reject exactly the same packets, in which case we do not gain anything by checking both of them. Our recursive splitting of a bin removes this problem of correlated values. This is because for a bin, we evaluate the benefit of remaining protocol fields only on those packets that match the values specified in the bin. For example, to split a bin containing port-80 rules, we only evaluate the remaining protocol fields on packets that have port 80. This ensures that the remaining protocol fields reject only the rules that were not rejected by port 80.
By choosing the protocol field that produces maximum benefit for each bin, we get an order in which the protocol field is checked for a packet. By choosing values that produce benefit above a threshold, we get the values that determines which groups should be maintained.
2.2.3.3 Implementation
We implemented two distinct components to develop a workload-aware Intrusion Detection System. The first component profiles the workload (i.e., the input rules and the live traffic) to generate the evaluation tree. The second component takes the evaluation tree, pre-processes the rules, and matches any incoming packet on the tree. These components are general enough to be applied to any IDS. We implemented our algorithm that generates an evaluation tree for a given workload over Snort 2.1.3. We chose Snort as it already provides an interface to read the rules into proper data structures. It also provides an interface to read the incoming traffic and check for different protocol fields.
As a second component, we modified Snort 2.1.3 to take the bin profiles and construct a hier-archical evaluation plan. Snort 2.0 [56] introduced an interface for parallel evaluation of rules on a packet. Our hierarchical evaluation tree provides the set of applicable rules for a packet according to its values for different protocol fields. We pre-computed the data structure required for parallel matching for each of these groups. For every packet, we used our evaluation tree to determine the set of applicable rules and allowed Snort to perform the evaluation. We implemented three protocol fields by which the hierarchical structure can be constructed, namely: destination port, source port, destination IP address, and whether the packet is from the client. Since rules contain a large number of distinct protocol fields and we want to immediately detect the applicable rules, we implemented a check for destination port using an array of 65,536 pointers. Source port and destination IP address was checked by looking for possible match in a linked list. We did this because only a few des-tination IP addresses/source ports have to be checked, and because maintaining a pointer for each specific value consumes significant memory. For client checks the rules were divided into two parts: those that required to check if the packet is coming from client, and the rest were others. Every time a bin was split, we ensured that a rule was included in all new bins whose specific value can match the value in the rule. This ensured the correctness of our approach. We also validated our system by matching the number of alerts that our system raises, when compared to the number of alerts raised by unmodified Snort on a large number of datasets.
2.3
Evaluation
In this section, we evaluate Wind on a number of publicly-available datasets and on traffic from a border router at a large academic network. On these datasets, we compared real-time performance of Wind with existing IDSs using two important metrics: the number of packets processed per second and the amount of memory consumed. To measure the number of packets processed per second, we compiled our system and the unmodified Snort with gprof [39] options and then evaluated the dataset with each one of them. Then we generated the call graph, using gprof, and examined the overall time taken in theDetectfunction, which is the starting point of rule application in Snort. Finally, using the time spent inDetectand the number of times it was called, we computed the number of packets processed per second. To compute the memory used, we measured the maximum virtual memory consumed during the process execution by polling each second the process status and capturing the virtual memory size of the process. We now describe the datasets and the computing systems that we used for our experiments.
2.3.1 Datasets and Computing Systems
We evaluated the performance of our system on a number of publicly-available datasets and on traffic from a large academic network. For publicly available datasets, we used traces that DARPA and MIT Lincoln Laboratory have used for testing and evaluating IDSs. We used two-week testing traces from 1998 [47], and two-week testing traces from 1999 [50]. This gave us 20 di
![Figure 1.1: (a) Packet rate as seen by each sensor normalized by /24 (from [24].) (b) The number of darknets (of 31) reporting a port in the top 10 ports over a day, week, and month time frame (from [17].)](https://thumb-us.123doks.com/thumbv2/123dok_us/788137.2599643/16.918.324.650.270.781/figure-packet-sensor-normalized-number-darknets-reporting-ports.webp)
![Table 1.1: Comparing the vulnerable population in four networks, by operating systems and TCP ports(from [72])](https://thumb-us.123doks.com/thumbv2/123dok_us/788137.2599643/18.918.177.805.106.421/table-comparing-vulnerable-population-networks-operating-systems-ports.webp)