An Effective Computational Approach to the Parametric Study
of the Cathode Catalyst Layer of PEM Fuel Cells
S. Ahadian
1;2;*, N. Khajeh-Hosseini-Dalasm
3, K. Fushinobu
3, K. Okazaki
3and Y. Kawazoe
11Institute for Materials Research (IMR), Tohoku University, Sendai 980-8577, Japan 2WPI-Advanced Institute for Materials Research, Tohoku University, Sendai 980-8577, Japan
3Department of Mechanical and Control Engineering, Tokyo Institute of Technology, Tokyo 152-8552, Japan
We propose an integrated modeling, prediction, and analysis framework for the parametric study of the cathode catalyst layer (CCL) of PEM fuel cells. A parametric study is performed on a macro-homogeneous film model of the CCL. An artificial neural network (ANN) is then used in order to model and predict the effect of various structural parameters on the activation overpotential of the CCL. The application of the ANN approach is an asset to deal with the complexity of this problem and leads to considerably save the computational time and cost and to remove undesired computational errors. The proposed computational approach shows that an increase in the platinum mass loading causes a decrease in the activation overpotential or equivalently an increase in the CCL performance. The main effects of increasing the carbon mass loading, gas diffusion layer (GDL) volume fraction in the CCL, and CCL thickness are that the activation overpotential is going up. GDL porosity has almost no effect on the CCL performance while the CCL performance has a quadratic behavior with respect to the membrane volume fraction in the CCL. Further investigation is done in order to quantify these effects as well as the combined effects of these parameters.
[doi:10.2320/matertrans.M2011101]
(Received April 5, 2011; Accepted July 15, 2011; Published September 25, 2011)
Keywords: polymer electrolyte membrane (PEM) fuel cells, cathode catalyst layer, macro-homogeneous film model, parametric study, artificial neural network, statistical methods
1. Introduction
Since past two decades, a lot of research and development activities have been done to commercialize the PEM fuel cell as a potential power source for portable electronic devices, automotive systems, and power plant applications. Compared with the conventional battery systems, the advantages of PEM fuel cells are high operating efficiency, near-zero greenhouse emissions, use of renewable fuels, reliable operation, and nearly instantaneous rechargeable capabili-ties. However, several design and operation-related problems need to be solved before the commercialization of such systems. These issues can be addressed through an optimi-zation problem for a PEM fuel cell with the aim of maximizing its power density and minimizing its cost for a given durability. Solving this problem requires repeated experiments, which could be expensive and time consuming since there are numerous parameters in the system. With a plethora of parameters to be optimized and conditions to be satisfied, theoretical modeling of PEM fuel cells plays a pivotal role in achieving the ideal conditions of such systems. More specifically, numerical modeling and optimization of the catalyst layers of PEM fuel cells remain one of the most challenging problems in PEM fuel cells research due to the complex coupling of transport and reaction of chemical species (i.e., hydrogen, oxygen, and water) and charged particles (i.e., electrons and ions) occurring in the complex composite porous structure. Because of the complexities of modeling such layers, several macroscopic catalyst layer models have emerged in the literature in the last decade with varying degrees of resolution and detailed representation or parameterization of the complex physico-electro-chemical
processes.1) Such models can generally be categorized as
follows: Interface models, pseudo-homogeneous film models (Also known as macro-homogeneous film models), and agglomerate models. A detailed information regarding these models can be found in the review article written by Weber
and Newman.2)
To our knowledge, most of catalyst layer models are limited to study the effects of a few parameters on the catalyst layer performance and in principle are valid for a narrow range of operation conditions. A good example has been shown in our previous work in which only structural effects of the cathode catalyst layer (CCL) on the performance of a
PEM fuel cell was investigated.3) As a consequence, the
obtained results using these models lead to a uncertainty in model predictions for real PEM fuel cell applications. The reason for such limitation in modeling catalyst layers of PEM fuel cells is that the rigorous catalyst layer models are multidimensional and complicated due to multiphysical phenomena occurring in these layers. In this paper, an effective computational approach is suggested to deal with the complexity of these models. The proposed approach is based on the artificial neural network (ANN) along with the statistical methods.
As inspired by the performance of the brain and nervous systems in biological organisms, an ANN mimics the structure of such systems by distributing computations to small and simple processing units, called artificial neurons, which are interconnected to form an artificial network. ANNs have been highly competent approximators of com-plex functions and have shown advantages over general linear models in predictive ability.4,5)Statistical methods and in particular the analysis of means (ANOM) and analysis of variance (ANOVA) methods can help to interpret the predicted data set by a well-designed ANN. ANOM and ANOVA tests are based on the principle of linear
super-*Corresponding author, E-mail: [email protected], samad ahadian@ yahoo.com
position. The ANOM procedure calculates the main effect of each independent parameter on the objective function (Here, the CCL performance). The ANOVA method quantifies this effect and also calculates the values of interaction effects.
Generally, the so-called term interaction implies that the
effect produced by changing one independent parameter on the objective function depends on the level of other independent variable(s). Further information regarding the mathematical treatment of these methods can be found in our
previous work.6) Our proposed computational approach is
employed for modeling, predicting, and analyzing the CCL performance as modeled by a pseudo-homogeneous film technique. We especially focus on the parametric study of a variety of influencing structural parameters on the activation overpotential of the CCL. The activation overpotential at a given current density is in principle at its minimum point for an ideal CCL.
The remainder of this paper is organized into the following sections: Computational details involving the CCL model and ANN design, results and discussion, and finally con-clusions.
2. Computational Details
2.1 CCL model
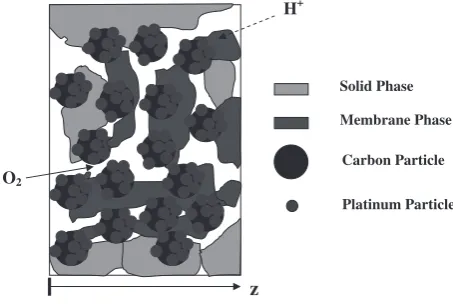
Here, a pseudo-homogeneous film approach is used to model transport phenomena in the CCL of a PEM fuel cell within a medium range of current densities. The schematic diagram of the CCL model is shown in Fig. 1. As can be seen, the CCL model includes four different parts: Catalyst phase consisting of the platinum and carbon particles, membrane phase, solid gas diffusion layer (GDL) phase, and finally void spaces. Hydrogen molecules are split into the electrons and protons at the anode catalyst layer of the PEM fuel cell. The electrons are conducted through an external circuit and solid GDL phase toward the CCL, while the protons go through the membrane phase to reach the CCL. Oxygen molecules diffuse through void spaces in the GDL and/or through the membrane phase to reach the CCL. All these reacting species (i.e., electrons, protons, and oxygen molecules) react on the catalyst particles as follows:
O2þ4Hþþ4e!2H2OþHeat ð1Þ
In order to derive the governing equations for the CCL model, the following assumptions are considered:
(1) The described model is one-dimensional. (2) The system is as steady state conditions.
(3) As can be observed in Fig. 1, the GDL and membrane phases can penetrate into the CCL.
(4) Temperature and pressure are constant.
(5) Void spaces are fully flooded by the liquid water. The governing equations for this case study are detailed below.
The transport of oxygen molecules within the CCL model is described according to the Fick law of diffusion as follows:
dCO2
dz ¼ iI
4FDeff O2
ð2Þ
whereCO2is the oxygen concentration,zis the dimension of
the system,iis the protonic current density,Istands for the
cell current density, F is the Faraday constant (F¼
96;485Coulombs mol1), and Deff
o2 is the effective oxygen
diffusion coefficient. Note that since the void spaces are considered to be thoroughly occupied by water, the Fick’s law of diffusion governs the oxygen diffusion through this medium.
The electrochemical reaction rate is calculated using the
Butler-Volmer equation as follows:7)
di
dz¼ai0 exp cF
RT act
exp aF
RT act
ð3Þ
whereais the specific area that takes into consideration the
roughness of the reaction sites, i0 is the exchange current
density as determined experimentally for smooth surface
reaction sites, c and a denote the cathodic and anodic
transfer coefficients, respectively, R is the universal gas
constant (R¼8:314J K1mol1),T is the temperature, and act is the activation overpotential.
The activation overpotential within the CCL due to ohmic losses of protonic resistance in the membrane phase and electrical resistance in the solid GDL phase is formulated as follows:8)
dact
dz ¼ i
effþ iI
eff ð4Þ
whereeffis the effective protonic conductivity andeffis the effective electronic conductivity.
The above equations (i.e., eqs. (2) to (4)) are extended to relate the CCL performance as measured by the activation
overpotential (act) to the structural parameters of the CCL,
namely, platinum and carbon mass loadings (i.e.,mptandmc,
respectively), membrane and GDL volume fractions in the CCL (i.e.,Lm,candLg,c, respectively), GDL porosity ("g), and
CCL thickness (lc) as reported in the previous work.9)The
resulting equations are solved using the shooting algorithm
as implemented in the MATLAB software package.10) We
should say that all underlying structural parameters (i.e.,mpt,
mc,Lm,c,Lg,c,"g, andlc) change at three levels as reported in
Table 1. Therefore, the total number of equations would be 729. The boundary and base set conditions to solve the
equations are also given in our previous work.9)It is worthy
to note that a good agreement between the CCL model
presented here with the experimental observations11)as well
z
Solid Phase
Membrane Phase
Carbon Particle
Platinum Particle O2
H+
[image:2.595.312.539.75.227.2]as the computational fluid dynamics simulations12)in terms
of polarization curves (i.e., voltage versus current) has been achieved.9)
2.2 ANN design
In this investigation, we employ a feed-forward neural network trained by the back-propagation algorithm having
one hidden layer13)since it has been proven that such neural
networks with sigmoid transfer functions in the hidden layer and linear ones in the output layer are universal
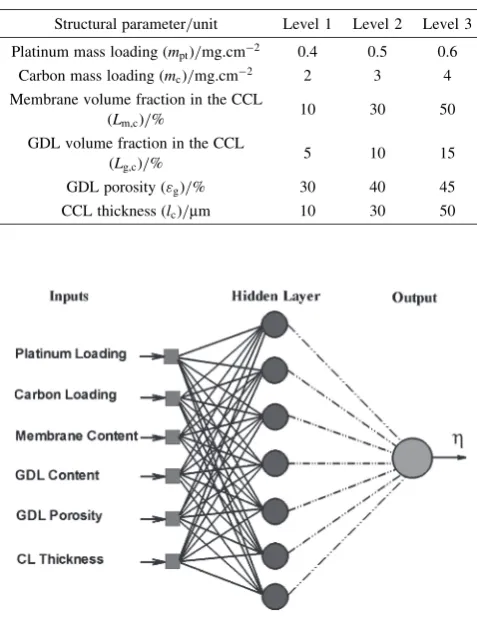
approxima-tors for any analytic functions.14) The input layer of the
network includes mpt, mc, Lm,c, Lg,c, "g, and lc, while the
output layer of the network is set to produceact. Figure 2
illustrates the schematic diagram of such a network. The next step is determination of the architecture of the network, namely, optimum number of neurons in the hidden layer and the transfer function of this layer being as detailed below.
All computed data points using the numerical simulations, are divided into two groups: a training data set and a test data set, following a10 : 1ratio. The total number of data points is 729. A linear transfer function is used in the output layer of network, which produces the activation overpotential. The output of a linear transfer function is equal to its input. The root mean squared error (RMSE) is used in order to assess the accuracy of the actual output in comparison with the one predicted by the trained network. Indeed, this statistical parameter (i.e., RMSE) does measure the correlation between
the target values (i.e., the activation overpotential values resulting from the numerical simulations) and the corre-sponding values predicted by the trained network. Imagine that a data set has valuesyieach of which has a corresponding
value fi. Here, the valuesyi are called the observed values
and the values fi denote the predicted values. RMSE is
defined as follows:
RMSE¼
ffiffiffiffiffiffiffiffiffiffiffiffiffiffiffiffiffiffiffiffiffiffiffiffiffiffi Xm
i
ðyifiÞ2
m v u u u t
ð5Þ
wheremis the number of the observed or predicted values.
Note that for a perfect correlation, RMSE should be 0. Several neural networks are created, trained, and tested. Finally, an ANN with 9 neurons in its hidden layer having a log-sigmoid transfer function in this layer is found to have the minimum RMSE value (i.e., RMSE less than 0.001 V for the test data set). The log-sigmoid transfer function has the general form:
fðnÞ ¼ 1
1þexpðnÞ ð6Þ
wherenis the input of the function.
3. Results and Discussion
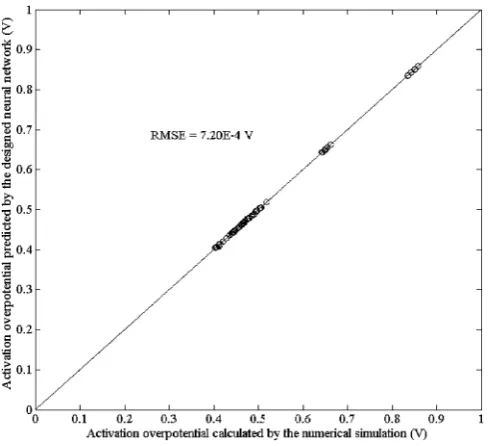
Figure 3 shows a comparison between the activation overpotentials predicted by the ANN method and the corresponding activation overpotentials computed by the numerical simulation for the test data set. For a perfect correlation, all data points should fall on the 45 degrees line
shown in this Figure. The average RMSE is 7:20104V
for the test data set indicating that the proposed ANN has superior performance in modeling and predicting the activa-tion overpotential as a funcactiva-tion ofmpt,mc,Lm,c,Lg,c,"g, and
lc, which have been derived by the numerical simulations.
Our well-designed ANN is able to learn and therefore generalize. This means that it can provide essentially exact results for unseen data points. This property comes from this fact that our designed ANN performs very well against the test data set, which are not encountered with the ANN during the training procedure. The generalization ability of the designed ANN in this work is used to obtain new data points, which are not reported by the numerical simulations. In particular, we increase the number of levels forLm,candlcto
[image:3.595.48.287.90.402.2]five. The new levels for these parameters vary between 10 to 50 with the increment 10. Therefore, the total number of new data points would be 1296. Note that the activation overpotential for 729 of 1296 data points has already been calculated by the numerical simulation. The current numer-ical calculations are time consuming compared to the predictions by the designed ANN. The time required for a numerical simulation to produce the output values (i.e., activation overpotentials) is 10 min. on a PC with a clock speed of 2.93 GHz. However, the time needed for the designed ANN is less than 2 min. on the same PC. As a result, the use of the ANN approach leads to a significant reduction of the computational time and consequently cost. The massively parallel-distributed structure of the neural networks leads to this fact that a designed ANN can process a
Table 1 Structural parameters of the cathode catalyst layer influencing the PEM fuel cell performance and their corresponding values.
Structural parameter/unit Level 1 Level 2 Level 3 Platinum mass loading (mpt)/mg.cm2 0.4 0.5 0.6
Carbon mass loading (mc)/mg.cm2 2 3 4
Membrane volume fraction in the CCL
(Lm,c)/% 10 30 50
GDL volume fraction in the CCL
(Lg,c)/% 5 10 15
GDL porosity ("g)/% 30 40 45 CCL thickness (lc)/mm 10 30 50
piece of information at very high speed. Each neuron in the ANN is a processing element similar to a Boolean logical unit in a conventional computer chip, except that a neuron function is programmable. Computations tasks in the ANNs are mainly matrix ones, and the parallel structure of the interconnection between neurons facilitates such calcula-tions. This characteristic has been inspired by the perform-ance of a biological neuron in response to an external stimulus. In addition, a well-designed ANN can tolerate a considerable large amount of the statistical errors, which can be existed in the numerical simulations and/or experimental values since it is able to extract general rules for a given problem. Such a property of the neural networks would be an asset since we always encounter such errors either in the numerical simulations due to some unrealistic assumptions or in the experiments since the reproducibility of the reported experimental values is not always very good. However, the ANN models do not provide us any analytical basis for the underlying problems labeling them as the black box. In order to circumvent this difficulty, statistical methods (i.e., ANOM and ANOVA approaches) are employed. The obtained results are illustrated in Table 2 and Fig. 4 and discussed below.
An increase inmpthas two competing effects as to increase
the accessible reaction surface area for the oxygen reduction
and to decrease the porosity and therefore lowerDeff
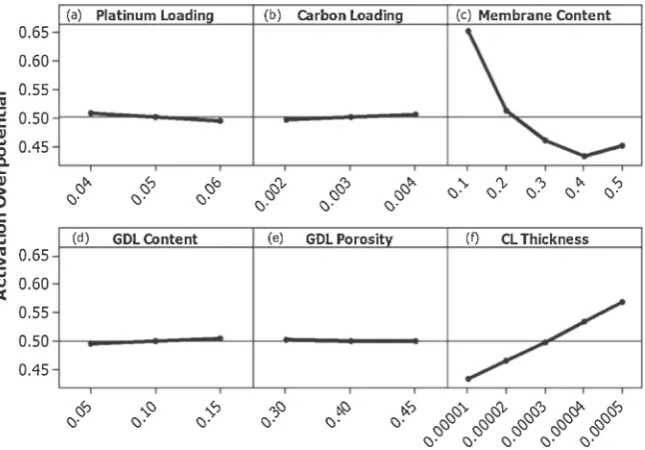
o2. The last effect tends to increase the activation overpotential, while the former one decreases the activation overpotential. The net result is a decrease in the activation overpotential as we add up the platinum mass loading as shown in Fig. 4(a).
The main effect of increasingmcis to reduce the porosity
and consequently lower Deffo
2. This change leads to a higher
activation overpotential (See Fig. 4(b)). Lm,c has more
influence on the activation overpotential compared to Lg,c.
Indeed, this parameter has two opposing effects on the oxygen reduction reaction occurring in the CCL as to decreaseDeff
o2 for the oxygen molecules and to increase the
effective protonic conductivity (i.e., eff). However, as we
increase the amount of this parameter, the activation over-potential decreases following a slight increase in the activation overpotential (See Fig. 4(c)).
As a matter of fact, there is no penetration of the GDL into the CCL during the membrane electrode assembly process. However, after the PEM fuel cell is assembled and being employed, the GDL penetrates into the CCL due to a compressive load. As can be observed in Fig. 4(d), the outcome of such penetration is an increase in the activation overpotential since this parameter restricts the CCL porosity and as a result the activation overpotential increases. From Fig. 4(e), it is obvious that the activation overpotential is almost insensitive to the changes in"g. An increase inlcleads
to a significant drop in the CCL performance since as we increase this parameter, the diffusion length of oxygen molecules gets longer (Fig. 4(f)).
Now, let us analyze the complete data set provided by the designed ANN with the aid of ANOVA method. F parameter in the ANOVA table (i.e., Table 2) is called the variance ratio, which is simply defined as the ratio of the mean square of each independent variable to the mean square of error. Note that a value of F less than one in Table 2 indicates that the effect of the corresponding given independent variable is smaller than the error associated with the linear superposition approximation and therefore can be ignored. On the other hand, a value of F above four generally suggests that the effect of the independent variable is quite significant. As can be seen, the highest F value belongs to the membrane volume fraction in the CCL among the underlying independent variables (i.e.,mpt,mc,Lm,c,Lg,c,"g, andlc). Therefore, it can
[image:4.595.47.293.70.293.2]be concluded that the membrane volume fraction in the CCL is the parameter having the greatest impact on the activation
Table 2 Analysis of variance (ANOVA) for the activation overpotential as the objective function.
Source Degrees of freedom
Sum of squares
Mean square F Platinum mass loading
(mpt) 2 0.05869 0.02934 13.16 Carbon mass loading (mc) 2 0.02922 0.01461 6.55 Membrane volume fraction
in the CCL (Lm,c) 4 12.95824 3.23956 1452.63 GDL volume fraction in the
CCL (Lg,c) 2 0.02168 0.01084 4.86 GDL porosity ("g) 2 0.00123 0.00062 0.28 CCL thickness (lc) 4 4.7595 1.18988 533.54
Platinum mass loadingcarbon mass
loading
4 0.0002 0.00005 0.02
Membrane volume fraction in the CCLGDL volume
fraction in the CCL
8 0.01302 0.00163 0.73
GDL porosityCCL
thickness 8 0.00001 0 0
Error 1988 4.43352 0.00223
Total 2024 22.27532
Indicates the interaction. For instance, platinum mass loadingcarbon mass loading means the platinum mass loadingcarbon mass loading interaction parameter.
[image:4.595.305.548.93.332.2]overpotential. Based on this methodology, it is feasible to rank the effectiveness of all independent variables as follows: (1) Lm,c, (2) lc, (3) mpt, (4) mc, (5) Lg,c, and finally (6) "g.
Notice that the effect of"gon the activation overpotential is
not significant since this parameter provides the F value less than 1. This finding is valid for all combined parameters as well. The significance level in the ANOVA analysis is 95% implying that the obtained results are correct with a probability larger than 0.95.
The performance of a PEM fuel cell is a function of many parameters such as temperature, pressure, CCL structure and so on. In order to design new PEM fuel cells and to improve the existing PEM fuel cells, it is essential to understand these parametric effects on the performance of the PEM fuel cells. Even though, various systematic experimental and
computa-tional studies in this area have been done,15–18) there are
limited to evaluate the effects of a few variables on the PEM fuel cell performance. In addition, under some circum-stances, there is impossible to attain the required data set to assess the PEM fuel cell performance due to either the extreme difficulty in doing the corresponding experiments or the lack of solution for the corresponding computational models. Therefore, there is a need to propose an effective computational approach to model such relatively large data sets obtained by the parametric studies and to predict those data points, which are not provided by either experiments or numerical simulations. The proposed computational ap-proach here (i.e., the ANN apap-proach combined with the statistical methods) provides this invaluable tool for PEM fuel cell developers and helps them to accelerate and better optimize their specific fuel cell designs.
4. Conclusions
Numerical simulations are performed in order to achieve
a structural parametric study of the CCL of PEM fuel cells. The ANN approach along with statistical methods are then used to model and analyze the numerically obtained data set. The ANN method has high accuracy in mimicking the results of such simulations. The goal of this inves-tigation is to understand the effects of platinum mass loading, carbon mass loading, GDL volume fraction in the CCL, CCL thickness, GDL porosity, and membrane volume fraction in the CCL. We found that an increase in the platinum mass loading causes a decrease in the activation overpotential. The main effects of increasing the carbon mass loading, GDL volume fraction in the CCL, and CCL thickness are that they increase the activation overpotential. GDL porosity has almost no effect on the CCL performance while the CCL performance has a quadratic behavior with respect to the membrane volume fraction in the CCL.
The ANOVA method shows Lm,c and lc influence the
activation overpotential more than all other parameters. In addition, it is revealed that the combined effects of these parameters (i.e., platinum mass loading/carbon mass loading, membrane volume fraction in the CCL/GDL volume fraction in the CCL, and GDL porosity/CCL thick-ness interaction parameters) on the CCL performance are negligible.
Acknowledgements
The authors sincerely appreciate the staff of the Center for Computational Materials Science of the Institute for Materi-als Research (IMR), Tohoku University, for its continuous support of the supercomputing facilities. This work was supported (in part) by the Japan Society for the Promotion of Science (JSPS), Energy-GCOE program of Tokyo Institute of Technology, and the Grant-in-Aid for Scientific Research from MEXT/JSPS.
Fig. 4 Main effects of platinum mass loading (mpt), carbon mass loading (mc), membrane volume fraction in the CCL (Lm,c), GDL volume
[image:5.595.138.461.72.297.2]REFERENCES
1) M. Secanell, K. Karan, A. Suleman and N. Djilali: Electrochim. Acta
52(2007) 6318–6337.
2) A. Z. Weber and J. Newman: Chem. Rev.104(2004) 4679–4726. 3) H. Matsuda, A. Ohma, K. Fushinobu and K. Okazaki: Proc. ASME/
JSME 8th Thermal Engineering Joint Conference 13th–17th March 2011, Honolulu, Hawaii in press.
4) S. Ahadian, H. Mizuseki and Y. Kawazoe: J. Chem. Phys.131(2009) 184506.
5) S. Ahadian, A. Ranjbar, H. Mizuseki and Y. Kawazoe: Int. J. Hydrogen Energy35(2010) 3648–3655.
6) S. Ahadian, H. Mizuseki and Y. Kawazoe: Microfluid. Nanofluid.9
(2010) 319–328.
7) F. Barbir: PEM fuel cells, Theory and practice, San Diego, (Elsevier Academic Press, 2005).
8) C. Marr and X. Li: J. Power Sources77(1999) 17–27.
9) N. Khajeh-Hosseini-Dalasm, M. J. Kermani, D. Ghadiri Moghaddam and J. M. Stockie: Int. J. Hydrogen Energy35(2010) 2417–2427. 10) MATLAB software package, The MathWorks Inc., (2004).
11) E. A. Ticianelli, C. R. Derouin, A. Redondo and S. Sirinivasan: J. Electrochem. Soc.135(1988) 2209–2214.
12) M. Khakbaz Baboli and M. J. Kermani: Electrochim. Acta53(2008) 7644–7654.
13) D. E. Rumelhart, G. E. Hinton and R. J. Williams: Nature323(1986) 533–536.
14) K. Hornik, M. Stinchcombe and H. White: Neural Networks2(1989) 359–366.
15) M. Srinivasarao, D. Bhattacharyya and R. Rengaswamy: J. Power Sources195(2010) 6782–6794.
16) L. Wang, A. Husar, T. Zhou and H. Liu: Int. J. Hydrogen Energy28
(2003) 1263–1272.
17) E. F. Medici and J. S. Allen: J. Electrochem. Soc.157(2010) B1505– B1514.