Abstract— Aquatic systems of Thiruvananthapuram receiving waste water from various anthropogenic activities. The study reveals that the chemical and heavy metal concentration of almost all station selected from the present study area was high. The present investigation mainly concentrates on the physical and chemical properties of the sediments like pH, Conductivity, Organic carbon, nutrients and heavy metals. Moreover other anthropogenic activities affect the soil texture of these aquatic systems.
Index Terms— Nutrients, Heavy metals, Pollutants, trace metals, Aquatic system.
I. INTRODUCTION
Sedimentation is an important natural process that operates through a chain of actions that involve erosion, transportation and finally deposition sediments consists of soil and minerals particles washed by storms/flood water from crop lands, barren land and over grazed pastures (Sharma and Kaur, 1997). The sediments are both carriers and potential sources of natural geochemical constituents derived principally from rock weathering. The sediments mostly govern the nutrient economy of an aquatic system and knowledge on the role of sediment nutrient is especially useful in determining the sediments- water interaction, which eventually affects the productivity (Balakrishnan et al
(1984). The sediment acts as a sink for they play a vital role in changing the quality of the overlying water column. The geochemical characteristics of aquatic sediments in different parts of the world have been worked out in detail (Jitts, 1959; Aston and Hewitt, 1977). The fate of heavy metals in estuaries has been extensively studied by Bloom and Ayling (1977). Sedimentological studies have been conducted in velar estuary (Chandran et al., 1982).
The sediment texture and organic matter of Vembanad Lake and near shore sediments has been done (Murthy and Veerayya, 1972; Seralathan and Padamala, 1994). The present study mainly deals with the variation of texture, pH, conductivity, total nitrogen, total phosphorous, organic carbon, sodium, potassium and some heavy metals.
Manuscript received February 9; 2009.This work was supported in part by the Department of Environmental Sciences, University of Kerala, Trivandrum, Kerala, India).
Prof (Dr). Sobha, Head, Dept.of Environmental Sciences University of Kerala, Thiruvananthapuram-695 581 now Registrar, University of Kerala, Thiruvananthapuram-695 034, Kerala, India (corresponding author to provide phone: 04712473866, [email protected]).
P.R Abhilash, Research Scholar, Dept. of Environmental Sciences, University of Kerala,
Dr. S.Santhosh, Technical Assistant, Dept. of Environmental Science, University of Kerala,
Hashim K.A, Research Scholar, Dept. of Aquatic Biology & Fisheries, University of Kerala and E. Valsalakumar, Sl. Grade Lecturer, Dept. of Botany, Christian College, Kattakada
The texture of sediment is one of the important physical parameters of an aquatic environment, which influence the physico chemical and biological characteristics of the system (Hakanson and Janson, 1983). The textural characteristic of sediments plays a significant role in the distribution and concentration of carbon, nitrogen and phosphorous, both in the bottom sediments and in the overlying water column.
II. MATERIAL AND METHODS
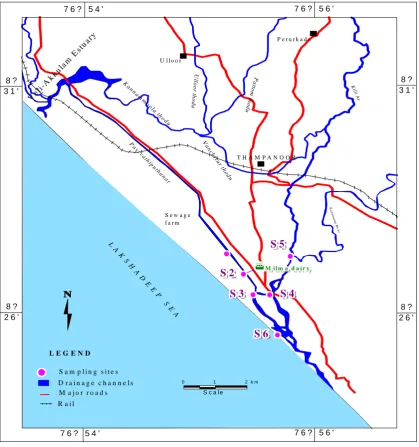
The sediment samples were collected from the six stations within the study area (Fig.1) during Nov. 2003 (Post monsoon) and March 2004 (Premonsoon) using a Van Veen Grab. A representative portion of the sample was scooped into polythene bags and preserved till analysis. A part of the air-dry samples are used for textural analysis by the pipette analysis methods suggested by Lewis (1984). The organic carbon of the sediment samples was analysed by an oxidation method as adopted by EI Wakeel and Veerayya (1957). Total phosphorous content of sediment sample was measured by the modified method of Murphy and Riley (1962) and total nitrogen is measured by Kjeldahl method described by Barnes (1959). The major ions like Na, K, Li and Ca were determined using the flame photometer based on the procedure described in APHA (1995). Heavy metals such as Fe, Cu, Zn, Pb, Cr, Li, Cd and Mg were determined using a double beam Atomic absorption Spectrophotometer following the method of Rantala and Loring (1975).
III.RESULTS AND DISCUSSION
The percentage of various size classes, concentrations of nutrients and heavy metals of sediments from the six different stations are given in table 1 and 2 .The percentage of sand fraction varied considerably for different station. The sand fraction varied from 9.58 (S1) to 92.89% (S1) during post monsoon and 8.16 (S1) to 90.83 %( S6) during premonsoon season. The maximum value of 92.89% was reported in station 6 (Post monsoon) and minimum of 8.16 was noticed in station 2 (Premonsoon). The season-wise analysis shows that maximum sand deposition was noticed at station S6 during post monsoon and minimum during Premonsoon season. Considerable variation in the silt percentage was also noticed. It varied from 5.61 (S1) to 57.71 %( S2)) during post monsoon and 7.63 to 55.70 % (S2) during the Premonsoon season. The highest value of 57.71% was reported at station S2 (Post monsoon) and lowest of 5.61% was noticed at station S6 (Post monsoon). The results show that station S2 is silty in nature. This may due to the settling of the particles from the overlying water. The allochthonous material reaching from Milma dairy was
Geochemistry of Different Aquatic Systems in
Thiruvananthapuram, Southern Kerala
subjected to bio degradation, which results in the high percentage of silt apart from the death and decaying of vegetation (Prasanthan, 1999). The clay content of present investigation also shows wide fluctuations. The value ranged from 1.5 (S6) to 47.5 % (S1) during the post monsoon and 1.54 (S6) to 51.81 5% (S1) during Premonsoon. The maximum clay content of 51.81 % was found at station S1 (Premonsoon) and least value of 1.5 % at station S6 (Post monsoon). The high content of Clay indicates the comparatively low energy conditions prevailing at the station S1. Besides this stations, selected from Parvathy Puthen Ar receive maximum amount of organic and domestic waste from the city. This will also facilitate the high content of clay. The transport of sediment occurs across the sediment-water interface both upwards and downwards affecting the quality and composition of water.
The result of the various geochemical parameters and heavy metals analysed in the sediment are furnished in Table 2. Hydrogen ion concentration of the aquatic sediment varies considerably. It ranged from 4.61 (S4)-9.23 (S5) during the post monsoon and 5. 63 (S6) to 8.13 (S4) during the Premonsoon. The maximum pH of 9.23 (Alkaline) and the lowest of 4.62 (Acidic) were reported at station S5 and Station S4 respectively during the post monsoon season. The major factors governing the pH of the soil include the concentration of reduced iron, manganese, hydroxides, Carbonates, carbonic acid, and humic acid (Patric and Mikkelson, 1971). The acidic pH reported at stations S4 may due to the substantial quantity of urban waste discharged into the water. Conductivity values ranged from 0.106 (S4) to 0.592 ms/cm (S5) during post monsoon and 0.094 (S4) to 0.831 ms/cm (S3) during Premonsoon. The highest value of 0.831 ms/cm was obtained at station S3 during Premonsoon and the lowest of 0.094 ms/cm was reported at station-S4 during Premonsoon.The high value of conductivity of the present investigation as reported at station S3 during Premonsoon was contributed by influence of city sewage. Consequently station S4 shows minimum conductivity during the overall study. These may be due to the effects of freshwater from Karamana and Killi Ar.
Sediment is the major source of nitrates. Nitrogen is an important nutrient element in the sediment that controls the quantity of overlaying waters in an aquatic system. Nitrogen sources are mainly the oxidation of nitrogenous organic matter. Nitrogen content in the sediment is depending upon local condition of rainfall, quantities of freshwater inflows, turbulence and biological activities (Kemp, 1971). Total nitrogen content varied from 0.896 (S6) to 13.44 mg/g (S3) during post monsoon and 0.448 (S6) to 19.712 mg/g (S1) during Premonsoon.The station S1 recorded maximum total nitrogen content (19.712 mg/g) and minimum of 0.448 mg/g at station S6 during Premonsoon. The higher concentration of total nitrogen at station S1 during Premonsoon may be attributed to the disposal of effluent from Milma dairy and also it was promoted by anthropogenic influence. The comparatively low concentration of nitrogen in the estuarine region may be attributed to the denitrification process that takes place in the overlying water due to the anoxic condition that prevails in the region (Santhosh, 1999)
The organic carbon content in the sediment is derived from the primary production with in the water body and also
from terrigenous runoff. The reduced organic carbon provides the main energy source for heterotrophic organisms in the aquatic sediments (Hakanson and Jannson, 1983). An understanding of the distribution of organic carbon and its impacts on other physicochemical and biological parameters is a prerequisite for nutrient input and biological transformation of major and minor element of the system. The organic carbon % varied from. 0.315 (S2) to 6.5 % (S3) during post monsoon and 0.29 (S6) to 3.968 % (S3) during Premonsoon. The maximum organic carbon content of 6.5 5 was reported at station S3 during post monsoon and minimum of 0.29 % was found at station S6 during Premonsoon.The high organic carbon contents observed at station S3 may due to the deposition of terrestrial organic matter from the excessive land runoff, settling of material and decay of vegetation which is in agreement with value obtained for Paravur-Kappil backwater (Santhosh, 2002). In present work the organic matter content varied between 0.29 % and maximum 6.5 %, which is less than the value obtained in Karamana River (Krishnakumar, 2002).
Phosphorous is one among the chief nutrients in an aquatic environment. The increased phosphorous loading in aquatic systems from cultivated lands, domestic and industrial sewages have created the eutrophication problems (Parry, 1998). The phosphorus ranged from 0.012 (S5) to 0.096 µg/g (S2) during post monsoon and 0.012 (S6) to 0.097 µg/g (S1) during Premonsoon. The highest of 0.097 µg/g was reported at station S1 during Premonsoon and lowest of 0.012 µg/g was reported at station S5 during post monsoon and at station S6 during Premonsoon. At station S1, maximum value of 0.097 µg/g was obtained during Premonsoon, may be due to pollution by anthropogenic activities, disposal of wastes and decay of vegetation. Besides this Milma dairy effluent also enriched the phosphorous concentration in the station Nair et al, 1987 also observed similar increase in phosphorous level in the polluted zone.
concentration in station S4 (5.32 µg/g) during post monsoon is due to the disposal of waste and also due to the after effects of monsoon. Nair et al, (1984) also observed a high concentration of potassium during post monsoon. Here it is found that the diary effluent release alone is not responsible for the increase in potassium level. The minimum of 0.88 µg/g at station S2 near to dairy effluent discharge point clearly shows that there is no interference between concentration of potassium and diary effluent.
Calcium is one of the most abundant elements existing from different forms in the natural water and soil. Being present in high concentration in the rock it is leached from there to contaminate the water. Disposal of sewage and industrial waste also contribute to the content of calcium and has a great affinity to absorb on the soil particle and in turn affects the soil texture. In the sediment samples the calcium value ranged from 0.08 (S2) to 0.76 mg/g (S4) during post monsoon and 0.08 (S4) to 0.68 mg/g (S5) during premonsoon. At station S4, during the post monsoon, the maximum value was 0.76 µg/g and the minimum value of 0.08 µg/g was reported at station S2 during post monsoon and station S4 during Premonsoon.The maximum calcium content reported at station S4 and S5 may be due to the leaching of dead shelled organisms and some rock water and sediment interaction play an important role in the concentration of calcium irons in the water and soil. Similar finding were also reported by Santhosh (2002) at Paravur-Kappil backwater.
Sediment is the ultimate recipient of nearly all heavy metal pollutants in an aquatic ecosystem by various human activities. A large portion of metallic substances discharged in to the aquatic environment is ultimately incorporate into the sediment (Dursma and Gross, 1971). Heavy metals may associate with sediment particle either by adsorption or by complexation process. Iron is an essential element and most abundant metal found in Kerala Rivers. It is mainly derived from sources like industrial wastes, fertilizers and domestic waste. It is an important waste in sediment of estuaries (Nair
et al., 1987). The concentration of iron in the sediment samples ranged from 8690.6 (S2) to 88741.2 µg/g (S4) during post monsoon and the fluctuation is from 15855 (S2) to 17840.4 µg/g (S5) in the Premonsoon season. The station S4 reported the maximum concentration of 88741.2 µg/g and station S2 reported the minimum of 8690.6-µg/g iron during the post monsoon season. The maximum content of iron among the six stations, both during the post monsoon and Premonsoon.The was found in station S4. This station receives both the water from the Killi Ar and Karamana Ar and is purely riverine nature and it deposits maximum concentration of iron in this region. Studies shows that trace metal concentration are more in the riverine than the marine zone (Figures et al., 1985). This can also be explained on the basis of textural features of the sediment. The river has got finer particle like silt and clay where as the marine zone had finer and coarse sand as substratum. It is a well-known fact that finer particles contain more metal than the coarse particle (Fernandez and Jones, 1987).
Nickel is an important heavy metal. The concentration of nickel ranged from 2.4 (S2) to 8.8 µg/g (S4) during post monsoon and 0.4 (S6) to 4 µg/g (S2) during Premonsoon. The highest concentration of 8.8 µg/g was observed at S4
during post monsoon and the lowest of 0.4 µg/g at station S6 during premonsoon period. The concentrations of nickel in all the stations exist below the toxic limit (Saikia et al., 1987). Copper, despite its toxic effects is reckoned as an essential component of many enzymes. Copper reaches the aquatic environment chiefly from copper mine and a large number of industrial processes like agricultural chemicals paint etc. Sewage; industrial effluent and waste from electric generating plants also contain this metal. The limit of it in this standard is not due to its taste producing capacity. Variation in copper content is in such a way that, station S1 showing 335.2 µg/g and station S3 showing 47.2 µg/g during post monsoon season. But during premonsoon station S1 alone shows copper content (45.2 µg/g). In rest of the stations copper was found below detectable level. The high amount of copper content reported at station S1 may be due to the discharge of large amount of agricultural chemicals and sewage in to the water body. Generally in agricultural practice copper sulphate is widely used and it may be one of the reasons for higher concentration of copper.
Zinc is an essential element required in trace quantities to sustain biological life, but its large concentration is proved to be lethal. It is a common contaminant in industrial effluent (Dean et al; 1972). The concentration of zinc varied from0.4 (S5) to 18.6 µg/g (S3) during post monsoon. It shows a value ranging from 1 (S3) to 2.2 µg/g (S5) during premonsoon. Station S3 recorded the maximum zinc content of 18.6 µg/g during post monsoon and minimum value of 0.4 µg/g was noticed in station S5 during post monsoon. The result shows that zinc is presents only within the permissible level. The maximum value of zinc in the stations during the post monsoon may be due to the influence of chemical wastes disposed from different industries near the sampling sites which will generates zinc concentration in the sediment. The concentration of lead in the earth crust has been estimated as 12.5ppm ranking it as the 36th element in order of abundance (Abbasi et al., 1998). Major portion of lead in the surface water is from mining and smelting, refining etc. Lead reaches the aquatic sediment through precipitation; erosion and leaching of soil as well as municipal and industrial waste. Hydrogen ion concentration, hardness, and organic materials influence lead toxicity in sediment. In the present study the concentration of lead ranged from 21.2 (S2) to 99.4 µg/g (S1) during post monsoon and 0.4 (S4) to 29.4 µg/g (S1) during premonsoon. The high lead concentration of 99.4 µg/g at station S1 during the post monsoon season may be due to the anthropogenic activities and also due to the waste disposal from the adjacent automobile workshop.
explosives, paints, ceramic and paper industries etc. The domestic input of chromium into the water bodies cause a sharp drops in the dissolved oxygen content with hydrogen iodide production (Mishra, 1990). In sediment the chromium concentration of 0.052 µg/g was observed only in station S4 during premonsoon season. In all other sample it was found below detectable level. According to Abbasi et al (1998) the concentration of unpolluted sediment in Kuthyadi reservoir was in the order of 12 µg/g. Comparing these value it is evident that the station S4 shows comparative low concentration of chromium. Cadmium is a hazardous heavy metal like mercury. Cadmium is not essential for plants and animals. So cadmium in the environment can cause only harm and no gain. The average concentration of cadmium in sediment is 0.2ppm (Abbassi et al., 1998). During the post monsoon season no cadmium was found to be reported. But it has got concentration of 39.4 µg/g (S1), 40.2 µg/g (S2) and 180 µg/g at station S4 during premonsoon season. The high value of cadmium at station S4 (180 mg/g) maybe due to the dumping of sewage effluent.
IV. ACKNOWLEDGMENT
The third author is thankful to University of Kerala, Trivandrum for providing Research facility during the tenure of the study.
REFERENCES
[1] Abbassi, S. A., Nazima Abbassi and Rajendra Soni 1998. Heavy metals in the environment. Mittal Publications, New Delhi.
[2] APHA, 1995. Standard methods for the examination of water and waste water. 20th Edn., American Public Health Association,
Washington D.C
[3] Aston, S. R and C. N Hewitt 1977. Phosphorus and carbon distribution in a polluted coastal environment. Estuarine Coastal Mar. Sci., 5: pp. 243 – 254.
[4] Balakrishnan Nair, N., K. Krishnakumar, P. K, Abdul Aziz, K. Dharmaraj, M. Arunachalam and N. K Balasubramanian 1984. Ecology of Indian Estuaries Part I: Physicochemical features of water and sediment nutrients of Ashtamudi Estuary. Indian J. Mar. Sci., 12: pp. 143 – 150.
[5] Barnes, H.1959. Apparatus and methods of oceanography Part I. George Allen and Urwin Ltd., London, 341pp.
[6] Bloom, H. and G. M Ayling 1977. Heavy metals in the Derwent Estuary. Environmental Geology. 2: pp. 32.
[7] Chandran, R; G. S Thangaraj; V. Sivakumar; B. Sreekrishna Das and K. Ramamurthy, 1982. Ecology of macrobenthos in Vellar estuary.
Indian J. Mar. Sci. 11: pp. 122 – 127.
[8] Dean, J. G., F. L Bosqui and V. H Lannovette 1972. Removing heavy metals from wastewater. Environmental Science and Technology. 6: pp. 518 – 522.
[9] Dursma, E. K and M. G Gross 1971. Marine sediments and radioactivity. In: Radioactivity in the Marine environments. (Ed.) A. H Seymour, Washington D. C: National Academy of Sciences. pp. 147 – 160.
[10] El Wakeel, S.K and J.P. Riley 1957. The determination of organic carbon in marine muds, J. Cons. Intn. Explor. Mer. 22: 180-183.
[11] Fernandez, T. V and N. V Jones 1987. Some studies on the effect of zinc on Neries diversicolor (Polychaeta-annelida). Trop. Ecol., 28: pp. 9 – 21.
[12] Figures, J. M., M. M Martin, M. Maybeck and P. Seylar 1985. A comparative study of mercury contamination in the Tagu estuary (Portugal) and major French estuaries. J. Estuarine Coastal and Shelf Sci., 20: pp. 183 – 203.
[13] Hakanson, L and M. Jansson 1983. Lake Sedimentology. Springer-Verlags. Berlin. p. 316.
[14] Jitts, H. R. 1959. The absorption of phosphate of estuarine bottom deposits. Aus. J. Mar. Freshwat. Res., 10: pp. 7 – 21.
[15] Kemp, A. L. W. 1971. Organic carbon and nitrogen in the surface sediments of Lake Ontario, Eric. J. Sed. Petrol., 41: pp. 537 – 548. [16] Krishnakumar, A., 2002. Environmental degradation of two river
basins of Southern Kerala. Ph.D Thesis, Dept. of Environmental Sciences, University of Kerala.
[17] Lewis, D. W. 1984. Practical Sedimentology. Hutchinson Ross, Pennisylvania. p. 227.
[18] Mishra, P. C 1990. Fundamentals of Air and Water Pollution. Ashish Publication House, New Delhi. pp. 95 -100.
[19] Murthy P. S. N and M. Veerayya 1972. Studies on the sediment of Vembanad Lake, Kerala State: Part II: Distribution of total phosphorus. Indian J. Mar. Sci., 1: pp. 106 – 115.
[20] Nair, N. B., Tresa V. Fernandez, H. Suriyanaryanan, M. Arunachalam, P. K Abdul Aziz and K. Krishnakumar 1987. Distribution of heavy metals in the sediments of Ashtamudi Estuary, S. W Coast of India. In: Felicitation Volume contribution in Marine Science. pp. 269 – 289.
[21] Parry, R. 1998. Agricultural phosphorus and water quality. A.U.S Environmental Protection Agency Perspective. J. Envrion. Qual., 27: pp. 258 – 261.
[22] Patrick, W. H. Jr. and D. S Mikkelsen 1971. Plant nutrient behavior in flooded soil. In: Fertilizer, Technology and Use, 2nd Ed. Soil. Sci. Soc.
Amer. Inc. Madison, USA. pp. 187 – 215.
[23] Prasanthan, V. 1999. Environmental Impact Assessment: Carbon, Nitrogen, Phosphorus and Major elements of Parvathy Puthan Ar- A preliminary study. M.Phil thesis, Univ. Kerala, Trivandrum.
[24] Rantala, R. T and D. H Loring 1975. Multisediment analysis of Silicate rocks and marine sediments by Atomic Absorption Spectrophotometer. At. Abasop. News. Lett., 14: pp. 117 – 120. [25] Saikia, D. K., R. P Mathur and S. K Srivastava 1987. Heavy metals in
water and sediments of upper Ganga. Indian J. Environ. Hlth., 31 (1): pp. 11 – 17.
[26] Santhosh, S. 1999. Studies on the geochemistry and productivity of Paravur Canal System, Kollam District. M.Phil Thesis. Dept. of Environmental Sciences, University of Kerala.
[27] Santhosh, S. 2002. Hydrgeochemistry of Paravur-Kappil backwaters with special reference on phytoplankton. Ph.D Thesis, Dept. of Environmental Sciences, University of Kerala.
[28] Seralathan, P and D. Padmalal 1994. Textural studies of the surficial studies of Muvattupuzha River and Central Vembanad Estuary, Kerala. Jr. Geo. Society of India. Vol. 43: pp. 179 – 190.
[29] Sharma, B. K and H. Kaur 1997. An introduction to Environmental Pollution, Goel Publishing House, Surat, India. Ist edition. Pp: 78-89.
D r a i n a g e c h a n n e l s M a j o r r o a d s S a m p l i n g s i t e s
R a i l
L E G E N D
8 ? 3 1 '
8 ? 3 1 ' 7 6 ? 5 6 '
7 6 ? 5 4 '
n n n n n n nnnnnnnnnnnnnnnnnnnnnnnnnnnnnnnnnnnnnnnnnnn
7 6 ? 5 4 ' 7 6 ? 5 6 '
8 ? 2 6 ' 8 ?
2 6 '
U l l o o r
K a n
n am m
o o la
th o du
P avrv ath ip uth an ar U ll o o r th o d u P a tt o m th o d u V a n ch iy u
r tho du Vel i-A kkul am Est uary
S e w a g e f a r m
L A K S H A D E E P S E A K illi A
r
K ara
m ana
R ive
r
T H A M P A N O O R P e r u r k a d a
0 1 2 k m
S c a l e
••••••••••••••••••••••••••••••••••••••••••••••••
•
••••••••••••••••••••••••••••••••••••••••••••••••
•
••••••••••••••••••••••••••••••••••••••••••••••••
•
••••••••••••••••••••••••••••••••••••••••••••••••
•
••••••••••••••••••••••••••••••••••••••••••••••••
•
••••••••••••••••••••••••••••••••••••••••••••••••
•
) ) ) ) ) ) )))))))))))))))))))))))))))))))))))))))))))M i l m a d a i r y M i l m a d a i r y M i l m a d a i r y M i l m a d a i r y M i l m a d a i r y M i l m a d a i r y M i l m a d a i r y M i l m a d a i r yM i l m a d a i r yM i l m a d a i r yM i l m a d a i r yM i l m a d a i r yM i l m a d a i r yM i l m a d a i r yM i l m a d a i r yM i l m a d a i r yM i l m a d a i r yM i l m a d a i r yM i l m a d a i r yM i l m a d a i r yM i l m a d a i r yM i l m a d a i r yM i l m a d a i r yM i l m a d a i r yM i l m a d a i r yM i l m a d a i r yM i l m a d a i r yM i l m a d a i r yM i l m a d a i r yM i l m a d a i r yM i l m a d a i r yM i l m a d a i r yM i l m a d a i r yM i l m a d a i r yM i l m a d a i r yM i l m a d a i r yM i l m a d a i r yM i l m a d a i r yM i l m a d a i r yM i l m a d a i r yM i l m a d a i r yM i l m a d a i r yM i l m a d a i r yM i l m a d a i r yM i l m a d a i r yM i l m a d a i r yM i l m a d a i r yM i l m a d a i r yM i l m a d a i r yM i l m a d a i r y
S 5 S 5 S 5 S 5 S 5 S 5 S 5 S 5S 5S 5S 5S 5S 5S 5S 5S 5S 5S 5S 5S 5S 5S 5S 5S 5S 5S 5S 5S 5S 5S 5S 5S 5S 5S 5S 5S 5S 5S 5S 5S 5S 5S 5S 5S 5S 5S 5S 5S 5S 5S 5
S 2 S 2 S 2 S 2 S 2 S 2 S 2 S 2 S 2 S 2 S 2 S 2 S 2 S 2 S 2S 2S 2S 2S 2S 2S 2S 2S 2S 2S 2S 2S 2S 2S 2S 2S 2S 2S 2S 2S 2S 2S 2S 2S 2S 2S 2S 2S 2S 2S 2S 2S 2S 2S 2S 2
S 3 S 3 S 3 S 3 S 3 S 3 S 3
S 3S 3S 3S 3S 3S 3S 3S 3S 3S 3S 3S 3S 3S 3S 3S 3S 3S 3S 3S 3S 3S 3S 3S 3S 3S 3S 3S 3S 3S 3S 3S 3S 3S 3S 3S 3S 3S 3S 3S 3S 3S 3S 3 S 4S 4S 4S 4S 4S 4S 4S 4S 4S 4S 4S 4S 4S 4S 4S 4S 4S 4S 4S 4S 4S 4S 4S 4S 4S 4S 4S 4S 4S 4S 4S 4S 4S 4S 4S 4S 4S 4S 4S 4S 4S 4S 4S 4S 4S 4S 4S 4S 4S 4
[image:5.595.79.499.158.606.2]S 6 S 6 S 6 S 6 S 6 S 6 S 6 S 6S 6S 6S 6S 6S 6S 6S 6S 6S 6S 6S 6S 6S 6S 6S 6S 6S 6S 6S 6S 6S 6S 6S 6S 6S 6S 6S 6S 6S 6S 6S 6S 6S 6S 6S 6S 6S 6S 6S 6S 6S 6S 6