HOW CAN ADVERSE EVENTS INFORMATION BE USED TO MORE EFFECTIVELY INFORM CANCER PATIENT CARE?
Syril Pettit
A dissertation submitted to the faculty at the University of North Carolina
at Chapel Hill in partial fulfillment of the requirements for the degree of Doctor of Public Health in the Department of Health Policy and Management in the Gillings School of Global Public
Health.
Chapel Hill 2019
Approved by: Ethan Basch Pam Silberman
Kristen Hassmiller-Lich Steven Lipshultz
© 2019 Syril Pettit
ABSTRACT
Syril Pettit: How Can Adverse Events Information Be Used to More Effectively Inform Cancer Patient Care?
(Under the direction of Ethan Basch)
Due to advances in screening and therapy design, cancer patients are living longer while on or following therapy. Therapy-related adverse events (AEs) are an unintended, but not
infrequent, outcome of these treatments. AEs can impact quality of life, adherence to therapy, economic status, and treatment decision-making. This novel qualitative study is the first to undertake a multi-stakeholder evaluation of the impact of AE information on informing cancer patient care in the context of extended survival. The evaluation focuses on a growing subset of cancer patients – those receiving adjuvant therapy.
Adjuvant therapies, used to manage many common cancers, lower the risk that the cancer will return. In this setting, mediating the impact of potential acute or delayed adjuvant treatment-related AEs relative to an uncertain potential for tumor recurrence presents important challenges in balancing risks versus benefits.
Stakeholder perspectives on generating, disseminating, and/or adjuvant treatment-related AE information were elicited via key informant interviews with patient advocacy, clinical care, regulatory, drug development, and healthcare payer representatives. The stakeholders identified future needs in four key areas: 1) information resources, 2) information integration and
This study revealed the following novel insights: 1) there is cross-stakeholder agreement that change is needed to improve the use of AE information in the adjuvant setting to improve patient outcome, 2) the directionality of needed changes are similar across stakeholders, although specific priorities varied, and 3) the potential to realize broad systemic progress in the use of adjuvant-related AE information is a challenge that lacks clear ownership. This lack of
ownership has adversely impacted resourcing, efficiency, and collective progress and is likely to be a progress-limiting factor in realizing transformational change.
ACKNOWLEDGMENTS
There isn’t enough space to thank my family and friends for supporting me through this journey. Your constant encouragement, humor, and company kept me going and have given me added incentive to finish—to allow more time with you! I am so fortunate to have had all of you by my side.
Special thanks to my husband, Tim, for never doubting and always being a fan.
Special thanks to my kids, Mara and Torin, for letting me revel (and gripe) about being a student right alongside them.
Thanks to my parents for instilling a life-long love of—and respect for—learning.
Thanks to all those friends from Team Lava for patiently, and supportively, listening to me prattle on for all those miles on the running trails—and for your great advice on data analysis and implementation. No end to your talents, ladies!
Thank you to my committee members for their expert guidance and enthusiasm. Your passion for your own work in this area has made all the difference.
Thank you to my colleagues at HESI for supporting my personal and professional growth— and for being such good friends and mentors.
TABLE OF CONTENTS
LIST OF TABLES ... xi
LIST OF FIGURES ... xii
LIST OF ABBREVIATIONS ... xiii
CHAPTER 1: BACKGROUND AND SIGNIFICANCE... 1
Adverse Events, Patient-Centered Care, and Patient Preferences ... 5
Value Frameworks: New Tools for Cancer Care Decision Making ... 7
The Development of Patient-Relevant Data ... 11
An Unmet Need for Systems-Level Evaluation ... 13
CHAPTER 2: LITERATURE REVIEW ... 15
Literature Review Part 1: Cost Models and Valuation of Adverse Events... 16
Inclusion and Exclusion Criteria ... 18
Study Characteristics ... 21
Cost Assessment Methodologies and Data Sources ... 22
Defining and Quantifying Adverse Events ... 25
Defining Patient Populations ... 28
Limitations of This Review ... 29
Literature Review 2: Current Practice in and Expert Perspectives on the Use of Adverse Events in Value Frameworks ... 30
Synthesis of Results of Literature Evaluations ... 36
Alternatives to the Use of Clinician-Reported Adverse Event Data
Derived From Randomized Controlled Trials ... 38
Patient-Reported Outcomes and Quality of Life Metrics ... 39
Increased Use of Observational/Surveillance/Electronic Health Record Data Sets ... 40
The Costs ... 40
The Patients ... 41
Summary of Opportunities to Improve the Use of Adverse Events to Inform Care Decisions ... 42
CHAPTER 3: RESEARCH AIM AND METHODS ... 44
Methods... 46
Development of the Conceptual Model Guiding the Interview Design ... 47
Translating the Conceptual Model Into Qualitative Research Plans ... 50
Definition of Key Stakeholders for Study ... 50
Stakeholder Recruitment ... 53
Design and Focus of Qualitative Key Informant Interview Questions ... 54
Ethics... 56
Data Collection and Management ... 57
Data Analysis and Coding ... 57
Coding Software ... 57
Coding Support ... 58
Limitations/Boundaries of Research ... 59
Approach to Information Synthesis ... 61
CHAPTER 4: INTRA-STAKEHOLDER RESULTS AND DISCUSSION OF TRENDS ... 62
Introduction ... 62
Drug Developers ... 63
Roles ... 63
Roles in Adjuvant Therapy ... 64
Current Challenges... 65
Future Needs ... 68
Summary of Roles and Accountability ... 71
Regulators ... 71
Roles ... 71
Roles Related to Adjuvant Therapy ... 72
Current Challenges... 72
Future Needs ... 75
Summary of Roles and Accountability ... 77
Clinicians ... 77
Roles ... 77
Roles Related to Adjuvant Therapy ... 78
Current Challenges... 79
Future Needs ... 82
Summary of Roles and Accountability ... 84
Patient Advocates... 85
Role ... 85
Role in Adjuvant Therapy ... 85
Current Challenges... 86
Future Needs ... 88
Payers ... 90
Roles ... 90
Role in Adjuvant Therapy ... 91
Current Challenges... 92
Future Needs ... 95
Summary of Roles and Accountability ... 97
Further Exploration of Intra-Stakeholder Differences as Revealed via Code Application .... 98
Summary and Application of Results ... 101
CHAPTER 5: CROSS-STAKEHOLDER RESULTS AND DISCUSSION—USE OF THEMATIC ANALYSIS TO IDENTIFY OPPORTUNITIES FOR CHANGE ... 103
Overview ... 103
Aligning Stakeholder Responses Against Common Themes ... 104
Theme 1: Information Resources ... 107
Theme 2: Integration and Implementation ... 109
Theme 3: Value Systems and Culture ... 110
Theme 4: Alignment and Ownership ... 112
A New Conceptual Model and Next Steps ... 113
CHAPTER 6: PLAN FOR CHANGE ... 115
Overview ... 115
A Difficult Problem, But Not a Novel Construct ... 116
Cross-Sector/Cross-Disciplinary Initiatives Are Essential for Addressing Wicked Problems But Are Also Inherently Challenging ... 118
Defined Facilitation and Collaborative Capacity Building Roles Are Essential ... 119
Initiating Focused Change ... 122
Proposed Implementation Strategy ... 124
Step 1: Assign the Name and Mission ... 125
Step 2: Form the Leadership Team ... 125
Step 3: Define Systemic Needs ... 129
Step 4: Initiate Leadership Team Outreach ... 130
Step 5: Involve Other Stakeholders ... 136
Step 6: Evaluate the Program ... 138
Conclusion ... 141
APPENDIX A: OUTREACH SCRIPTS FOR KEY INFORMANT INTERVIEW PARTICIPATION ... 142
APPENDIX B: INFORMED CONSENT FORM ... 146
APPENDIX C: KEY INFORMANT INTERVIEW GUIDE ... 152
APPENDIX D: CODE BOOK... 156
APPENDIX E: ONE-PAGE RESEARCH PROPOSAL SUMMARY ... 160
APPENDIX F: DEFINITIONS... 161
APPENDIX G: DRAFT LETTER OF SUPPORT ... 162
LIST OF TABLES
TABLE 1: Comparison of five major value frameworks regarding the use of
toxicity and adverse event approaches ... 10
TABLE 2: Search terms for literature review ... 17
TABLE 3: Inclusion and exclusion criteria ... 19
TABLE 4A: Cost assessment methodologies ... 23
TABLE 4B: Defining costs ... 24
TABLE 4C: Nature/frequency of treatment-related adverse events ... 26
TABLE 4D: Incorporation of “quality of life” ... 28
TABLE 4E: Defining the population ... 28
TABLE 5: Search strategy ... 31
TABLE 6: Inclusion/exclusion criteria ... 31
TABLE 7: Study designs ... 33
TABLE 8: Proposals for improvement of inputs to existing framework... 34
TABLE 9: Relationship between key informant interview questions and study aims ... 55
TABLE 10: Code book development and secondary coding process ... 59
TABLE 11: Summary results: synthesis of stakeholder perspectives on alignment, challenges, and future opportunities ... 105
TABLE 12: Application of selected ABLe Change Framework elements to the proposed Plan for Change ... 123
LIST OF FIGURES
FIGURE 1: Schematic pathway linking cancer treatment, survivorship, adverse events,
and quality of life ... 4 FIGURE 2: Conceptual model for relationships between quality of life, adverse events,
and adherence from Shingler et al. ... 6 FIGURE 3: Data sources and approaches intended to “inform” cancer
patient care and decision making ... 14 FIGURE 4: Multistage process for structured literature reviews ... 16 FIGURE 5: PRISMA diagram demonstrating the part I literature evaluation
and exclusion process ... 20 FIGURE 6: PRISMA diagram demonstrating the part II literature evaluation
and exclusion process ... 32 FIGURE 7: Summary of recommendations from literature review for improving
adverse event data relevance in value frameworks ... 35 FIGURE 8: Graham’s Knowledge to Action Framework ... 48 FIGURE 9: REAL Cycle: Roles, Evidence, Action, and Leadership toward
improved use of adverse events information in cancer care ... 50 FIGURE 10: Visual representation of coding frequency ... 63 FIGURE 11: An illustrative example of an approach to visual trend analysis of codes ... 98 FIGURE 12: Original conceptual model demonstrating the integral role of defined
alignment and ownership in facilitating improved use of AEs to inform cancer patient care .... 114 FIGURE 13: Conceptual model driving the Plan for Change ... 116 FIGURE 14: Proposed system of interaction for ACTogether ... 130 FIGURE 15: Changes in overall environment resulting from ACTogether ... 131 FIGURE 16: Overview of the Centers for Disease Control and Prevention Framework
LIST OF ABBREVIATIONS
AE Adverse event
ABLe Above and Below the Line (Change Framework) ASCO American Society for Clinical Oncology
CMS U.S. Centers for Medicare and Medicaid Services CTC Consensus Toxicity Criteria
CTCAE Common Terminology Criteria for Adverse Events CTEP Cancer Therapy Evaluation Program
DFS Disease-free survival EHR Electronic health record
ESMO European Society for Medical Oncology FDA U.S. Food and Drug Administration HCUP Healthcare Cost and Utilization Project HTA Health technology assessment
ICD International Classification of Diseases ICER Institute for Clinical and Economic Review KII Key informant interview
LHS Learning healthcare system
NCI National Cancer Institute NHB Net health benefit
OCM Medicare Oncology Care Model PCDD Patient Center Drug Development PCMH Patient-Centered Medical Home
PCORI Patient-Centered Outcomes Research Initiative PFLY Progression-free life-year
PFS Progression-free survival
PRISMA Preferred Reporting Items for Systematic Reviews and Meta-Analyses PRO Patient-reported outcome
PRO-CTCAE Patient-Reported Outcome Common Terminology Criteria for Adverse Events QALY Quality-adjusted life-year
QoL Quality of life
RCT Randomized controlled trial
RWE Real-world evidence
CHAPTER 1: BACKGROUND AND SIGNIFICANCE
Life with cancer and its treatment—whether as a patient, survivor, or supporter—is an almost universal experience. Per the U.S. National Cancer Institute (NCI), 40% of the population will be diagnosed with cancer in their lifetime and many others are friends or family members of cancer patients (Howlader et al., 2016). Fortunately, the last decade has seen tremendous advances in cancer therapy design and delivery and thus an increase in survival rates for many cancer types (Edwards et al., 2014). This increasing efficacy means that patients are living longer while on therapy or following their primary course of therapy.
Unfortunately, therapy-related adverse health events are an unintended, but not infrequent, outcome of these life-saving therapies (Berridge, Pettit, & Sarazan, 2014; Cleeland et al., 2012; Pettit et al., 2016). At their most severe or persistent, cancer treatment-related adverse events (AEs) can be lethal (e.g., cardiac failure or severe immune response) (Armstrong et al., 2014; Emens, Butterfield, Hodi, Marincola, & Kaufman, 2016). They can also inhibit the curative value of the therapy if the side effects impede a patient’s ability to continue therapy (Castellanos, Chen, Drexler, & Horn, 2015). Oncologic therapies may also cause less dire but still debilitating systemic events, including fatigue, gastrointestinal issues, skin inflammation, and neuropathy (Bennett et al., 2016; de Golian, Kwong, Swetter, & Pugliese, 2016; Kumar et al., 2017;
The practical impacts of treatment-related AEs and their associated supportive care requirements may not be fully characterized until the oncology drug is in broad clinical use (Pettit et al., 2016). These impacts can include a broad range of direct financial costs as well as emotional, social, logistical, and physical tolls. Observational studies and health record analyses demonstrate that cancer treatment-related events can degrade patients’ or survivors’ overall health status, cause financial strain, and limit their ability to meet family obligations, work, or pursue fitness or hobbies (Cleeland et al., 2012; Fitzner, Oteng-Mensah, Donley, & Heckinger, 2017). Modulatory factors such as variable treatment adherence rates, drug-drug interactions, access to care, and patient comorbidities result in a range of patient experiences and healthcare system demands (Fitzner et al., 2017). For the purposes of this analysis, this will be referred to as the “postmarket” setting. Supportive care to ameliorate AEs may require patients to procure a broad range of pharmacologic treatments, undergo monitoring and testing, change diet and exercise practices, or pursue “alternative” approaches like acupuncture (Kottschade et al., 2016; Lee et al., 2017; Wallner, Köck-Hódi, Booze, White, & Mayer, 2016). Even for a specific treatment-related AE (e.g., aromatase inhibitor–induced chronic pain), the nature of the supportive approaches that are adopted may vary considerably from site to site (Yang et al., 2017). Collectively, the cost of purchasing and administering therapy, monitoring health while on therapy or after, and managing AE detection and care represents a major societal
investment—as much as $120 billion and growing annually (Fitzner et al., 2017; Yabroff, Lund, Kepka, & Mariotto, 2011).
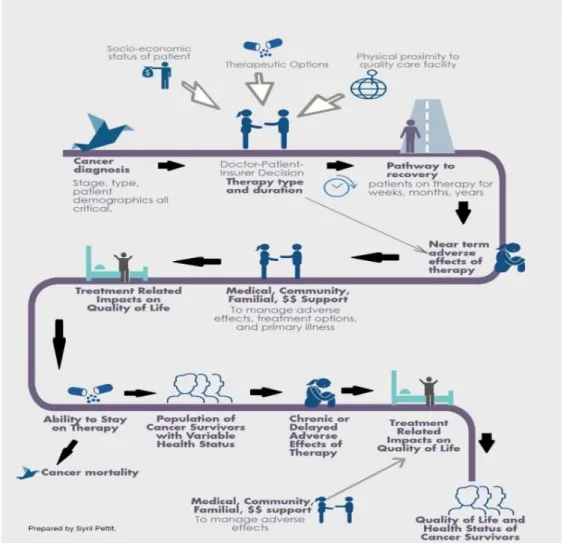
oncologics and thus does not consider cost factors in its decision making (McKee, Farrell, Pazdur, & Woodcock, 2010; Siddiqui & Rajkumar, 2012). Even if costs are not directly considered in drug design or approval, there can be no question that economic considerations (among other factors) materialize once the drug moves into clinical practice. As illustrated in Figure 1, a range of influences (e.g., cost of drug, access to clinical facilities, quality of life [QoL] impacts of treatment and disease, impact on familial support systems, etc.) affect overall patient experience and outcome.
Adverse Events, Patient-Centered Care, and Patient Preferences
Given the potential impact of AEs on patient outcome (health, QoL, and financial), the relevance of AE data as inputs to inform decision making by patients and clinicians seems evident. Foundational documents such as the World Health Organization (2003) report on adherence to long-term therapies and the movement toward “patient-centered care” and “shared decision making” clearly establish the need for patient access to understandable information about the benefits, risks, costs, and logistics of their treatment (Advisory Board Company, 2015; Atherton et al., 2013; Barry & Edgman-Levitan, 2012; Hare et al., 2017; National Institute for Health and Care Excellence, 2009; Zucca, Sanson-Fisher, Waller, & Carey, 2014). Patient-centered care, introduced in 1988 by the Picker Institute and later adopted by the Institute of Medicine report Crossing the Quality Chasm, promotes the following: consideration of physical comfort; emotional support; respect for patients’ preferences and values; care integration and coordination; involvement of family and friends; and the provision of information,
communication, and education that supports patients’ ability to make informed decisions about their care (Institute of Medicine, 2001; Zucca et al., 2014). Although the concept of patient-centered care is widely embraced, the way in which these elements are pragmatically
Similarly, patient preference also plays an important role in understanding how AE or QoL information is incorporated into treatment and decision making. A 2014 in-depth literature analysis explored the published correlations between cancer treatment preferences (e.g., preference for a specific balance of toxicity, QoL, potential for “progression-free survival,” logistics, cost, etc.) and potential adherence to therapy and patient outcome (Shingler et al., 2014). “Progression-free survival” is defined by the NCI (2018) as “The length of time during and after the treatment of a disease, such as cancer, that a patient lives with the disease but it
does not get worse.” Although no quantitative relationships could be established, the study
recommends a “greater focus on the importance of patient preference in improving adherence levels to medication” and asserts that in oncology, “patient preference is a driver of adherence” (Shingler et al., 2014). As illustrated in Figure 2 below, Shingler et al. propose a range of influencing factors that may impact such adherence.
As summarized below, the authors specify three categories of factors (external, cognitive, and behavioral) that are theorized to influence adherence and are closely related to the patient experience of AEs.
External Factors Influencing Adherence to Therapy
• “Information (spoken/written/other) that the patient has with their healthcare provider, friend or relatives regarding likely treatment benefits, side effects and related burden.” • “Characteristics (of the treatment regimen) such as possible symptoms control etc. that
patients may or may not perceive as a burden.”
Cognitive Factors Influencing Adherence to Therapy
• “Beliefs regarding their disease and prognosis which they arrive with… the value they place on maintaining QoL versus perhaps maximizing their chance of survival…”
Behavioral Factors Influencing Adherence to Therapy
• “…[The] views or values that patients have regarding what they want from their treatment… e.g., wanting to maximize their survival… or …not wishing to undergo further rounds of chemotherapy.”
Given the many levels at which AE information is anticipated to influence patient preference in this model, the incorporation (or absence) of a particular AE data type is again highlighted as a critical element with influence on clinical care and patient outcome.
Value Frameworks: New Tools for Cancer Care Decision Making
last 10 years, quantitative efforts to capture the impact of treatment-related AEs have often taken the form of economic studies and quality-adjusted life-year (QALY) models and projections (Pearce, Haas, & Viney, 2013). These efforts are largely aimed at economic, regulatory, and/or policy audiences. Beginning in 2016, the field took a significant conceptual step forward with the release of five major “value frameworks.” These approaches are intended to inform policy
decisions as well as pragmatic therapy choices by clinicians and patients. Value frameworks seek to fulfill some of the patient-centered care objectives by providing a means to integrate data on efficacy, safety (AEs), patient QoL, and, in some cases, cost for specific therapeutic
modalities (ESMO, 2017; ICER, 2017; MSKCC, 2017; NCCN, 2017b; Schnipper et al., 2016). The 2016 frameworks and their self-proclaimed objectives are as follows:
• American Society of Clinical Oncology (ASCO) Value Framework: “A framework that would enable a physician and patient to assess the value of a particular cancer treatment regimen given the patient’s individual preferences and circumstances” (Schnipper et al., 2016).
• European Society for Medical Oncology’s (ESMO) Magnitude of Clinical Benefit Scale (MCBS): “The ESMO-MCBS is an important first step to the critical public policy issue of value in cancer care, helping to frame the appropriate use of limited public and personal resources to deliver cost effective and affordable cancer care” (ESMO, 2017).
that provides sustainable access to high-value care for all patients” (ICER, 2017). • Memorial Sloan Kettering Cancer Center’s (MSKCC) DrugAbacus: “DrugAbacus
provides a way of thinking about how to price drugs. This interactive tool takes more than 50 cancer drugs and lets you compare the company’s price to one based on value” (MSKCC, 2017).
• National Comprehensive Cancer Center Network (NCCN) Evidence Blocks: “The goal is to provide the health care provider and the patient information to make informed choices when selecting systemic therapies based upon measures related to treatment, supporting data, and cost”(NCCN, 2017a).
The construct of these five frameworks and their inputs, outputs, weighting, and intended audiences all vary considerably. However, all speak to a movement toward a more nuanced and inclusive evaluation of the impacts of therapeutic choice in the cancer care arena. The relative constructs of these five frameworks have been qualitatively compared and contrasted in the literature (Allen, Stewart, Roberts, & Sigal, 2017; Basch, 2016; Chandra, Shafrin, & Dhawan, 2016; Schnipper & Bastian, 2016; Subramanian & Schorr, 2016) and thus a comprehensive structural comparison will not be repeated here.
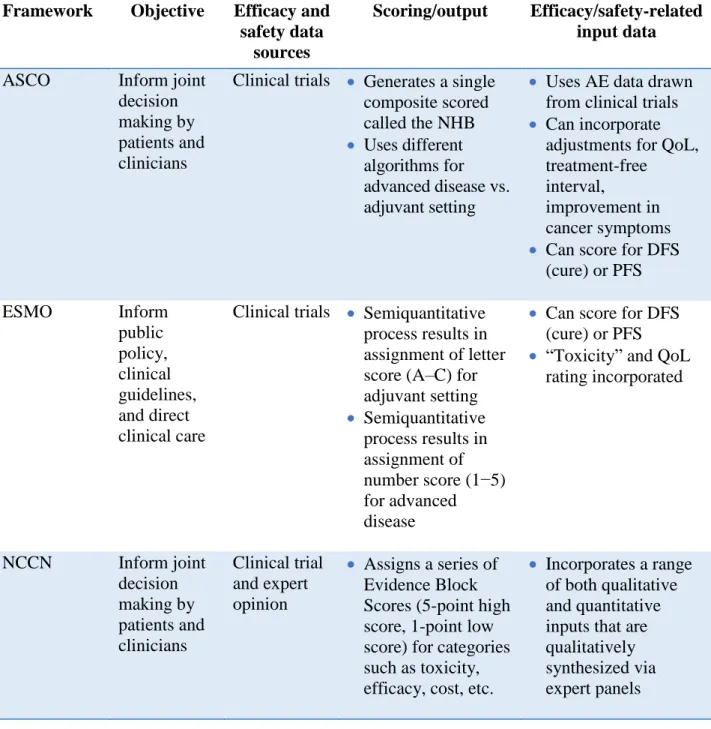
TABLE 1: Comparison of five major value frameworks regarding the use of toxicity and adverse event approaches1
Framework Objective Efficacy and
safety data sources
Scoring/output Efficacy/safety-related input data
ASCO Inform joint decision making by patients and clinicians
Clinical trials • Generates a single composite scored called the NHB • Uses different
algorithms for advanced disease vs. adjuvant setting
• Uses AE data drawn from clinical trials • Can incorporate
adjustments for QoL, treatment-free
interval,
improvement in cancer symptoms • Can score for DFS
(cure) or PFS
ESMO Inform
public policy, clinical guidelines, and direct clinical care
Clinical trials • Semiquantitative process results in assignment of letter score (A–C) for adjuvant setting • Semiquantitative
process results in assignment of number score (1−5) for advanced disease
• Can score for DFS (cure) or PFS • “Toxicity” and QoL
rating incorporated
NCCN Inform joint decision making by patients and clinicians Clinical trial and expert opinion
• Assigns a series of Evidence Block Scores (5-point high score, 1-point low score) for categories such as toxicity, efficacy, cost, etc.
• Incorporates a range of both qualitative and quantitative inputs that are qualitatively synthesized via expert panels
ICER Provide synthesis for use by policymakers and payers/ formularies Clinical trials, econometric studies
• Compares standard intervention and new treatment relative to short-term costs and longer-term healthcare system burdens and benefits
• Includes QALY scoring factors • Serious AEs are
factored into scoring • Ability to work while
on therapy factored into scoring
DrugAbacus Provide pricing data for use by policymakers and payers Drug safety/ efficacy data as provided to FDA
• Factors benefits and burdens of treatment into a new “price” based on the Abacus algorithm relative to industry-specified price
• Scores improved survival rate • Serious AEs (e.g.,
grade 3 or greater) incorporated into scoring
• The probability that a patient discontinues treatment because of toxicity is considered in scoring
• Treatment novelty, R&D cost, health burden, and treatment duration
The Development of Patient-Relevant Data
as convened by the Institute of Medicine in the early 2000s. The LHS concept promotes the generation of “the best evidence and to apply that evidence to the healthcare choices that each patient and provider make in collaboration; to drive the process of discovery as a natural outgrowth of patient care; and to ensure innovation, quality, safety, and value in health care” (Institute of Medicine, 2007).Not surprisingly, the elements incorporated into the value frameworks above closely parallel the tenets of the LHS model. The generation of more RWE has been proposed as a means of realizing a more iterative and interconnected healthcare system.
The feasibility of RWE as a complement to regulatory safety evaluation via randomized controlled trials (RCTs) and/or as a means of generating novel efficacy, safety, or use
decision making. If indeed RWE is intended to enhance the value of health data (AE-driven or otherwise) to a range of stakeholders, it seems clear that more nuanced and diverse evaluation of stakeholder need must be clarified.
Real-world patient experience is also being pursued via efforts to enhance patient engagement in regulatory approval considerations. In 2012, the U.S. Congress approved the Food and Drug Administration Safety and Innovation Act, which requires the FDA “to develop and implement strategies to solicit the views of patients during the medical product development process and consider the perspectives of patients during regulatory discussions.” This directive, in combination with resources and programs defined via the Prescription Drug User Fee Act reauthorizations, led to the launch of the FDA’s Patient Center Drug Development (PCDD) initiative. A primary outcome of the PCDD has been disease-focused meetings, convened by the FDA, that actively involve patients in providing perspective on risk:benefit considerations of relevance for the specific disease and associated therapies. Although these meetings have been an important step forward in integrating patient perspectives in selected settings, their impact on the overall approach to evaluating and conveying information on a therapy’s impact on patient QoL and outcome is still evolving.
An Unmet Need for Systems-Level Evaluation
On the other hand, the continued development and reinvention of these approaches suggests that the complement of current efforts may not be adequately synergistic or fit for purpose.
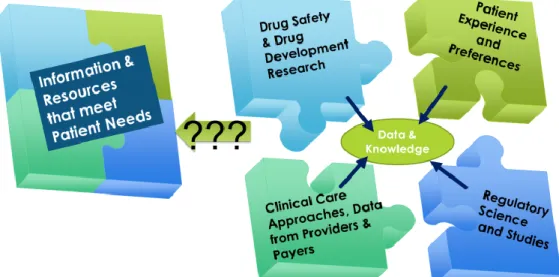
A systems-level assessment of whether the biomedical and public health communities are generating AE-related information and frameworks that are suited to the needs of contemporary cancer treatment decision makers is lacking. This study will address the question of whether the existing “puzzle pieces” fit together to provide the types of information most needed by patients and other key stakeholder groups to make informed decisions around cancer treatment (see Figure 3). By evaluating relevant information networks and network interactions, this study will develop new insights toward the goal of understanding the following question: How can AE information be used to more effectively inform cancer patient care?
CHAPTER 2: LITERATURE REVIEW
As a first step in addressing the question of how AE information can be used to more effectively inform patient care, it is necessary to first define how AE information has been used historically, how it is being used currently, and how it has been proposed for future use.
Comprehensive literature reviews were conducted using published, peer-reviewed manuscripts as the informational bases for this evaluation. Specifically, two foundational questions were
evaluated:
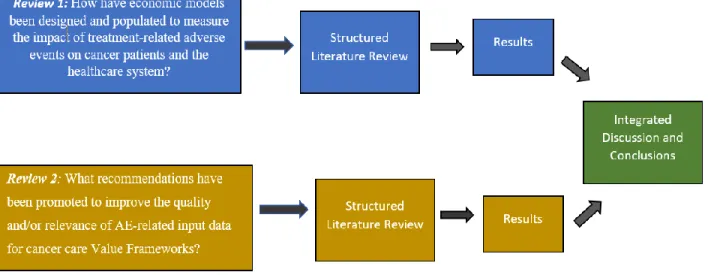
• Review1: How have economic models been designed and populated to measure the impact of treatment-related AEs on cancer patients and the healthcare system?
• Review 2: What recommendations have been promoted to improve the quality and/or relevance of AE-related input data for cancer care value frameworks?
The first review focuses on economic impact models of treatment-related AEs in cancer patients and the healthcare system. A review of economic modeling approaches was deemed critical, as these methods were the primary format for “valuation” of treatment-related AEs prior to the publication of integrated value frameworks in 2016. The second literature review builds forward by defining the ways in which 2016/2017 integrative value frameworks have (or have not) modulated these prior approaches. Specific attention was given to published
recommendations for future needs. The methodological flow of this parallel approach is diagramed below inFigure 4.
FIGURE 4: Multistage process for structured literature reviews
Literature Review Part 1: Cost Models and Valuation of Adverse Events
following question: How have economic models been designed to measure the impact of treatment-related AEs on cancer patients and the healthcare system?
A structured search was conducted using the following databases: PubMed, Web of Science, CINAHL Plus with Full Text, and EconLit. The selection of biomedical, nursing/allied
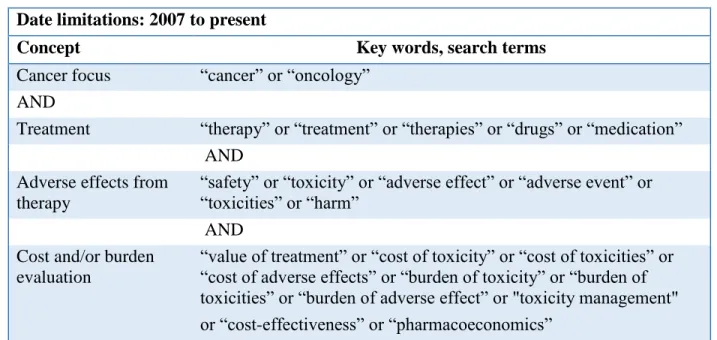
healthcare, and economics databases for inclusion in this review reflects the multidisciplinary nature of the issues and stakeholders under study. Additional studies were identified through a manual search of references in relevant articles (snowballing) and evaluation of resources from leading organizations in the cancer care arena in the United States (e.g., ASCO). The search terms used in this effort are described below (Table 2). Because the databases that were searched span multiple disciplines, the subset of terms utilized for that database varied slightly from database to database.
TABLE 2: Search terms for literature review
Date limitations: 2007 to present
Concept Key words, search terms
Cancer focus “cancer” or “oncology” AND
Treatment “therapy” or “treatment” or “therapies” or “drugs” or “medication” AND
Adverse effects from therapy
“safety” or “toxicity” or “adverse effect” or “adverse event” or “toxicities” or “harm”
AND Cost and/or burden
evaluation
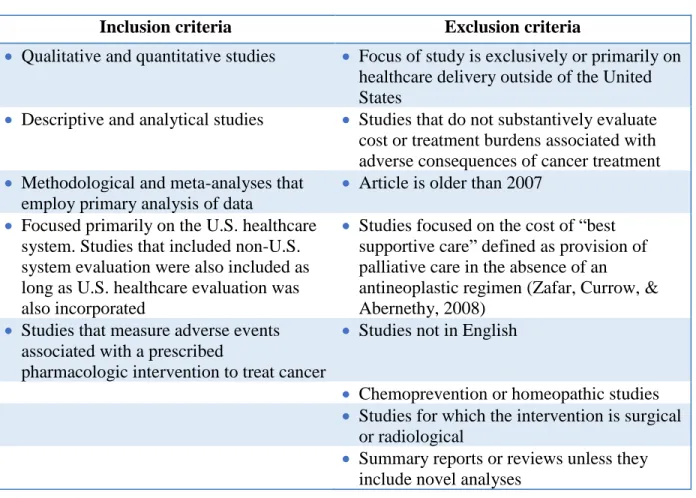
Inclusion and Exclusion Criteria
The focus of this research is on those studies that specifically seek to characterize the costs (economic, social, logistical) of managing and treating adverse effects of oncologic therapy. To ensure the contemporary relevance of the methodologies and underlying economic, healthcare, and treatment assumptions, only those studies published in the last 10 years were reviewed. The term “comparative effectiveness” is intentionally excluded in order to exclude the “comparative effectiveness research” literature. Although these studies do sometimes include cost estimates of AEs, their focus is exclusively on the differential/comparator between two similar therapies, and thus the total cost of AEs (the focus of this review) is rarely measured (Pearce et al., 2013). Prior systematic reviews of AE effect cost assessments have noted this limitation in the use of
TABLE 3: Inclusion and exclusion criteria
Inclusion criteria Exclusion criteria
• Qualitative and quantitative studies • Focus of study is exclusively or primarily on healthcare delivery outside of the United States
• Descriptive and analytical studies • Studies that do not substantively evaluate cost or treatment burdens associated with adverse consequences of cancer treatment • Methodological and meta-analyses that
employ primary analysis of data
• Article is older than 2007 • Focused primarily on the U.S. healthcare
system. Studies that included non-U.S. system evaluation were also included as long as U.S. healthcare evaluation was also incorporated
• Studies focused on the cost of “best supportive care” defined as provision of palliative care in the absence of an
antineoplastic regimen (Zafar, Currow, & Abernethy, 2008)
• Studies that measure adverse events associated with a prescribed
pharmacologic intervention to treat cancer
• Studies not in English
• Chemoprevention or homeopathic studies • Studies for which the intervention is surgical
or radiological
• Summary reports or reviews unless they include novel analyses
The proposed search strategy was as follows: a) search databases as specified above; b) include all references identified in direct as well as snowballing search into reference manager and remove duplicates; c) review all manuscript abstracts and date of publications against
inclusion/exclusion criteria and restrict reference list accordingly; d) conduct a full text review of all remaining manuscripts; and e) for those manuscripts meeting all inclusion criteria, populate the extraction table accordingly. The articles remaining after all exclusion criteria had been applied were reviewed in full. This literature evaluation and data collection allows for
heavily weighted to evaluations outside of the United States. This study is limited to the United States, as other countries have different means for setting reimbursement levels and may have differential access to drugs and therapies. As such, cost estimation values and approaches are not meaningful across national boundaries.
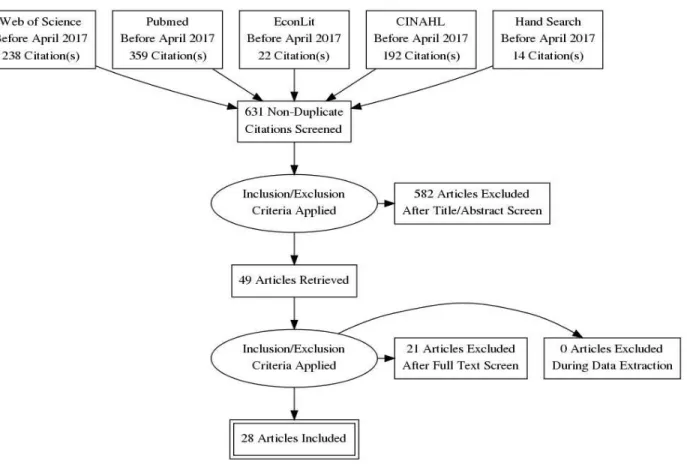
The structured literature search yielded 631 unique citations after deduplication. Following a review of the abstracts of all 631articles, 49 were deemed eligible for full text review. After full text review, an additional 21 studies were excluded for failing to meet the study search criteria. A total of 28 studies were then utilized in the final review. The flow chart of study selection
(Preferred Reporting Items for Systematic Reviews and Meta-Analyses [PRISMA] diagram) is included here as Figure 5.
Study Characteristics
The results of this structured review (2007–2017) provide insight into both the procedural means and situational assumptions driving estimation of the costs of AEs associated with oncologic therapy. The studies reviewed here employed one of two general approaches:
estimation of the total cost of a therapeutic regime (drug costs, clinical visit costs, adverse effect costs, etc.) or assessment of the cost of one or more specific AEs associated with a designated cancer therapy. These studies used a variety of approaches to calculate costs, including probabilistic models representing transition between different treatment/health states,
retrospective cost estimations, and/or prospective data collection and cost estimation. The studies covered a broad range of therapeutic drug classes, cancer types, and patient populations. Per the inclusion criteria, all studies included cost estimates and assumptions that were designed to be reflective of a U.S.-based patient population and U.S. medical and insurance practices. This review will not compare the absolute value of reported costs across studies because of the variable drugs, study designs, timescales, and patient populations assessed.
With the exception of one prospective cohort study (Haiderali, Menditto, Good, Teitelbaum, & Wegner, 2011), all studies reviewed here relied upon previously published clinical
synthesis of the treatment of these issues across the literature follows below and in Tables 4A– 4E. Collectively, these three data elements create a picture of their approaches to assessing the economic impact of cancer treatment-related AEs.
Cost Assessment Methodologies and Data Sources
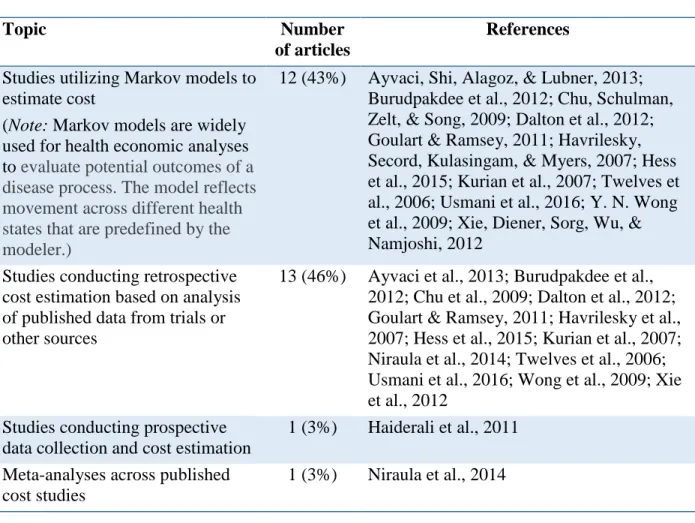
A review of the cost assessment methodologies and data sources is included here as Table 4A. Although all articles included in this review incorporated cost assessment of treatment-related AEs, the primary objective of the studies varied. Some sought to model or predict the total cost burden associated with a specific oncologic therapy, while others focused primarily on characterizing the frequency and cost of one or more treatment-related AEs. There was an almost even split (43%/46%) between the 26 articles that employed mathematical modeling approaches, primarily Markov models, and those that conducted retrospective total cost estimations based on published data from clinical trials and the literature. Markov models are stochastic or
probabilistic models that characterize relationships between different states (e.g., disease state 1, disease state 2, disease free, dead) based on the probability of moving from one state to another. Of the remaining 2 of 28 papers, one employed a prospective cost assessment involving real-time data on incidence and costs and the other was a meta-analysis of published cost studies
TABLE 4A: Cost assessment methodologies
Topic Number
of articles
References
Studies utilizing Markov models to estimate cost
(Note: Markov models are widely used for health economic analyses to evaluate potential outcomes of a disease process. The model reflects movement across different health states that are predefined by the modeler.)
12 (43%) Ayvaci, Shi, Alagoz, & Lubner, 2013; Burudpakdee et al., 2012; Chu, Schulman, Zelt, & Song, 2009; Dalton et al., 2012; Goulart & Ramsey, 2011; Havrilesky, Secord, Kulasingam, & Myers, 2007; Hess et al., 2015; Kurian et al., 2007; Twelves et al., 2006; Usmani et al., 2016; Y. N. Wong et al., 2009; Xie, Diener, Sorg, Wu, & Namjoshi, 2012
Studies conducting retrospective cost estimation based on analysis of published data from trials or other sources
13 (46%) Ayvaci et al., 2013; Burudpakdee et al., 2012; Chu et al., 2009; Dalton et al., 2012; Goulart & Ramsey, 2011; Havrilesky et al., 2007; Hess et al., 2015; Kurian et al., 2007; Niraula et al., 2014; Twelves et al., 2006; Usmani et al., 2016; Wong et al., 2009; Xie et al., 2012
Studies conducting prospective data collection and cost estimation
1 (3%) Haiderali et al., 2011 Meta-analyses across published
cost studies
1 (3%) Niraula et al., 2014
recorded in the HCUP database and the actual cost to the hospital or physician (and in one case, discounted to reflect the differential between the cost to the hospital and the amount billed to the insurer) (Havrilesky et al., 2007). The remaining seven articles (26%) drew data on cost from other published studies. The underlying source of data in these cited studies was not assessed for purposes of this review but is anticipated to have come from the sources above.
TABLE 4B: Defining costs
Topic Number of
articles
References
Studies incorporating “indirect” costs such as time off work, caregiver costs, or lost employment potential
6 (25%) Ayvaci et al., 2013; Bristow et al., 2007; Haiderali et al., 2011; Kurian et al., 2007; Sorensen et al., 2012; Tina Shih, Xu, & Elting, 2007;
Studies utilizing Medicare as a proxy for cost data for drugs and services required to treat an adverse event
11 (41%) Ayvaci et al., 2013; Bajaj, Veenstra, Goertz, & Carlson, 2014; Bilir et al., 2016; Goldstein et al., 2014, 2016; Goulart & Ramsey, 2011; Haiderali et al., 2011; Hess et al., 2015; Rajan, Carpenter, Stearns, & Lyman, 2013; Wong et al., 2009; Xie et al., 2012
Studies utilizing prior peer-reviewed studies as a proxy for cost data for drugs and services required to treat an adverse event
6 (22%) Dalton et al., 2012; Kurian et al., 2007; Niraula et al., 2014; Ting et al., 2015; Twelves et al., 2006; Usmani et al., 2016
Studies utilizing private healthcare or state
healthcare costs to estimate fees regarding adverse events
7 (26%) Bristow et al., 2007; Burke, Wisniewski, & Ernst, 2011; Chu et al., 2009; Craver et al., 2011; Sorensen et al., 2012; Stopeck et al., 2012; Tina Shih et al., 2007
Studies using the Healthcare Cost and Utilization Project to estimate costs associated with adverse events
4 (15%) Burudpakdee et al., 2012; Delea, Amdahl, Diaz, Nakhaipour, & Hackshaw, 2015; Havrilesky, Chino, & Myers, 2013; Kowal-Podmore, Munakata, Tencer, & Smith, 2008
their modeled or cumulative cost assessments. Ninety-five percent of these studies (20 of 21) also included the cost of prescribed drugs (to treat the AE) in their estimation and/or the cost of over-the-counter drugs. Only one of these 21 studies (~5%) limited their analysis to direct hospital/physician fees (Burke et al., 2011). A significantly smaller percentage of the studies (25%, n=6) also included a valuation of “indirect” costs such as lost wages for time off work, caregiver costs, lost future employment potential, and so forth. The assumptions around the impact of the AE on lost worktime were variable but hourly wage rates and compensation data were consistently drawn from the U.S. Bureau of Labor Statistics.
The representation of the cost assessment varied across the studies and included calculation of additional QALYs relative to total treatment cost, incremental cost to avoid a particular AE, total accumulated costs during a given treatment period (primary treatment costs and AE-related costs), total accumulated costs to treat AE only, and costs per progression-free life-year (PFLY). Defining and Quantifying Adverse Events
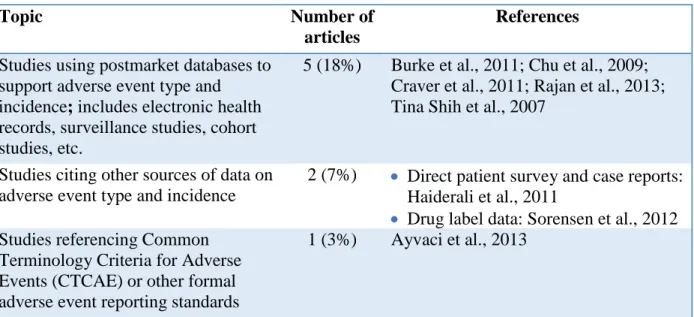
TABLE 4C: Nature/frequency of treatment-related adverse events
Topic Number of
articles
References
Studies using postmarket databases to support adverse event type and incidence; includes electronic health records, surveillance studies, cohort studies, etc.
5 (18%) Burke et al., 2011; Chu et al., 2009; Craver et al., 2011; Rajan et al., 2013; Tina Shih et al., 2007
Studies citing other sources of data on adverse event type and incidence
2 (7%) • Direct patient survey and case reports: Haiderali et al., 2011
• Drug label data: Sorensen et al., 2012 Studies referencing Common
Terminology Criteria for Adverse Events (CTCAE) or other formal adverse event reporting standards
1 (3%) Ayvaci et al., 2013
RCTs from Phase II, III, and/or IV were the predominant source of data (75%, n=21) on the frequency and nature of the AEs incorporated into these cost evaluation studies. Of those studies utilizing clinical trials, 76% (n=21) incorporated only those AEs that were reported as a grade 3 or grade 4. Only 1 of 29 studies identified in this review made any direct reference to the specific ontological criteria used to define the grading in their studies (e.g., Common Terminology Criteria for Adverse Effects [CTCAE]) (Ayvaci, Shi, Alagoz, & Lubner, 2013). The CTCAE was initially developed by the NCI CTEP in 1983 and has been continually updated to include additional AE ontologies and severity grades (Chen & Setser, 2008). The remaining studies that referenced RCTs either did not fully specify the AE inclusion criteria or incorporated all reported AEs.
AEs in clinical practice.) ICD codes were also used to classify adverse effects in the one study that collected prospective data for the evaluation of treatment-related AEs via direct reporting from participating clinicians and patient surveys (Haiderali et al., 2011). One study utilized treatment label data as the source of information for adverse effect frequency and type (Sorensen et al., 2012). In addition to incorporation of AEs as measured by CTCAE or ICD reports, the impact of treatment-related AEs on patient QoL may also be considered in the risk:benefit assessment of therapeutic approaches. The evaluation of QoL impacts can be a complicated and subjective process. Existing and rapidly evolving survey tools include Patient-Reported Outcome Common Terminology Criteria for Adverse Events (PRO-CTCAE) and EuroQol-5D surveys (EuroQol, 2017; NCI, 2017b). These tools seek to incorporate patient perspective on the impact of therapy on endpoints such as pain, self-care, mobility, and so forth. Per Table 4D, only one of the 28 studies identified in this review incorporated direct measures of QoL into the cost
assessment (Haiderali et al., 2011) via surveys of participating patients. However, 39% of the studies (n=11) included “utility factors” in their Markov models. These utility factors incorporate QoL-related adjustments relative to the different health conditions in the models. These
TABLE 4D: Incorporation of “quality of life”
Topic Number
of articles
References
Studies incorporating quality of life via the use of “utility factors” derived from prior literature
11 (33%) Ayvaci et al., 2013; Bristow et al., 2007; Delea et al., 2015; Goldstein et al., 2014; Goulart & Ramsey, 2011; Havrilesky et al., 2007; Kurian et al., 2007; Manolio et al., 2013; Stopeck et al., 2012; Ting et al., 2015; Usmani et al., 2016 Studies incorporating measures
of quality of life based on de novo measures by investigator
1 (3%) Haiderali et al., 2011
Defining Patient Populations
The utility of the study predictions to inform future treatment decisions requires a clear definition of not only the cancer type and therapy but also the patient population demographics. In the reviewed studies, 21% (n=6) focused their cost and AE predictions on populations older than age 60 years, 46% reported results of relevance to patients older than age 18, and 32% did not specify the age demographic of the study predictions (Table 4E).
TABLE 4E: Defining the population
Topic Number
of articles
References
Defines target population of the model/analysis as a patients age 60 or older
6 (21%) Ayvaci et al., 2013; Chu et al., 2009; Goulart & Ramsey, 2011; Havrilesky et al., 2007; Rajan et al., 2013; Ting et al., 2015
Studies
modeling/describing patient populations of various ages
13 (46%) Bajaj et al., 2014; Bilir et al., 2016; Burke et al., 2011; Craver et al., 2011; Goldstein et al., 2014, 2016; Haiderali et al., 2011; Hess et al., 2015; Kurian et al., 2007; Niraula et al., 2014; Sorensen et al., 2012; Tina Shih et al., 2007; Twelves et al., 2006 Studies in which study
population/relevant population ages are not described
9 (32%) Bristow et al., 2007; Burudpakdee et al., 2012; Dalton et al., 2012; Delea et al., 2015;
Limitations of This Review
This review has a number of limitations. Because this review sought to assess impact in a U.S. healthcare context, economically based health technology assessments (HTAs) as required in Europe and several other regions to assess the cost-benefit of novel therapies were not incorporated. HTA studies are numerous and relatively standardized in their approaches and assumptions. Although HTAs relate only to single-payer healthcare systems that do not match the current U.S. multipayer profile, they could provide potentially useful sources for
of the typical U.S.-based drug safety assessment. Further discussion of the linkages between economic-driven AE value approaches and integrative value frameworks for informing cancer care will follow in the discussion section below.
Literature Review 2: Current Practice in and Expert Perspectives on the Use of Adverse
Events in Value Frameworks
Since the publication of the ASCO Value Framework, the ESMO Magnitude of Clinical Benefit Scale, the ICER Value Assessment Framework, the MSKCC DrugAbacus, and the NCCN Evidence Blocks (ESMO, 2017; ICER, 2017; MSKCC, 2017; NCCN, 2017b; Schnipper et al., 2016), multiple organizations and experts have published commentaries on or critiques of the frameworks. These comparisons have focused primarily on a) the construct of the
framework, b) the ease of use of the framework, and/or c) the utility and relevance of the output. This review builds on prior evaluations with a collective synthesis of recommendations for future improvement of the frameworks as they relate to sourcing and interpreting framework input data—particularly AE and/or patient-reported outcome (PRO) data. This review addresses the following question: What recommendations have been promoted to improve the quality and/or relevance of AE-related input data for value frameworks?
TABLE 5: Search strategy
No date limitations: search conducted July 2, 2017
Concept Key words, search terms
Cancer focus “Cancer” or “oncology” AND
Value frameworks “value framework” AND
Adverse effects from therapy
“safety” or “toxicity” or “adverse effect” or “adverse event” or “toxicities”
The inclusion and exclusion criteria are described in Table 6. The search strategy parallels that of the prior review.
TABLE 6: Inclusion/exclusion criteria
Inclusion criteria Exclusion criteria
• Studies that provide analysis or assessment of one or more
comprehensive “value framework(s)” or an equivalent approach to integrate adverse event evaluation into an overall pharmacologic intervention to treat cancer
• Primary/seminal framework references were excluded
• Qualitative and quantitative studies • Studies not using adverse event and/or safety data to assess cancer treatment interventions and decision making
• Descriptive and analytical studies • Article is older than 2012 • Peer-reviewed studies • Studies not in English
• Studies relating to frameworks for assessing risk to environmental carcinogens or exposures • Meeting reports and non–peer-reviewed studies
FIGURE 6: PRISMA diagram demonstrating the part II literature evaluation and exclusion process
This review captures recommendations and perspectives from a total of 17 peer-reviewed publications. The reviewed studies were almost evenly split between those including a narrative/qualitative comparison of different frameworks and those incorporating case
study/quantitative comparisons across different value frameworks. As detailed in Table 7, 47% (n=8) included a narrative comparison across two or more different frameworks and 35% (n=6) conducted quantitative or semiquantitative case study comparisons across two or more
reapply the data and rerun the framework (Cohen, Anderson, & Neumann, 2017; Del Paggio, 2017; Shah-Manek, Galanto, Nguyen, & Ignoffo, 2017). The remaining four publications addressed either a single framework or a single element of the frameworks (e.g., use of toxicity data) (Jim & McLeod, 2017; Miller et al., 2017; Waldeck, Botteman, White, & van Hout, 2017; Yu, 2016). With limited exceptions, all studies provided perspectives on opportunities to
improve either the construct of the framework or some aspect of the input data. The most
common identified areas for improvement, in relation to the nature and quality of input data used to populate these frameworks, fell into eight categories described in Table 8.
TABLE 7: Study designs
Study design Number of
articles
References
Publications with narrative comparisons of different frameworks
8 of 17 (47%) Allen et al., 2017; Basch, 2016; Chandra et al., 2016; Evans, Cheung, & Chan, 2017; Mandelblatt, Ramsey, Lieu, & Phelps, 2017; Neugut et al., 2016; Schnipper & Bastian, 2016; Subramanian & Schorr, 2016 Publications with case
study-based quantitative comparisons across different frameworks
6 of 17 (35%) Bentley et al., 2017; Booth & Del Paggio, 2017; Cohen et al., 2017; Del Paggio, 2017; Shah-Manek et al., 2017; Westrich, Buelt, & Dubois, 2017
Studies that reran analyses prospectively using
published data to populate value frameworks
3 of 6 (50%) Cohen et al., 2017; Del Paggio, 2017; Shah-Manek et al., 2017
Studies that addressed either a single framework or a single element of framework inputs
TABLE 8: Proposals for improvement of inputs to existing framework
Suggested improvement Number of
articles
References
Need improvements to clinical trial design to obtain more patient-relevant data
5 of 17 Allen et al., 2017; Bentley et al., 2017; Booth & Del Paggio, 2017; Del Paggio et al., 2017; Jim & McLeod, 2017 Need cost data that reflect full
cost of care/treatment (not just drug costs)
5 of 17 Chandra et al., 2016; Del Paggio, 2017; Mandelblatt et al., 2017; Miller & Aplenc, 2017; Waldeck et al., 2017 Frameworks should incorporate
patient-reported outcome data (via inclusion of patient-reported outcomes in clinical trials)
4 of 17 Basch, 2016; Bentley et al., 2017; Del Paggio, 2017; Jim & McLeod, 2017
Frameworks should incorporate data from sources other than clinical trials (e.g., observational studies)
3 Allen et al., 2017; Basch, 2016; Chandra et al., 2016
Frameworks should incorporate more robust and/or detailed safety and/or toxicity data
6 Basch, 2016; Chandra et al., 2016; Del Paggio, 2017; Jim & McLeod, 2017; Mandelblatt et al., 2017; Miller & Aplenc, 2017
Frameworks should use integrated quality of life measures in lieu of safety data
1 Waldeck et al., 2017
Frameworks should incorporate more longitudinal data
2 Allen et al., 2017; Basch, 2016 Frameworks should engage
patients in the data evaluation and input process
3 Allen et al., 2017; Basch, 2016; Booth & Del Paggio, 2017
FIGURE 7: Summary of recommendations from literature review for improving adverse event data relevance in value frameworks
Additionally, several studies called for more overarching changes to clinical trial design with regard to patient inclusion criteria, duration, outcomes measures, and so forth (Allen et al., 2017; Bentley et al., 2017; Booth & Del Paggio, 2017; Del Paggio et al., 2017; Jim & McLeod, 2017). The details of such modifications were not thoroughly addressed in these publications and are the subject of much discussion elsewhere, but they could have significant impact on the type of AE data generated in the future (Bhatt & Mehta, 2016).
Although not the focus of this review, it is important to note that many of the publications also called for broad-based improvements in the design or use of the frameworks themselves. Specifically, enhanced clarity and transparency as to the intended audience for the framework outputs (Basch, 2016; Booth & Del Paggio, 2017; Chandra et al., 2016; Cohen et al., 2017; Waldeck et al., 2017) and improved guidance to enhance reproducibility were common
Synthesis of Results of Literature Evaluations
Characterizing the risk:benefit profile of an antineoplastic therapy requires integration of a complex and heterogenous mix of pharmacologic, economic, actuarial, ethical, and sociologic factors. The complementary literature searches described here illustrate progress toward this integration. However, with respect to use and integration of AE information, several common themes and areas for improvement were identified. These areas of commonality are discussed in detail below and will be used to inform the subsequent research aims of this study.
Challenges in Use of Clinician-Reported Adverse Event Data Derived From Randomized
Controlled Trials
In both the purely economic and integrated value framework approaches reviewed here, Phase II–III RCTs serve as the primary source of data on the incidence of treatment-related adverse effects. Almost 80% of the cost studies and/or value framework approaches currently rely heavily or exclusively on RCT data to inform toxicity/safety. RCTs are accepted, well-controlled studies with defined inclusion criteria and dosing and monitoring strategies. However, many of the studies reviewed here noted the limitations of RCTs for purposes of providing pragmatic patient decision support (i.e., high internal validity but low external validity). These limitations include the following:
• Populations engaged in RCTs tend to be “healthier” and with fewer comorbidities than the average patient population on the therapy (Martin et al., 2004). The frequency and severity of AEs in the clinical trial population may be
• The type of AEs recorded in Phase II/III trials specifically have been reported to skew toward a focus on only high-grade (grade 3 or 4) toxicities, pool toxicities of varying severity, include both quantitative and qualitative evaluations, and/or misgrade toxicities (Peron, Maillet, Gan, Chen, & You, 2013; Zhang et al., 2016b). Thus, it is possible that a significant pool of AE data could have been systematically excluded from these evaluations. Even when lower-grade toxicities are reported in RCTs, this review demonstrates an almost exclusive (~80%) use of the high-grade AE data for purposes of cost modeling or in value frameworks. The ASCO framework was recently revised to allow for incorporation of grade 1 and 2 AEs if they occur at sufficient frequency (Lowell E Schnipper et al., 2016). Given the tendency to under-report low-grade AEs in trials and published concerns about “unclear under-reporting of lower-grade toxicities,” the potential for these endpoints to usefully inform
patient/clinician choice via integrative tools is limited at present (Miller et al., 2016; Shah-Manek et al., 2017; Zhang et al., 2016a).
• The timeframe of study in an RCT provides a limited window (months to ~4 years) for capture of treatment-related effects. Some AEs do not manifest for many years after the closure of therapy and/or persist for many years after therapy has been completed. As such, RCTs may provide an incomplete picture of impact. • The evolving nature of the CTCAE ontology used to record and grade creates a
treatment-related AEs (e.g., rheumatology) have developed their own AE ontologies and grades to reflect the more nuanced perspective of a specialist (Calabrese, Kirchner, Kontzias, Velcheti, & Calabrese, 2017). Future AE incidence burden evaluations would benefit from a thorough characterization of the ontological and inclusion/exclusion
framework that guided the capture of their core input data and its potential impact on outcomes.
• RCTs are designed for evaluation by regulatory scientists for purposes of drug approval decision making. These studies have not been designed to generate
information to be used by clinicians or patients with regard to individual therapeutic or supportive care pathways.
Alternatives to the Use of Clinician-Reported Adverse Event Data Derived From Randomized Controlled Trials
Although of many of the studies reviewed here identified one or more shortcomings of RCT-derived AE data, only three (17%) of the reviewed publications on value frameworks proposed the future incorporation of data from sources outside of an RCT setting (Allen et al., 2017; Basch, 2016; Chandra et al., 2016). Similarly, only 18% of the cost models used data sources outside of RCTs for AEs (Burke et al., 2011; Chu et al., 2009; Craver et al., 2011; Rajan et al., 2013; Tina Shih et al., 2007). This trend points to a simple fact: while it is relatively easy to identify weaknesses in the RCT as a data source for informing patient value-choices, the identification of viable alternatives or complements is quite challenging.
Patient-Reported Outcomes and Quality of Life Metrics
As patients and clinicians seek both enhanced progression-free survival as well as positive QoL, the inclusion of PRO data and/or QoL metrics into the valuation (economic or otherwise) of antineoplastic therapy regimes has gained prominence in recent years. The sources of data on QoL in the studies in this review included Markov model-based utility factors derived from EuroQol 5-D surveys, direct patient surveys that collected data on quality metrics, and clinician judgement on impact of patient QoL. The ICER and ESMO frameworks include QoL through incorporation of a QALY metric. ASCO uses palliation of symptoms and treatment-free intervals as a proxy for QoL measures. The quality of these input data are uncertain, as some of the QoL adjustment factors used in these economic evaluations were derived from assessments conducted as many as 20 years ago and some included undocumented “value judgements” based on
clinician experience (Delea et al., 2015; Havrilesky et al., 2009; NCCN, 2017b; Stopeck et al., 2012). Additionally, the way in which these data were integrated into the value assessments described in this review varied from probabilistic modeling approaches to awarding of ad hoc “bonus points.” It is beyond the scope of this review to assess the relative strengths and weaknesses of each of these approaches. However, this review does reveal that the practice of including PRO or QoL metrics into integrated value assessments relating AEs and treatment choice is neither systematic nor standardized.
burden of antineoplastic therapy. This is likely to hold true in both the clinical trial and the standard clinical setting.
Increased Use of Observational/Surveillance/Electronic Health Record Data Sets
Collectively, the publications reviewed here offered very limited recommendations for or examples of incorporating AE data from sources other than RCTs. The few prospective or patient database–driven economic evaluation studies in this review appear to provide a clearer picture of the frequency and nature of AEs, although the less controlled setting can make an estimation of treatment-attributable costs more challenging (Burke et al., 2011; Chu et al., 2009; Craver et al., 2011; Rajan et al., 2013; Tina Shih et al., 2007). None of the value frameworks utilize such data at this time. This phenomenon reflects the “gold standard” status of RCTs for driving drug safety and efficacy decisions and lack of standards for use of other data sources. Increasingly, the potential for observational studies and large-scale healthcare databases to provide reliable data on a broad range of patient adherence practices, outcomes measures, and polypharmacy/comorbidity situations has been recognized (Balicer & Afek, 2017; Fiore et al., 2017; Mahajan, 2015). Future developments in this arena will require a thoughtful confrontation of the tension between uncontrolled data derived directly from patient care settings and the value of nuanced and realistic representation of patient experiences.
The Costs
A detailed discussion of cost estimation models is not the focus of this review. However, the link between value decisions, cost calculations, and AE-related impacts is an important
caregiver costs, future employment potential costs, etc.; e.g., Sorensen et al., 2012), whereas others addressed only the primary cost of treating the AE in a hospital setting (Burke et al., 2011). Exact cost metrics used within the current value framework structures were equally variable but are largely restricted to cost of the drug and/or primary treatment visits. Many of the analyses reviewed here specifically recommended that future iterations of the model should incorporate the full cost of care including AEs (Chandra et al., 2016; Del Paggio, 2017;
Mandelblatt et al., 2017; Miller et al., 2017; Waldeck et al., 2017) This recommendation, while sound on its face, begs the questions of what constitutes the burden of antineoplastic therapy-related AEs, who carries these burdens, and thus how broadly should costs be captured? It also speaks to the importance of transparent discussion regarding the stakeholders to whom the value assessment is intended to apply.
The Patients
At the core of all of the value discussions and treatment choices described here are the patients. Somewhat surprisingly, nearly a third of the economic valuation studies reviewed here failed to provide clear demographic information on either the patient population that constituted their input data or the patient population to whom their model/valuation was intended to
metrics, and/or cost estimations. For example, ~40% of the studies reviewed here utilized cost data from Medicare, although only ~20% characterized their study population as older than age 60. Such disconnects may be inevitable given the limited availability of data in this space. However, the relevance of frameworks for information on patient choice and treatment decisions could be enhanced with greater clarity around these limitations and their potential impacts on the way in which AE-related impacts are synthesized and subsequently interpreted.
Summary of Opportunities to Improve the Use of Adverse Events to Inform Care
Decisions2
and attributes that should be incorporated into these assessments. In summary, the collective literature review and analyses conducted here support the following:
• Future initiatives seeking to provide integrated information to patients and clinicians relating to therapeutic choice in cancer settings would benefit from incorporation of AE data of greater relevance to the “real-world” patient experience (i.e., “more patient-relevant information”);
• There is a need for enhanced transparency around the strengths and limitations (i.e., fitness for purpose) of different AE data types to be used to inform cancer care and therapy development/support decisions; and
CHAPTER 3: RESEARCH AIM AND METHODS
As evidenced by the literature evaluation conducted in Chapters 1 and 2, there are significant challenges associated with contemporary processes and incentives for AE and QoL data generation, dissemination, and use for cancer care decision making. However, “cancer care” is an incredibly broad and heterogenous arena. We know that the specific timescales, networks, and incentives for developing or using therapy-related AE or QoL information can vary significantly depending on a patient’s overall prognosis (e.g., metastatic versus adjuvant) and anticipated duration of therapy (Allen et al., 2017). Patient preferences, clinician recommendations, and regulatory requirements for information around trade-offs between length of life and QoL also vary in different cancer treatment settings (Meropol et al., 2008). An evaluation of systemic opportunities for improved AE data utilization must both acknowledge critical contextual distinctions and recognize that some elements of systemic change could benefit a broad range of settings.
This study recognizes the importance of context by conducting a focused exploration of the roles, expectations, and information flows across stakeholders involved in the adjuvant therapy setting. Adjuvant therapies are defined by the NCI as “treatment given after the primary
related AEs relative to an uncertain potential for tumor recurrence can be extremely challenging. Information about adjuvant-related AE frequency, scope, control, and support options can be reasonably expected to have a real impact on outcomes such as the decision to initiate or maintain adjuvant treatment, therapeutic adherence, patient health, QoL, and/or ability to fulfill tasks during daily living (Meropol et al., 2008). Because of these important impacts, a study of the incentives and barriers to generating and using AE information linked to adjuvant therapy was selected as the focus for this research. This study does not specifically explore differences between different cancer types treated with adjuvant therapy, or different therapeutic classes of adjuvants. For purposes of this exploratory study, perspectives on the integration of evidence around treatment benefits and risks that are common across the adjuvant setting at large are informative. As discussed in Chapter 5 (“Cross-Stakeholder Results and Discussion”), some observations from this study of the adjuvant arena also have relevance in the acute treatment setting and the long-term survivorship arena.
Specifically, this study explored the following aims:
• Primary aim: Utilize qualitative interviews to understand and integrate key stakeholder perspectives on current and future roles as developers and/or users of adjuvant therapy-related AE information for cancer care decision making.
• Sub-aim 1: Understand the perceived roles that therapy developers,
regulators, clinicians (oncologists and non-oncologists), patient advocates, and payers (“the stakeholders”) play in adjuvant therapy-related data generation, dissemination, and use, and how these stakeholders are affected by incentives and available resources.