ISSN: 2230-7346 Available online http://WWW.JGTPS.COM
Research Article Journal of Global Trends in Pharmaceutical Sciences
Vol.2, Issue 2, pp -118-130,April-June 2011 DEVELOPMENT AND VALIDATION OF SPECTROPHOTOMETERIC
METHOD FOR ESTIMATION OF EZETIMIBE IN TABLET FORMULATION
Y.PradeepKumar1*, C. Sridhar1, A. Sivarami Reddy1, L.Sivasankar Reddy1, M. Madhu2, Y.Hrushikesh reddy2.
1. Creative Educational Society’s College of Pharmacy, N.H 7, Chinnatekur, Kurnool-518 218, Andhra Pradesh, India.
2. Annamacharya college of Pharmacy, New Boyanapalli, Rajampet-516 216, Kadapa.
*Corresponding Author E-Mail: [email protected]
ABSTRACT
A versatile, accurate, precise and economic method for determination of ezetimibe products was developed. The absorbance value at 745nm of over line spectrum was used for the estimation of ezetimibe, respectively without mutual interference. This method obeyed Beer’s law in the concentration range of 10 μg /ml for ezetimibe. The results of analysis have been validated statistically for linearity, accuracy and precision of the proposed method.
Keywords: Ezetimibe (EZE), Methanol, Ultraviolet Spectrophotometry, Absorption ratio
Method.INTRODUCTION:
Ezetimibe is the first lipid-lowering drug that inhibits intestinal uptake of dietary and biliary cholesterol. Ezetimibe was originally discovered by a team of four Schering-Plough research chemists: Drs. Stuart B.
Rosenblum, Duane A. Burnett, John W. Clader and Brian A. McKittrick. It was approved by the FDA in October 2002 for
hypercholesterolemia (elevated blood
Since then, the use of ezetimibe has increased, especially in the United States
and is chemically 1-(4- fluorophenyl)-(3R)-[3-(4 fluorophenyl) - 3S)-hydroxyphenyl]-4S-(4-hydroxyphenyl)-2-azetidinone.It is not official in any pharmacopoeia. HPLC(1) and LC-MS (2) methods have been reported for the estimation of EZE in pharmaceutical formulations and in plasma. Also, HPLC(3,
4), methods were reported for the estimation
of EZE in tablet dosage form. The review of literature revealed that no method is reported for the estimation of EZE in fixed dose products by UV spectrophotometry. The present research describes a simple, rapid, accurate and reproducible method for the estimation of EZE in tablet formulation by Absorption ratio method.
EXPERIMENTAL WORK:
Pharmaceutical grade of Ezetimibe were kindly supplied as gift sample by Aurobindo Pharmaceuticals pvt.ltd. Methanol (AR grade),Deionised water, Folin-Ciocalteu reagent (a mixture of Phosphomolybdate and Phosphotungstate),Sodium carbonate were
all of analytical grade and used without any further processing. The marketed formulations were purchased from local market (Lupin Laboratories) were obtained from retail pharmacies.
Equipments:
Double beam UV-Visible Spectrophotometer-ELICO SL 164 with two matched cuvette cells of one cm light path were used for the measurement of
absorbance. Electronic Dhona Balance 200D was used for weighing the samples. Class ‘A’ volumetric glassware were used.
PROCEDURE:
UV SPECTROPHOTOMETRIC METHODS FOR DETERMINATION OF EZETIMIBE
:
Selection of Solvent(6)
The solvent was selected by determining the solubility of ezetimibe in various solvents namely Distilled water, Hydrochloric Acid, Sodium Hydroxide Solution, Methanol.
Preparation of standard stock solution: An accurately weighed quantity of about 4.09 mg Ezetimibe was taken in a 100 ml volumetric flask and was dissolved in
methanol. The volume was made upto mark with methanol to get the concentration of 40.9mcg/ml.
Study of spectra:
The aliquot portion of standard stock solution of Ezetimibe was diluted appropriately with methanol obtaining concentration 10 µg/ml. Solution was taken
in 1 cm cell and scanned in the range 180 nm to 400 nm and spectrum was recorder as showed in Fig1.
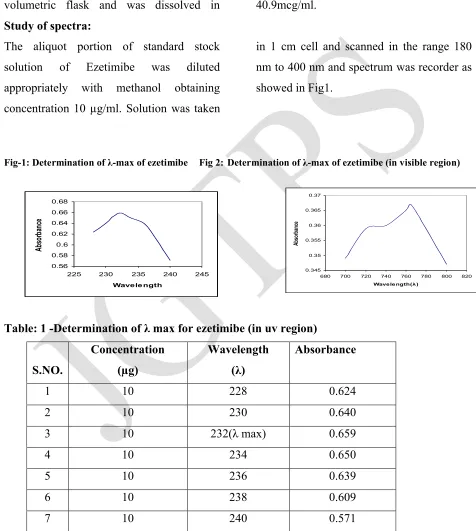
Fig-1: Determination of λ-max of ezetimibe Fig 2:Determination of λ-max of ezetimibe (in visible region)
Table: 1-Determination of λ max for ezetimibe (in uv region)
S.NO. Concentration (µg) Wavelength (λ) Absorbance
1 10 228 0.624
2 10 230 0.640
3 10 232(λ max) 0.659
4 10 234 0.650
5 10 236 0.639
6 10 238 0.609
7 10 240 0.571
0.56 0.58 0.6 0.62 0.64 0.66 0.68
225 230 235 240 245
Wavele ngth Ab so rb an ce 0.345 0.35 0.355 0.36 0.365 0.37
680 700 720 740 760 780 800 820
Study of spectra and selection of wavelength:
The aliquot portion of standard stock solution of Ezetimibe was diluted appropriately with methanol obtaining a concentration of 40µg/ml, Then one ml of this solution was diluted with 10 ml of water and 1.5 ml of Folin-Ciocalteu reagent(5) ( Phenolic reagent) was added, this solution was kept aside for 5 minutes and 4 ml of
20% of sodium carbonate was added to it and then the solution was made upto 25 ml with water and incubated for 30minutes, this Solution was taken in 1 cm cell and scanned in the range 380 nm to 800 nm using similarly prepared blank and spectrum was recorded as showed in Fig:2.
Table: 2 scanningof (λ) max of ezetimibe(in visible region)
S.NO Concentration
(µg)
Wavelength
(λ)
Absorbance
1 40 700 0.349
2 40 720 0.359
3 40 740 0.360
4 40 760 0.365
5 40 765(λ max) 0.367
6 40 780 0.359
7 40 800 0.349
UV spectrum of Ezetimibe:
The λmax of Ezetimibe was
found to be at 765nm (in visible region).
Hence the estimation of ezetimibe was done at its λmax i.e. 765nm.
Study of Beer-Lambert’s law(7):
Accurately measured aliquot of standard stock solution ranging from 0.25 ml to 1ml (Concentration range of 100-400 µg/m) were taken in series of 25 ml volumetric flasks, diluted with 10 ml of water and 1.5 ml of Folin-Ciocalteu reagent (phenolic
absorbance of each solution was measured at 765 nm against blank. Table: 3 observations of optical densities of concentration of µg/ml.
S.NO Concentration (µg/ml) Absorbance
1 100 0.125
2 150 0.152
3 200 0.181
4 250 0.215
5 300 0.252
6 350 0.288
7 400 0.292
Fig 3: Plot of Beer-Lambert’s for Ezetimibe
Determination of E (1%, 1cm) values of drug at selected wavelength(8): An accurately weighed quantity of
about 10mg Ezetimibe was transferred to a 100 ml volumetric flask dissolved in methanol and diluted upto the mark. The 1 ml of this solution of Ezetimibe was diluted
appropriately with methanol to obtain concentration of 10 µg/ml. absorbance of final dilution was measured at 765 nm and E (1%, 1cm) values was calculated by using formula
.
E (1%, 1cm) = Absorbance Concentration in g/100ml
Table no. 4: Observation and results of E(1%,1cm)
S.No. Concentration(g/100ml) Absorbance E(1%,1cm)
1 0.0010 0.070 70
2 0.0010 0.072 72
3 0.0010 0.072 72
4 0.0010 0.072 72
5 0.0010 0.073 73
Application of proposed method to the marketed formulation: Preparation of the sample solution:
About 20 tablets each tablet contains 10 mg of ezetimibe were weighed and thoroughly powdered. The amount of powder equivalent to about 10 mg was added to 10 ml of methanol and is stirred on magnetic stirrer for 5 minutes and again add 10 ml of methanol to it and allow for mixing on the magnetic stirrer, allow the mixture to centrifugation at 1000 rpm for 5 minutes
collect the supernatant and fill it into the 100 ml volumetric flask through whatman filter paper 40, wash the residue thrice with methanol and add the filtrate to the volumetric flask and make up the volume to 100 ml with methanol. Absorbance of standard solution and sample solution (350µg) was measured at 765 nm.
Table No.5: Observation of optical density for ezetimibe formulation (10 mg) Brand Name: Ezedoc-10 mg Average weight: 0.1262 gm.
S.no: Wt of std.(mg)
Wt.of Sample.(mg) Absorbance of std.
Absorbance of Sample
1 100 126.2 0.659 0.268
2 100 126.2 0.656 0.270
3 100 126.2 0.658 0.280
4 100 126.2 0.658 0.268
Estimation of ezetimibe using A (1%, 1cm)
A (unknown) x D Concentration (g/100ml)= A (1%, 1cm) Where, A(unknown) = Absorbance of unknown D = Dilution factor
A(1%,1cm) = 72
Further % label claimed was determined using the formula:
Amount estimated in Avg.wt.of tablet
%label claim= --- --- x 100 Label claim
Table No.6:- Results of estimation of ezetimibe for marketed formulation Brand name:-Ezedoc-10 mg Average weight:- 0.1262 gm
S.no: Weight taken (mg)
Absorbance at
765 nm % Label claim
1 126.2 0.268 93%
2 126.2 0.270 93.75%
3 126.2 0.280 97.22%
4 126.2 0.268 93%
5 126.2 0.269 93.4%
Recovery studies: Standard solution:
Standard solution was prepared in the similar way as in the estimation for marketed formulation. Accurately weighed quantity of pre-analyzed tablet power equivalent to 10 mg of Ezetimibe was taken in a 100 ml volumetric flask and 350 µg of pure Ezetimibe was added to it. Then
Table No 7: Results of recovery studies
Brand name: -Ezedoc-10 mg Average weight: -0.1262 gm S.no Concentration of
power taken(µg) Weight of pure drug added (µg)
% recovery
1 350 280 99.2
2 350 350 99.5
3 350 420 102
Validation of proposed method(9):
Ruggedness:The studies on ruggedness were carried out under two different conditions: Days and Analyst
Intraday:
It was performed by using same procedure as under marketed formulation analysis and absorbance recorded at 3 hrs. Interval within a day. The % label claim was
calculated using same formula as for marketed formulation analysis. Results and statistical data are shown in table.
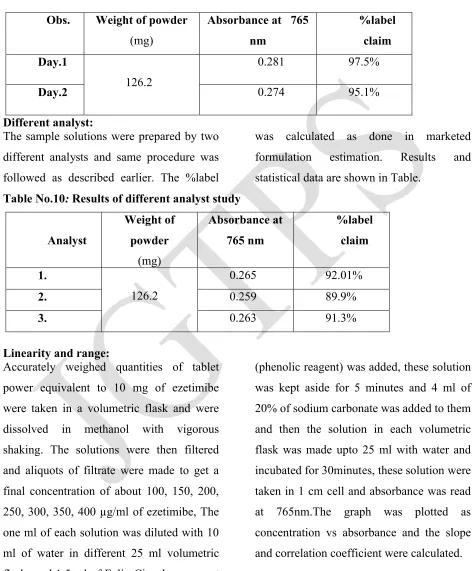
Table No.8: Result and statistical data of intraday study: Obs. Weight of powder
(mg)
Absorbance at 765 nm
%label claim Obs.1
126.2
0.281 97.5%
Obs.2 0.283 98.2%
Obs.3 0.281 97.5%
Results are the mean of three replicates.
Interday (Different days):
Same procedure was performed as under marketed formulation analysis and absorbance of same sample were recorded on different days. The % label claim was
Table No.9: Result and statistical data of interday study:
Obs. Weight of powder (mg)
Absorbance at 765 nm
%label claim Day.1
126.2
0.281 97.5%
Day.2 0.274 95.1%
Different analyst:
The sample solutions were prepared by two different analysts and same procedure was followed as described earlier. The %label
was calculated as done in marketed formulation estimation. Results and statistical data are shown in Table.
Table No.10:Results of different analyst study
Analyst
Weight of powder
(mg)
Absorbance at 765 nm
%label claim
1.
126.2
0.265 92.01%
2. 0.259 89.9%
3. 0.263 91.3%
Linearity and range:
Accurately weighed quantities of tablet power equivalent to 10 mg of ezetimibe were taken in a volumetric flask and were dissolved in methanol with vigorous shaking. The solutions were then filtered and aliquots of filtrate were made to get a final concentration of about 100, 150, 200, 250, 300, 350, 400 µg/ml of ezetimibe, The one ml of each solution was diluted with 10 ml of water in different 25 ml volumetric flasks and 1.5 ml of Folin-Ciocalteu reagent
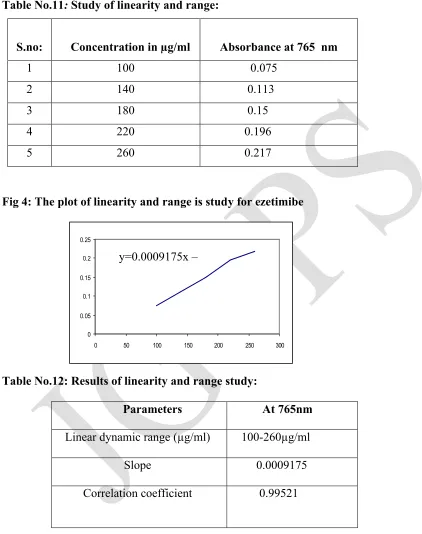
Table No.11:Study of linearity and range:
S.no: Concentration in µg/ml Absorbance at 765 nm
1 100 0.075
2 140 0.113
3 180 0.15
4 220 0.196
5 260 0.217
Fig 4: The plot of linearity and range is study for ezetimibe
Table No.12: Results of linearity and range study:
Parameters At 765nm
Linear dynamic range (µg/ml) 100-260µg/ml
Slope 0.0009175
Correlation coefficient 0.99521
RESULTS AND DISCUSSION:
Determination of λ-max (by visible spectroscopy):
The λ-max of ezetimibe has been determined and was found to be 765nm
0 0.05 0.1 0.15 0.2 0.25
0 50 100 150 200 250 300
Study of Beer’s Lambert’s law:
Different concentrations of ezetimibe solutions were prepared ranging from 100-400µg/ml linearity curve was constructed
and regression coefficient was found to be 0.99521
Determination of E1%1cm:
Application of the present method for the estimation of the Formulation
Ezetimibe formulation (Lupin-10 mg) has been estimated by using the present method and the label claimed was found to be 98.2%
Method validation:
Validation of the developed method was done according to the USP 2006, Asian edition. The method is validated according
to ICH guidelines and all the parameters are within the specified limit.
VALIDATION PARAMETERS:
1 I) Raggudness
a) intraday b)interday
a)0.4 b)1.762
2 Different analyst 1.178 3 Linearity and range 100-400µg/ml
s.no Parameters Result
1 λ-max 765
2 Beer’s Lambert’s plot
100-400µg/ml
CONCLUSION:
Uv-Visible spectrophotometric method for ezetimbe has been developed using methanol and λ-max was found to be 765 nm. Beer’s Lambert’s law has been satisfied at a linearity range of 100-400 µg/ml.E1%1cm was 72. Ezetimibe formulation
(lupin-10mg) has been estimated using the present method and %label claim is 98.2%. The method is validated according to ICH guidelines and all the parameters are within the range.
ACKNOWLEDGEMENT:
The authors are thanks to Aurobindo Pharmaceuticals pvt.ltd. Hyderabad Ltd. for providing Ezetimibe as gift samples for this work.
REFERENCES:
1. Sistla RM, Tata VS, Kashyap YV, Chandrasekar D and Diwan PV. (2005). Development and validation of a reversed phase HPLC method for the determination of ezetimibe in pharmaceutical dosage forms. J. Pharm. Bio. Med. Anal., 39(3-4): 517-522.
2. Kosoglu T, Statkevich P, Yang B, Suresh R and Cutler DL. (2004).Pharmacodynamic interaction between ezetimibe and rosuvastatin. Curr. Med. Res. Opin., 20(8): 1185-1195.Lingeswara.
3. Shivshankar K, Sreekanth N, Harikrishnan N, Roosewelt C, Srinivasarao G and
Gunasekaran V (2007). Validated simultaneous estimation of simvastatin and ezetimibe by RP - HPLC in pure and Pharmaceutical dosage form. Asian. J. Chem., 19(6): 4303-4308
4. Lingeswara Rao Punati, Prasad Rao Srungapathi, Ganesh, M, Saravanan VS, Siva Kumar T. (2006). Simultaneous estimation of simvastatin and ezetimibe in combined dosage forms by RP-HPLC method. Proceedings of the 58th Indian Pharmaceutical Congress, Dec. 1-3 Mumbai, India, p.259.
5. http://www.search.com/reference/Folin-Ciocalteu_reagent.
7. Williams,D.H.,Fleming,I.,In;Spectoscopic Methods in Organic Chemistry,5th Edn.,McGraw Hill Publishers,2004,2.
8. Willard,Merit,Dean,Settle,In;Instrumental Methods of analysis,7th Edn.,CBS Publication,159-164