Max Planck Institute for Demographic Research
Doberaner Strasse 114 · D-18057 Rostock · GERMANY www.demographic-research.org
DEMOGRAPHIC RESEARCH
VOLUME 3, ARTICLE 8
PUBLISHED 17 OCTOBER 2000
www.demographic-research.org/Volumes/Vol3/8/
DOI: 10.4054/DemRes.2000.3.8
Frailty Modelling for Adult and Old Age
Mortality:
The Application of a Modified DeMoivre
Hazard Function to Sex Differentials in
Mortality
Hans-Peter Kohler
Iliana Kohler
Frailty Modelling for Adult and Old Age Mortality: The
Application of a Modi
¿
ed DeMoivre Hazard Function to Sex
Differentials in Mortality
Hans-Peter Kohler1
Iliana Kohler2
Abstract
Unobserved differences in individual’s susceptibility to death are an important aspect in the
anal-ysis of contemporary mortality patterns. However, observed mortality rates at adult ages, which
are usually well-described by a Gompertz curve, are often perceived inconsistent with frailty
mod-els of mortality. We therefore propose a modi¿ed DeMoivre hazard function that is suitable for
the application of frailty models to adult and old ages. The proposed hazard increases faster than
exponential, and when combined with unobserved frailty it can capture a broad range of patterns
encountered in the analysis of adult mortality. Our application to Bulgaria during 1992–93
sug-gests that the stronger selection process in the male population, caused by an overall higher level
of mortality, may constitute a primary mechanism leading to the convergence of male and female
mortality at higher ages. Hence, the convergence between male and female mortality is not
nec-essarily caused by a differential process of aging across sexes, but is merely a consequence of the
different levels of mortality at adult ages.
1Head of Research Group on Social Dynamics and Fertility, Max Planck Institute for Demographic
Re-search, Doberaner Str. 114, 18057 Rostock, Germany. Tel: +49-381-2081-123, Fax: +49-381-2081-423, Email: [email protected], www: http://user.demogr.mpg.de/kohler.
2Ph.D. student at the Max Planck Institute for Demographic Research and the Danish Center for Demographic
1
Introduction
Male mortality exceeds female mortality rates at adult ages in many populations. This female
advantage in survival often diminishes with age, and male and female mortality rates converge at
higher ages [Carey and Judge 2000, Hummer et al. 1998, Manton et al. 1995, Waldron 1985].
Sim-ilar patterns of convergence or mortality cross-overs are also observed between other populations
that are subject to quite different mortality levels at adult, but not necessarily at old and oldest-old
ages [Gavrilov and Gavrilova 1991, Vaupel and Yashin 1985]. Consider for instance the Bulgarian
male and female mortality pattern during 1992–93 in Figure 1(a). The striking aspect of this
mor-tality pattern is on one hand the substantially higher mormor-tality level for males, especially during
adult ages, and on the other hand the differential increase in the force of mortality by age [see also
Kohler 2000a,b]. The mortality sex-ratio in Figure 1(b) shows that males in Bulgaria around age
40 experience a mortality level that is almost 200% higher than that of females. This male-female
difference diminishes to 25% around age 80 and it virtually vanishes at ages above age 90. This
convergence in male and female mortality levels occurs because, despite their mortality-advantage
at adult ages, females in Bulgaria are subject to a substantially more rapid increase in the level
of mortality by age. The life-table aging rate [Carey and Liedo 1995, Horiuchi and Coale 1990],
i.e., the relative increase of the mortality hazard per additional year of age, depicted in Figure 1(b)
shows that the relative increase of female mortality with age is above the relative male
mortal-ity increase at all ages above age 45. [Note 1] In addition to the difference in absolute level, the
life-table aging rate (LAR) reÀects some known sex-speci¿c deviations from the¿tted Gompertz
model in the left graph of Figure 1. In particular, the female life-table aging rate is increasing
between age 40–75, which has been attributed to a post-menopausal mortality increase that is due
to lower evolutionary selection forces at post-reproductive ages [Horiuchi 1997]. After age 75, the
relative increase of mortality by age is declining and the mortality increase by age is slowing down
at these old and oldest-old ages. The female life-table aging rate is thus clearly bell-shaped, while
the male life-table aging rate is increasing, with some minorÀuctuations, up to age 80. Afterwards
the increase of male mortality by age is slowing down similar to the female pattern. Ignoring these
age speci¿c patterns and averaging across the whole age range 40–100 years, female mortality
rates increase by approximately 10.8% per year of age (based on the estimates of the Gompertz
model in Figure 1a), while male mortality rates increase by only 8.25% per year of age. This
dif-ferential increase in mortality by on average 2.5 percentage points implies the strong convergence
between male and female mortality rates at higher ages in Figure 1(a).
mor-age
mu(
x
),
log scale
40 50 60 70 80 90 100
0.001
0.005
0.050
0.500
(a) BG mortality rates, males and females
Males Females
fitted Gompertz model
age male-female mor tality r a tio
40 50 60 70 80 90 100
1.0 1 .5 2.0 2 .5 3.0 3 .5
(b) mortality sex ratio and life-table aging rate (LAR)
sex ratio (M/F) LAR, females LAR, males 0.06 0.07 0.08 0.09 0.10 0.11 0.12
life-table aging rate (LA
R
)
Figure 1: Left graph: Bulgarian mortality rates for males and females in 1992–93. Right graph: Male-female mortality ratio and life-table aging rate (LAR) for males and females in Bulgaria in 1992–93.
tality per year of age is due to a differential aging process between males and females, or whether
this difference can be attributed to a stronger selection of the male population towards low-frailty
individuals that is caused by the higher overall level of male mortality. The knowledge which of
these two factors is primarily responsible for the above convergence pattern is essential for the
development of appropriate theories of aging and mortality change [Carnes et al. 1996, Vaupel and
Yashin 1985]. In the former case, the male-female convergence of mortality is attributed to factors
such as a post-menopausal acceleration of mortality for females [Horiuchi 1997], sex-differences
in metabolism, hormonal levels and other fundamental biological aspects [Hazzard 1986, Hazzard
and Applebaum-Bowden 1989, Waldron 1985], genetic differences related to the female
‘advan-tage’ of having two X chromosomes [Christensen et al. 2000], potential systematic behavioral and
psychological sex-differences in coping with stress and the aging process itself [Baltes et al. 1999],
and age-related social and behavioral changes [House et al. 1990]. In the latter scenario, which
emphasizes the process of differential selection, the higher mortality level for males — especially
at adult ages — implies that the male population is more rapidly selected towards individuals with
selection process between males and females then leads to a slower increase in the observed male
mortality as compared to the female mortality [Vaupel et al. 1979, Vaupel and Yashin 1985]. A
con-vergence in the observed male and female mortality pattern can thus occur even when both sexes
are subject to a mortality curve that differs — conditional on a constant frailty composition —
only by a factor of proportionality. That is, the mortality convergence occurs even if male and
female mortality are characterized by an age pattern that, conditional on the frailty level, exhibits
an identical life-table aging rate and an identical relative increase in the mortality rates with age.
In this selection hypothesis, therefore, the main difference in the ‘law of mortality’ for males and
females is in the level of the mortality risk, i.e., a proportionally higher level of male as compared
to female mortality. Differences in the life-table aging rate and patterns of mortality convergence
between sexes are thus primarily attributed to changes in the frailty composition of population,
instead of fundamental differences in the process of aging itself.
The investigation of whether the above ‘selection hypothesis’ can provide a plausible
explana-tion for the male–female differences in the increase of mortality with age requires the estimaexplana-tion
of mortality models with unobserved frailty. In a seminal analysis, Vaupel, Manton, and Stallard
[1979] have introduced relative frailty models in which individuals in a population are
hetero-geneous with respect to their susceptibility to death. This relative risk of death, denoted by the
frailty5, is unobserved on the individual level. Despite this unobservability, the mortality patterns
can be adjusted for the distortions caused by the selection process due to differential mortality in
heterogeneous populations. In particular, based on assumptions about the initial distribution of
unobserved frailty in the population and its effect on the force of mortality, inferences can be made
about the composition of the population with respect to frailty at some speci¿c age%and the level
of mortality that would have prevailed if there had been no changes in the frailty-composition of
the population over time. Frailty models of mortality therefore allow the investigation of whether
observed mortality patterns can be explained by selection processes within a population, or by
differential selection across subpopulations. For instance, the analyses in this paper focus on the
question of whether frailty models can provide a plausible explanation for the convergence between
male and female mortality in Bulgaria and possibly other countries.
Relative frailty models assume that the mortality rate at age%of a person with frailty5equals
5>E%, where>E%is the mortality rate of individuals with5 ' . Individuals with5 :therefore
experience a force of mortality that is proportionally higher than>E%at all ages, while individuals
with 5 experience proportionally lower mortality rates. The composition of a cohort with
respect to the frailty5 changes as a cohort grows older because the most frail individuals tend to
is therefore determined by two factors: (a) the age-increase in mortality holding frailty constant,
which is reÀected in _%_>E%and (b) the extent to which the cohort at age%becomes selected
to-wards low-frailty individuals, which is reÀected in the distribution of the frailty5in the population
conditional on survival up to age%.
Vaupel et al. [1979] assume a gamma-distributed frailty with meanJ?eand variancej2, and
show that the observed hazard and survival curve at age%, denoted>7E%andr7E%care equal to
7
>E% ' >E%
j2*L}rE% (1)
and
7
rE% ' Ej2*L}rE%3*j2
c (2)
where >E% and rE% are the baseline hazard rate and the survival curve for individuals with a
constant frailty of5 ' . Moreover, the mean frailty57E%of the population who is alive at age%
equals57E% ' 7rE%j2 ' Ej2*L}rE%3, which indicates that the mean frailty of the population
who has survived to some age%decreases as the fraction of survivors to age%declines.
Equations (1) and (2) indicate that the selection process in heterogeneous populations drives a
wedge between the baseline hazard rate>E%c which pertains to individuals with constant frailty
5 ' , and the observed hazard rate >7E%. The extent to which these rates differ depends on
two factors: (a) the variance j2, i.e., the variation in unobserved frailty in the population at the
beginning of the observation period, and (b) the extent to which the population has already been
selected, which is indicated by the survival functionrE%. Moreover, the derivative
_
_%*L} 7>E% ' >E%
>E%
j2>E%
j2*L}rE% (3)
shows that the slope of the observed mortality pattern is also affected by the selection towards
low-frailty individuals in heterogeneous populations. On the one hand, the¿rst term >>E%E% indicates the
relative increase in the force of mortality holding frailty constant at5 ' On the other hand, the
second termj2>E%*Ej2*L}rE%measures the strength of the selection process at age%. This
strength depends on the mortality level>E%, the overall variance of frailty in the population j2
and the mean frailty57E% ' Ej2*L}rE%3of the population who has survived to age%. This
selection process implies that the observed relative increase in the mortality rate% is slower than
increase of the mortality curve by age increases the larger is the¿nal term in equation (3).
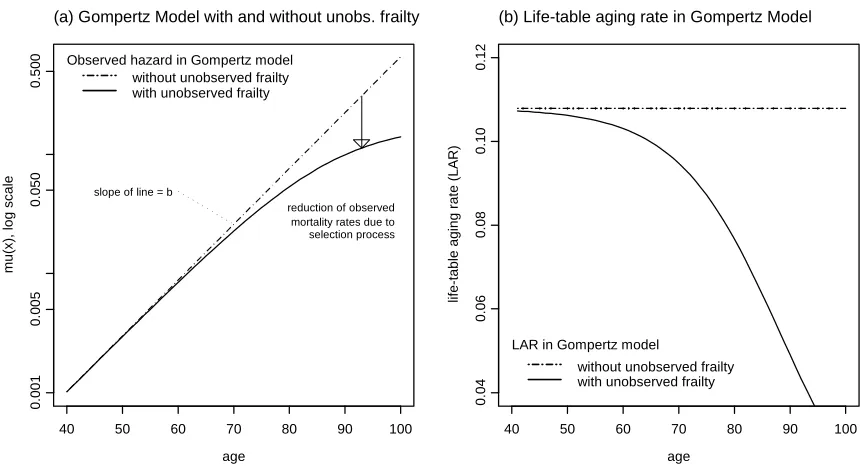
A typical pattern of observed mortality rates, which is implied by the above frailty model, is
depicted in Figure 2(a). In this Figure we have assumed that>E%follows a Gompertz curve with
*L}>E% ' @eK%, which implies a linear increase in the logarithm of the mortality hazard with
age. The arrow in this graph reveals the wedge between the observed mortality rate>7E%and the
underlying rate>E%for frailty5 ' . As long as mortality is relatively low, the two curves for>7E%
and>E%trace each other closely. As soon as mortality has increased to moderate levels, however,
the selection process towards low-frailty individuals in the population becomes signi¿cant and
7
>E% increasingly diverges from >E%. In particular, while *L}>E% increases linearly with age
due to the Gompertz speci¿cation, the observed pattern*L} 7>E%is markedlyÀatter. The observed
mortality increases slower than linear on the log scale, and the slope of the observed mortality
pattern becomes increasingly less than the slope of Gompertz hazard. While the life-table aging
rate in Figure 2(b) is constant across all ages in the Gompertz model, the introduction of the
unobserved heterogeneity leads to a marked decline of the life-table aging rate at higher ages due
to an increased selection of the population towards less frail individuals.
A potential problem in estimating the above frailty model becomes apparent when comparing
the mortality pattern observed in Bulgaria (Figure 1) with the typical mortality pattern implied by a
relative-frailty Gompertz model (Figure 2). First, a Gompertz model¿ts the Bulgarian mortality in
Figure 1 relatively well, and to a¿rst approximation a standard Gompertz hazard function provides
a quite good description of the Bulgarian male and female adult and old age mortality pattern for
the age range 40–100 years. While this good empirical¿t of the Gompertz model may initially
seem very desirable, it poses considerable problems in the context of frailty models. The problem
arises because the characteristic feature of frailty models is the ‘Àattening’ of the mortality curve
and a decline in the life-table aging rate as shown in Figure 2. This decline of the life-table
aging rate is due to the fact that the population alive at some age % becomes increasingly more
selective towards ‘healthy’ individuals. The resultingÀattening of the mortality curve should be
most pronounced for the population that faces the highest level of mortality, that is, in our example
the male population. The male empirical pattern in Figure 1, however, does not reÀect such a
Àattening of the male mortality curves or a marked decline of the male life-table aging rate until
relatively old ages. Instead, a Gompertz model with a linear increase of*L}>E%provides a very
good¿t across all adult and old ages in Bulgaria, especially for males, and a divergence between
the Gompertz model and the observed pattern — similar to the one depicted in Figure 2(b) — is
absent.
age
mu(
x
),
log scale
40 50 60 70 80 90 100
0.001
0.005
0.050
0.500 without unobserved frailty
with unobserved frailty Observed hazard in Gompertz model
reduction of observed mortality rates due to selection process slope of line = b
(a) Gompertz Model with and without unobs. frailty
age
life-table aging rate (LA
R
)
40 50 60 70 80 90 100
0.04
0.06
0.08
0.10
0.12
without unobserved frailty with unobserved frailty LAR in Gompertz model
(b) Life-table aging rate in Gompertz Model
Figure 2: Left graph: Typical pattern of mortality rates implied by a Gompertz model with and without unobserved heterogeneity. Right graph: Life-table aging rate in a Gompertz model with and without unobserved heterogeneity.
by the deviations of the observed mortality pattern from the Gompertz model in Figure 1. As
discussed above, the Bulgarian female mortality pattern exhibits a post-menopausal increase in
the life-table aging rate and a decline at old and oldest-old ages, while the male pattern exhibits a
modest increase in the life-table aging rate until about age 80. The observed life-table aging rate
in the relative-frailty Gompertz model, however, exhibit a markedly different pattern. The
life-table aging rate in this model attains it highest values at relatively young ages before mortality has
affected the frailty composition of the population, and the life-table aging rate declines as the
pop-ulation becomes increasingly selected towards low-frailty individuals. The convex-concave pattern
of mortality change observed in Figure 1, hence, is not implied by the relative-frailty Gompertz
model in Figure 2 that exhibits a monotonously declining life-table aging rate.
A Gompertz model with relative frailty therefore does not provide a good explanation for the
mortality pattern in Bulgaria. Two conÀicting hypotheses can be considered in order to explain
this apparent inability of the relative-frailty Gompertz model to replicate and explain the
(a) There are no unobserved differences in individuals’ frailty in the Bulgarian population. A
se-lection towards low-frailty individuals is thus absent and the male and female mortality pattern
is characterized by systematically different mortality curves with different life-table aging rates.
This implies that males and females in Bulgaria are characterized by a differential aging process.
(b) The Bulgarian population is characterized by unobserved frailty, and the ‘true’ hazard>E%in
equation (1), which applies to individuals with a constant frailty, is increasing faster than a
Gom-pertz hazard so that the convergence between male and female mortality and the convex-concave
pattern of the mortality hazard can result from the selection process in the population towards
low-frailty individuals.
The argument given in (a), namely that the Bulgarian population is homogeneous with respect
to frailty, seems rather unlikely and it contradicts most recent mortality research that points to
important variations in the determinants of survival and longevity that are due to variation in
ge-netic factors [Herskind et al. 1996, McGue et al. 1993] and early-life experiences [Barker 1992,
Doblhammer 1999, Elo and Preston 1992, Horiuchi 1983]. The investigation of the second
hy-pothesis (b) for Bulgaria, however, is dif¿cult because the Gompertz hazard function, and most
other commonly used hazard functions like Kannisto, Makeham, Logistic hazard functions [for a
review of these models see Manton and Yashin 2000, Thatcher et al. 1998], do not allow a
mean-ingful incorporation of unobserved frailty in order to explain the Bulgarian pattern in Figure 1(a).
Moreover, the explanation of the male-female mortality convergence in Figure 1(a) using selection
processes in heterogenous populations requires that the selective forces of mortality start operating
already at adult ages. For instance, this relatively early onset of a selection of the population
to-wards low-frailty individuals is supported by recent evidence from twin studies which suggest that
unobserved heterogeneity is important for the estimation of mortality pattern at adult ages, and not
only for mortality at old and oldest-old ages [Caselli et al. 2000, Iachine et al. 1998].
In this paper we therefore propose an alternative speci¿cation, a modi¿ed DeMoivre hazard
function, that is suitable to investigate the hypothesis of whether the differential slopes of the
mor-tality pattern between males and females in Bulgaria could merely be the result of a differentially
strong selection process in heterogeneous populations.
2
A Modi
¿
ed DeMoivre Hazard Function
In an early attempt to describe mortality patterns with a mathematical formula, Abraham DeMoivre
[DeMoivre 1725, p. 4, cited in Key¿tz and Smith 1977, p. 273] hypothesized that ‘the number of
and the extremity of old age’, i.e.,
,E% ',fE /%,
where/is the maximum attainable age in the population. From this, the hazard rate, or the force
of mortality at age%is de¿ned as
>(E% '
/%c (4)
where>(E% denotes the DeMoivre hazard function. The hazard rate in this example increases
towards in¿nity as%approaches the maximum attainable age/. The existence of this maximum
attainable age implies that the force of mortality increases faster than in the Gompertz model,
especially as%approaches the maximum age/[for a related discussion see Zelterman 1992].
For the application to contemporary mortality patterns the hazard function>(E%in (4) is not
suf¿cientlyÀexible. We therefore propose a modi¿ed DeMoivre hazard given by
>(E% '@ % /
3K/
, (5)
where>(E%is the modi¿ed DeMoivre hazard function. The survival curver(E%
correspond-ing to the above hazard function is given by
r(E% ' i T
K/@/E %/3EK/3. (6)
The parameterKin (5) and (6) needs to satisfyK : / in order that the hazard and survival curves
are meaningful.
The hazard function>(E%de¿ned in (5) has two limiting properties that render it a plausible
and easily interpretable speci¿cation. First, the original DeMoivre hazard>(E%emerges — up to
a factor of proportionality — from the modi¿ed DeMoivre hazard>(E%when the productK/in
(5) approaches one. This occurs, for instance, whenK$*/for a¿xed maximum attainable age
/. Formally this property is represented as *4K<*/>(E% ' *4K/<>(E% ' @K>(E%.
Second, as the maximum attainable age / becomes large, the modi¿ed DeMoivre hazard
ap-proaches the Gompertz hazard >CE% ' @eK%. That is, the hazard >(E% in (5) has the limit
*4/<">(E% '>CE%. The reason for this convergence to the Gompertz hazard is easily seen
The interpretation of the parameters in the modi¿ed DeMoivre hazard is further facilitated by
the fact that>(E%m%'f'@and _%_ *L}>(E%%'f ' _%_ *L}>CE%%'f'K, which implies that
the modi¿ed DeMoivre hazard agrees with a Gompertz hazard with equal parameters @and Kat
the age%' f
In heterogeneous populations with unobserved frailty the observed mortality rate differs from
>(E%because the population becomes increasingly selected towards low-frailty individuals with
age. If we assume a Gamma-distributed relative frailty model, then the observed hazard rate and
survival curve implied by the modi¿ed DeMoivre model, denoted >7(E% and 7r(E%, follow
directly from equations (1) and (2) as
7
>(E% ' >(E%
j2*L}r(E% (7)
and
7
r(E% ' Ej2*L}r(E%3*j2
, (8)
where>(E%andr(E%are the hazard function and survival curve in equations (5) and (6) for
individuals with a constant frailty5 ' .
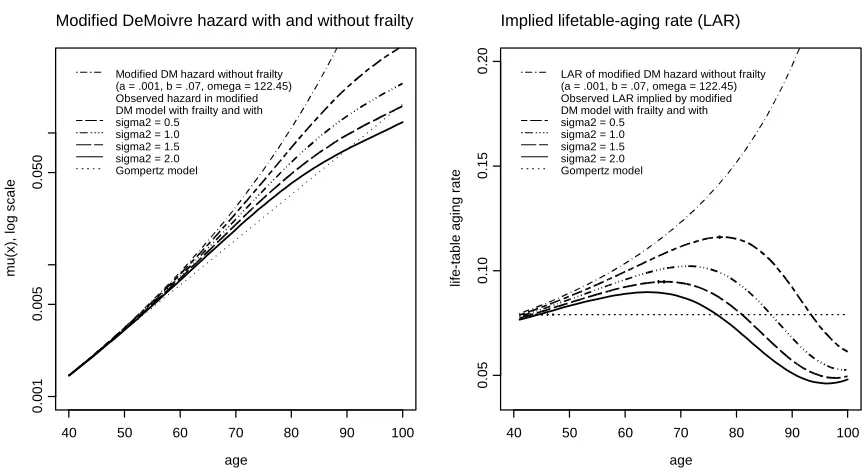
Figure 3 plots the modi¿ed DeMoivre hazard function and the implied life-table aging rate for
different values ofj2representing different degrees of unobserved heterogeneity in the population.
In this¿gure we have used a maximum attainable age/of 122.45 years, i.e., a/that corresponds
to Madame Jeanne Calment age at death, and we used the modi¿ed DeMoivre hazard function to
model mortality during ages 40–100. [Note 2] The dashed-dotted line in both graphs represents
the values for the modi¿ed DeMoivre hazard without unobserved frailty, or equivalently, for
indi-viduals with a constant frailty5 ' . Conditional on a constant frailty5 the modi¿ed DeMoivre
hazard increases faster than the exponential Gompertz hazard and the life-table aging rate is also
an increasing function of age. As the age approaches the maximum attainable age /, both the
mortality hazard and the life-table aging rate approach in¿nity and the probability of surviving to
ages larger than/is zero.
The existence of such an upper limit to life-span is in contrast to the Gompertz model that does
not imply a maximum attainable age and it is certainly controversial in view of the recent debate
about the limits to the increase in life expectancy and particularly to the biological limits of
life-span [Gavrilov and Gavrilova 1991, Manton and Stallard 1996, Vaupel et al. 1998, Wilmoth 1997,
age
mu(
x
),
log scale
40 50 60 70 80 90 100
0.001
0.005
0.050
Modified DM hazard without frailty (a = .001, b = .07, omega = 122.45) Observed hazard in modified DM model with frailty and with sigma2 = 0.5
sigma2 = 1.0 sigma2 = 1.5 sigma2 = 2.0 Gompertz model
Modified DeMoivre hazard with and without frailty
age
life-table aging rate
40 50 60 70 80 90 100
0.05
0.10
0.15
0.20
Implied lifetable-aging rate (LAR)
LAR of modified DM hazard without frailty (a = .001, b = .07, omega = 122.45) Observed LAR implied by modified DM model with frailty and with sigma2 = 0.5
sigma2 = 1.0 sigma2 = 1.5 sigma2 = 2.0 Gompertz model
Figure 3: Observed mortality rates implied by the modi¿ed DeMoivre hazard function for different
degrees of heterogeneity in the population
life-span exist, they need to be seen in a dynamic perspective [Carey and Judge 2000] and almost
certainly do not represent immutable biological limits that are insurmountable by medical or social
progress in survival to very old ages. At the same time, in any given socioeconomic environment
the observed human life-span is¿nite and no human being has been documented to survive above
Madame Jeanne Calment’s age at death. Hence, while there probably does not exist an absolute
biological limit to life-span, human life-span in any socioeconomic context may be limited and
the changes of this upper limit to life in itself may constitute an interesting area of research [e.g.,
Carey and Liedo 1995, Wilmoth and Lundström 1996].
The mortality hazard in the modi¿ed DeMoivre model, conditional on a constant frailty5,
in-creases faster than exponential and implies an increasing life-table aging rate with age. Despite this
fact, the observed mortality pattern in a heterogeneous population can reÀect a substantially
dif-ferent pattern. In Figure 3 we have therefore included the observed mortality hazard and life-table
aging rate that is implied by the modi¿ed DeMoivre hazard with different degrees of unobserved
heterogeneity in the population. Most strikingly, the observed mortality pattern does not
see Vaupel and Yashin 1985], but reÀects properties that are characteristic of the Bulgarian mortal-ity pattern in Figure 1 and also that of other countries. For instance, the observed life-table aging
rate between ages 40–100 can be initially increasing, and the extent of this increase in the life-table
aging rate depends on the degree of heterogeneity and the level of mortality. At the same time, the
relative increase in mortality by age decreases at old and oldest-old ages. Once age approaches
the maximum attainable life-span/, this decline in the life-table aging rate reverses again and the
observed mortality rate and the life-table aging rate increase and ultimately approach in¿nity at
/. While this last implication for extremely old ages is controversial in view of the discussion
on the limits to human longevity, the modi¿ed DeMoivre hazard in combination with unobserved
heterogeneity can represent observed age-patterns of mortality for the quite wide age-range from
adult to old and oldest-old ages during which most deaths in humans occur.
In the age range below age 100, therefore, the modi¿ed DeMoivre hazard function >(E%
has several properties that make it a plausible choice for estimating frailty models in mortality. For
instance, nonparametric estimations of the hazard function, which are feasible in bivariate frailty
model applied to twin data [Yashin et al. 1995], have revealed that the hazard for individuals with
constant frailty5 ' during adult ages is increasing substantially faster than the Gompertz hazard,
while the observed mortality rates can be approximated by a Gompertz or Logistic hazard function.
In addition, detailed multivariate follow-up studies document a differential selection in male and
female cohorts with respect to physiological characteristics and functional abilities that indicate
an important role of selection processes for understanding male-female differences in mortality
[Manton et al. 1995]. On the basis of these and related¿ndings, Caselli et al. [2000, p. 8] have
concluded that the ‘correction for unobserved heterogeneity in demographic life tables may be
needed not only for the oldest-old but also for the traditional interval of aging between 35 and
85 years of age, for which the observed trajectory of mortality appears to be well-described by a
Gompertz curve.’
The modi¿ed DeMoivre hazard function in Figure 3 provides a possibility to estimate frailty
models in the above situation. In particular, the observed hazard>7(E%as well as the baseline
hazard>(E% in this Figure agree highly with the nonparametric estimates reported in Caselli
et al. [2000] and Yashin et al. [1995]. Since nonparametric estimation is only feasible with special
data, as for instance data on the mortality of twins or data with proportional-hazard covariates,
the modi¿ed DeMoivre hazard introduced in this paper provides a suitable alternative for frailty
modeling with vital statistics data. The hazard function introduced in this paper, therefore, allows
the investigation of the ‘selectivity hypotheses’ for the convergence of male and female
unobserved heterogeneity do not yield an accurate description of the observed mortality dynamics.
Two basic approaches exist for the estimation of the unknown parameters@,K,/andj2. First,
we can choose a plausible value for /, such as Madame Jeanne Calment’s age at death. The
remaining parameters@,K,j2 can then be estimated via a maximum likelihood using/' 22eD.
This approach should be taken if mortality data at very old ages, say above age 110 that could shed
light on the value of/care not available or reliable. In our experience, this procedure yields a quite
robust and plausible estimation, and the results of the parameters@andKare not very sensitive to
the choice of/as long as it is chosen within a plausible age range, say 110 – 150 years.
The second possibility is to estimate all four parameters@,K,/ andj2 using maximum
like-lihood estimation. Since/determines the convexity of the hazard function, andj2 inÀuences the
extent to which the increase in>7E%isÀattened due to the selection process towards low-frailty
in-dividuals, the joint estimation of all four parameters is not feasible when only one mortality pattern
is observed. It is, however, feasible if mortality patterns of several subpopulations, e.g., by sex or
educational attainment, are analyzed. An example for this estimation is given in Section 3. Quite
naturally, an effective estimation of the life-span/requires reliable data at very high ages that may
not be available in many countries. If the focus of the investigation is on adult and old-age
mortal-ity, e.g., as in our Bulgarian example on the age range 40–100, an estimation strategy that assumes
a speci¿c value for/and then conducts a sensitivity analysis may be preferable to the estimation
of/ from data that are censored at some upper age limit. If/ is nevertheless estimated in these
cases, our experience suggests that the resulting ‘best-¿tting mortality curve’ is often characterized
by a too low maximum age/, and a too high level of unobserved heterogeneity.
Independent of which approach regarding the speci¿cation of / is chosen, the parameters @,
K, and j2 can be functions of characteristics of individuals or subpopulations. In particular, we
implement the estimation of the modi¿ed DeMoivre mortality model with
@E+@ ' i TEkfnk+@cnk2+@c2n (9)
KE+K ' qfnq+Kcnq2+Kc2n (10)
j2E+
j ' i TEfn+jcn2+jc2n c (11)
where+@,+K,+jare vectors of covariates that inÀuence the level of the parameters@,K, andj2. For
instance, in the next Section we will estimate a model where some of the parameters can differ by
sex. This dependence of the parameters on sex is incorporated by including a dummy for females
in+@,+Kand/or+j. While this speci¿c analysis is a relatively simple dependence of the parameters
3
Application of the Modi
¿
ed DeMoivre Method to Bulgaria
3.1
Estimation of the modi
¿
ed DeMoivre hazard
The Bulgarian mortality pattern for males and females during 1992–93 has already been depicted
in Figure 1. In this Section we use the modi¿ed DeMoivre hazard function in combination with
unobserved heterogeneity in order to evaluate whether the differential increase in mortality by
age between males and females in Bulgaria can plausibly be explained by a selection process in
which the higher male mortality level leads to a quicker selection of the male population towards
low-frailty individuals.
Our analyses are based on an unique database for Bulgaria which is based on a linkage between
the death records for the period 5th of December 1992 – 31st of December 1993 and the census on
4th of December 1992. This data-set is the¿rst comprehensive population-based data on mortality
in Bulgaria that includes a broad array of socioeconomic information for individuals who are at risk
of death. The linkage of the death certi¿cates to the census records is carried out using a personal
identi¿cation number (PID) included in all of¿cial records of an individual in Bulgaria. The linkage
between the census and the death registration is of high quality, and in totalb2S.per cent of all
death certi¿cates are linked to the census records. Among the linked deaths, bDf. per cent are
based on the PID number. Only eb per cent of the deaths are linked using other identi¿cation
variables (e.g., place and region of residence, birth day, sex, education, marital status) because the
PID number is missing or incomplete. A relatively small fraction of . per cent of all deaths
could not be linked to the census records. [Note 3]
The subsequent analyses include all individuals in Bulgaria who are at least 40 years old at
census and are below age 100 either at death or on 31st December 1993. Our data thus comprise
1.87 million males of whom 57,221 die during the observation period, and 2.09 million females of
whom 45,831 die during the 13 months after the census.
We ¿rst estimate a standard piecewise-constant hazard model (with constant hazards in
two-year age intervals) separately for males and females in order to obtain a nonparametric estimate for
the observed mortality pattern. The respective estimates have already been depicted in Figure 1(a),
and they will also be included in subsequent Figures for comparison with our parametric estimates.
In Table 1 we report the results of different parametric speci¿cations. Model 0 is a standard
Gompertz model without unobserved heterogeneity that allows for male-female differences in both
parameters@andK. These estimates have been used for the¿tted Gompertz hazard curve in Figure
of the respective parameter for males, while the ‘slope-parameter’K for females exceeds that of
males by 0.025. The latter difference implies that the relative increase of mortality rates by each
year of age is 2.5 percentage points higher for females than for males and it leads to the — already
discussed — strong convergence between the male and female mortality rates in Bulgaria.
Models 1–4 in Table 1 include a Gamma-distributed frailty and are based on a modi¿ed
DeMoivre hazard function. Except for Model 4, where the maximum attainable age / is
esti-mated from the data, these models assume a/which is equal to Madame Calment’s age at death.
The parameters@,K, andj2 are speci¿ed as in equations (9–11) using sex as the only covariate.
The simplest Model 1 estimates the male and female mortality pattern using identical
param-eter valuesKandj2 for both sexes, while the parameter@ is allowed to vary between males and
females in order to capture the different mortality levels. That is, the model allows for different
levels of mortality by sex, but it assumes an equal ‘slope-parameter’ K across sex. The model
therefore attempts to explain the differential increase in mortality with age merely by the selection
hypothesis, i.e., the fact that the male population faces a more rapid selection towards low-frailty
individuals due to the higher overall male mortality level. Most importantly, the model yields an
estimate of j2 ' i TESHS ' fDe, indicating a quite substantial heterogeneity in the
popu-lation. According to this estimate, about2Hper cent of the population at age 40 have a frailty of
5Dandb.per cent have a frailty of5 2.
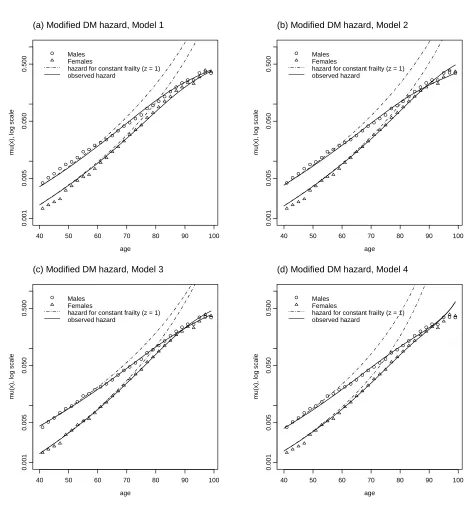
Figure 4(a) shows that this model traces the convergence between the observed male and female
mortality rates with increasing age quite well (full lines), despite the fact that the mortality rates
for a constant frailty 5 ' increase in a parallel fashion (dashed-dotted line). Hence, Model
1 contributes a substantial part of the observed convergence between male and female mortality
rates to the differential strength of the selection process in the male and female population (a formal
measurement of the¿t of this model and a comparison with alternative Gompertz speci¿cations
are provided in the sensitivity analysis in Section 3.3 below).
Model 2 in Table 1 provides an extension of the above model and incorporates a potentially
different degree of heterogeneity between the male and female populations. Possible reasons for
such a differential variance in unobserved frailty could be a greater variation in life styles (such as
smoking habits or other risky behaviors) among the male as compared to the female population.
Indeed, the estimates in Table 1 suggest that the male variance of frailty isj26@,e' i TEeH.S '
fScwhile the corresponding variance for females is 35% smaller (j2se6@,e ' fef). This implies
that aboutfper cent of males, but only22per cent of females, have a low frailty of5 D, and
more thanfper cent of males, but aboutHper cent of females, have a high frailty of5 2at age
Table 1: Estimates of a Gompertz model without frailty and modi¿ed DeMoivre hazard models
with Gamma-distributed frailty ((se6@,e denotes a dummy variable for females)
Data Male and Female Mortality in Bulgaria, 1992–93
Age 40–95
Method Gompertz Modi¿ed DeMoivre hazard function
hazard, with Gamma-distributed relative frailty
no frailty
Model 0 Model 1 Model 2 Model 3 Model 4 Speci¿cation for@' i TEkfnk(se6@,e
kf (Constant) -5.5713 -5.6350 -5.5686 -5.4365 -5.5249
(0.0117)* (0.0110)* (0.0114)* (0.0129)* (0.0116)*
k (Female) -1.3205 -0.7302 -0.8385 -1.1086 -0.9163
(0.0198)* (0.0100)* (0.0117)* (0.0182)* (0.0139)*
Speci¿cation forK'qfnq(se6@,e
qf(Constant) 0.0825 0.0755 0.0749 0.0687 0.0740
(0.0004)* (0.0004)* (0.0004)* (0.0005)* (0.0005)*
q(Female) 0.0254 – – 0.0103 –
(0.0006)* (0.0004)*
Speci¿cation forj2 ' i TEfn(se6@,e
f (Constant) – -0.6186 -0.4876 -0.7411 0.0960
(0.0239)* (0.0234)* (0.0263)* (0.0281)*
(Female) – – -0.4285 – –
(0.0255)*
Speci¿cation for/
/ – set to set to set to 104.2420
122.45 122.45 122.45 (0.3475)*
Notes: Standard errors in parentheses. p-values: nR< 0.01 *R< 0.001. Age has
been rescaled in the estimation so that the parameter@reÀects the mortality level of
the population at age 40, andj2 indicates the variance of unobserved frailty at this
age
mu(x), log scale
40 50 60 70 80 90 100
0.001
0.005
0.050
0.500
(a) Modified DM hazard, Model 1
Males Females
hazard for constant frailty (z = 1) observed hazard
age
mu(x), log scale
40 50 60 70 80 90 100
0.001
0.005
0.050
0.500
(b) Modified DM hazard, Model 2
Males Females
hazard for constant frailty (z = 1) observed hazard
age
mu(x), log scale
40 50 60 70 80 90 100
0.001
0.005
0.050
0.500
(c) Modified DM hazard, Model 3
Males Females
hazard for constant frailty (z = 1) observed hazard
age
mu(x), log scale
40 50 60 70 80 90 100
0.001
0.005
0.050
0.500
(d) Modified DM hazard, Model 4
Males Females
hazard for constant frailty (z = 1) observed hazard
Figure 4: Application of modi¿ed DeMoivre hazard functions with Gamma distributed relative
The resulting ¿t of the Model 2 is depicted in Figure 4(b). Since this model allows for an
additional parameter, it¿ts the Bulgarian mortality pattern slightly better than our earlier model.
Differences in the observed slope of the mortality pattern in Model 2 are again only due to
dif-ferences in the overall mortality level and in subsequent difdif-ferences in the selection process in a
heterogeneous population. The present model therefore suggests that the male population may be
more heterogeneous with respect to various biological or socioeconomic determinants of mortality.
The speci¿c investigation of this issue is beyond the scope of the present paper, but it is feasible on
the basis of our data that includes a broad range of covariates about individuals. Most important in
the present context is that Model 2 further con¿rms our argument that differential selection process
provides a plausible explanation for the male-female difference in the increase of mortality with
age.
An alternative generalization of our initial estimation is provided in Model 3 in Table 1, where
the parameterK, instead of the variancej2, is allowed to vary across sexes. The coef¿cients show
that the relative difference in the ‘slope-parameter’Kbetween males and females is substantially
re-duced by incorporating unobserved heterogeneity as compared to the Gompertz model without any
frailty considerations. This¿nding is again consistent with an important male-female difference in
the strength of selection towards low-frailty individuals in the population. The¿t of this model is
given in Figure 4(c), where this model performs slightly better than the two earlier models.
How-ever, this improvement is not surprising since the speci¿cation of a separate slope-parameterKfor
males and females provides a direct modelling of the differential mortality increase between sexes.
Finally, model 4 in Table 1 estimates the maximum attainable age/in addition to the remaining
parameters@, K, and j2. While our earlier models were based on a predetermined / of 122.45
years, the present estimate reveals a/of slightly above 104 years. Moreover, the variance of the
unobserved frailty has increased toj2 ' f(withj2 ' f,per cent of the population have
a frailty of5 ,e per cent have a frailty of5 D, andeper cent have a frailty of5 2).
While these parameter estimates yield a ‘best-¿tting model’ in Figure 4(d), the estimate for / is
not plausible and it depends strongly on the age at which the data are censored. For instance, if the
data include individuals who survive to age 105 or 110, then the respective estimates for/increase
respectively to 108 and 111.5. and that for j2 decline to 0.91 and 0.79. The estimates for the
parameters@andKare relatively insensitive to changes in the age range above 100. Hence, while
Model 4 provides the best¿t of the Bulgarian mortality data using a modi¿ed DeMoivre hazard
with no sex-differences in the slope parameterKor the variance of frailtyj2, the estimates of this
model about/ cannot be interpreted in terms of a maximum life-span because the estimation was
in the age-range 40–100. Without survivors to very old ages, however, an estimation that assumes
a plausible value for/ as in Models 1–3 seems preferable to the direct estimation of / from the
data. It is beyond the scope of this paper to apply the modi¿ed DeMoivre hazard explicitly to
reliable mortality data at ages 100+, but these future applications provide a possibility to estimate
interpretable and realistic values for the maximum attainable age/and the changes of this limit to
life-span over time.
3.2
Comparison with piecewise-constant hazard with unobserved frailty
In order to assess the empirical plausibility of the modi¿ed DeMoivre hazard model we compare
the above results with a nonparametric estimation of the hazard curve. This nonparametric
alter-native is feasible if the mortality hazards for males and females, conditional on the frailty5, differ
only by a factor of proportionality. In this case it is possible to combine Gamma-distributed
rel-ative frailty with a piecewise-constant hazard function> `E%that does not impose parametric
restrictions on the shape of the mortality pattern [Note 4]. This nonparametric estimation of the
baseline-hazard> `E%can then be compared to the modi¿ed DeMoivre hazard>(E%in order
to assess the implications of the parametric assumptions used in the previous section.
The left graph in Figure 5 shows the observed male and female mortality level in Bulgaria
along with the estimated baseline hazard> `E%for individuals with a constant frailty5 ' and
the corresponding observed hazard>7 `E%obtained from the piecewise-constant estimation. The
model¿ts the observed male and female mortality pattern relatively well and the¿t is comparable
to our earlier Model 4 in Figure 4.
The primary question regarding the estimation of this piecewise-constant frailty model in
Fig-ure 5(a) is whether the respective estimates for the variance of the frailty distribution and the
increase of the mortality rates for a constant frailty 5 ' are consistent with our knowledge
about human mortality. In order to investigate this issue, we compare in Figure 5(b) the estimated
baseline hazards>E%obtained from the piecewise-constant and the modi¿ed DeMoivre model.
The graph reveals that the piecewise-constant speci¿cation yields the fastest increasing baseline
hazard across all estimated models, and it also yields the highest variancej2for unobserved frailty
(j2 ' D.). The differences are largest between the piecewise-constant model and the DeMoivre
models with / ' 22eD (Models 1 and 2 in Figures 4 and 5b), while it is only modest when
compared to the DeMoivre model where/is estimated from the data (Model 4 in Figures 4 and
5b). Since the last model already implied an implausible value of only 104 years for the highest
piecewise-age
mu(x), log scale
40 50 60 70 80 90 100
0.001
0.005
0.050
0.500
Males Females
hazard for constant frailty (z = 1) observed hazard
(a) Piecewise constant hazard with frailty
age
mu(x), log scale
40 50 60 70 80 90 100
0.001
0.005
0.050
0.500
mod. DM hazard, Model 1 mod. DM hazard, Model 2 mod. DM hazard, Model 4 piecewise constant hazard
(b) Comparison with modified DeMoivre hazard
Estimated variance of frailty (sigma^2) with mod. DM hazard, Model 1 = 0.54 mod. DM hazard, Model 2 = 0.62 (males) = 0.38 (females) mod. DM hazard, Model 4 = 1.36 piecewise const. hazard = 1.58
Figure 5: Comparison of a piecewise-constant hazard model with unobserved frailty with the
modi¿ed DeMoivre model with unobserved frailty
constant estimation as too steep. Similarly, the variance of the frailty distribution in the
piecewise-constant model seems unrealistically high since it suggests that about 19 per cent of the initial
population have a frailty of5 f and about 15 per cent have a frailty of 5 2 However,
Iachine et al. [1998] obtained similarly large values for the variance of unobserved frailty from
twin data.
While the nonparametric estimation of the baseline hazard with a piecewise-constant model
certainly has its virtues, it can also lead to estimates of the baseline-hazard that are implausible.
The modi¿ed DeMoivre model with/ set to 122.5 years provides a possibility to restrict the
in-crease of the baseline hazard with age to values that are consistent with observed survival to very
old ages. Moreover, the differences between the observed and estimated mortality pattern in the
simplest DeMoivre model in Figure 4(a) suggest alternative speci¿cations that are not feasible with
the piecewise-constant estimation. For instance, in Models 2 and 3 in Figure 4 we allow the
vari-ance of the frailty distribution or the slope-parameterKto be different between males and females.
Both extensions substantially improve the¿t of the model. In our opinion these extensions provide
piecewise-constant analysis. The modi¿ed DeMoivre function therefore provides a very suitable
hazard function for the application of frailty models to adult ages, and it allows speci¿cations of
the parameters that are not available with nonparametric estimations.
3.3
Sensitivity analysis of estimated parameters
In this Section we provide a sensitivity analysis in order to investigate the extent to which the
coef¿cients obtained from the modi¿ed DeMoivre hazard function depend on the choice of the
maximum attainable age/. Our earlier estimates of Models 1–3 in Table 1 and Figure 4 were
based on/ ' 22eD, i.e., Madame Calment’s age at death. In order to evaluate the sensitivity of
our estimates with respect to the choice of/, we reestimate Models 1 and 2 in Table 1 using a/
that ranges from 105 to 150 years (we do not report the sensitivity analysis for Model 3 since it
leads to similar results).
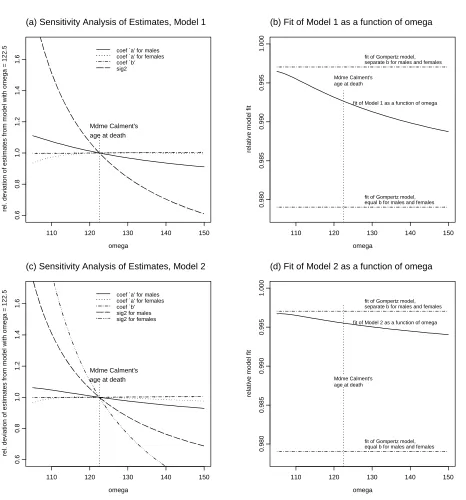
The top-left graph in Figure 6 shows the relative deviation of the estimated coef¿cients@6@,e,
@se6@,e,K, and j2 as a function of/. The top-right graph in this Figure shows the goodness-of-¿t
of the Model 1 as a function of /. The goodness-of-¿t is calculated as -77*77A, where
-77is the residual sum of squares on the logarithmic scale and77A is the total sum of squared
deviations from the mean on the logarithmic scale.
The Figure shows that the parameters@ andKare relatively insensitive to the speci¿cation of
/, while the estimated variance of frailty depends quite strongly on the choice of/. The latter is
not very surprising since/ determines the convexity of the hazard function>(E% in equation
(5), i.e., the hazard for individuals with a constant frailty5 ' A low/implies a quite strongly
increasing hazard>(E%with age. This subsequently results in a higher estimate forj2 in order
for the model to¿t to the observed mortality rate.
The top-right graph in Figure 6 shows a goodness-of-¿t analysis of Model 1, i.e., a model that
allows only for level-differences in mortality across sex but no differences in the ‘slope-parameter’
KThe dash-dotted lines in this graph reveal on one hand the¿t of the Gompertz model with separate
parameters@ and K for males and females (i.e., Model 0 in Table 1), and on the other hand the
Gompertz model withKconstrained equal across sexes. The¿t of Model 1 is between these two
benchmarks, and it tends to decrease the higher is the value for/. For low values of /, Model
1 ¿ts almost as good as Model 0 with no parameter restrictions across sex. With increasing /
this goodness-of-¿t declines. Ultimately it approaches the lower dash-dotted line because a rising
/ renders the modi¿ed DeMoivre hazard more and more like a Gompertz model. However, for
separate slope-parameters for males and females than that of the Gompertz model with equalKfor
both sexes.
The sensitivity of the estimates forj2, therefore, is not as severe as the top-left graph in Figure
6 may suggest. First, the model with/ ' 22eD, i.e., Madame Calment’s age at death, provides
the best-¿tting which is based on a maximum attainable age/that is at least as high as the highest
age lived by any person so far. Second, for a quite broad range of plausible choices for/, say,
between 115 and 130 years, the main conclusion of Model 1 remains unaltered: a substantial part
of the male-female differences in the slope of the observed mortality pattern can be explained by
a differential strength of the selection process towards low-frailty individuals that is caused by
differences in the overall level of mortality between males and females.
The bottom-left and bottom-right graph in Figure 6 show the corresponding sensitivity analysis
for Model 2 in Table 1. Similar to Model 1, the estimates for@ andKare not very sensitive with
respect to the choice of /, while the estimates for j26@,e and j2se6@,e change substantially with
/. The analysis in the bottom-right graph, however, reveals that these changing estimates for
j2-parameters leave the goodness-of-¿t of the model almost unaffected.
The choice of/in Model 2 is thus not essential for the main conclusion of the analysis: A
mod-i¿ed DeMoivre hazard model with only one ‘slope-parameter’ Kfor both males and females
pro-vides a very good description of the Bulgarian mortality pattern. Moreover, this model attributes a
substantial part of the differential male-female increase in mortality by age to a differential strength
of the selection process which is caused by the higher overall level of male mortality.
Our preferred choice for / in analyses with the modi¿ed DeMoivre hazard is / ' 22eD
years based on Madame Calment’s age at death. While the speci¿c estimates forj2 are sensitive
to this choice, the primary conclusion resulting from the incorporation of frailty in the analysis of
Bulgarian mortality is very robust with respect to this speci¿cation.
4
Conclusions
The incorporation of unobserved frailty in the analysis of mortality at adult ages is of considerable
theoretical and empirical interest. For instance, the estimation of relative frailty models sheds
light on questions of whether a convergence in the mortality rates of different subpopulations, or
a ‘Àattening’ of the mortality curve with age, can be explained by a selection process towards
low-frailty individuals in heterogeneous populations.
While frailty models have been primarily applied to old and oldest-old mortality, recent
in-omega
rel. deviation of estimates from model with omega =
122.5
110 120 130 140 150
0.6 0 .8 1.0 1 .2 1.4 1 .6
(a) Sensitivity Analysis of Estimates, Model 1
coef ‘ a’ for males coef ‘ a’ for females coef ‘ b’ sig2
Mdme Calment’s age at death
omega
relative model fit
110 120 130 140 150
0.980
0.985
0.990
0.995
1.000
fit of Gompertz model, equal b for males and females fit of Gompertz model, separate b for males and females (b) Fit of Model 1 as a function of omega
Mdme Calment’s age at death
fit of Model 1 as a function of omega
omega
rel. deviation of estimates from model with omega =
122.5
110 120 130 140 150
0.6 0 .8 1.0 1 .2 1.4 1 .6
(c) Sensitivity Analysis of Estimates, Model 2
coef ‘ a’ for males coef ‘ a’ for females coef ‘ b’ sig2 for males sig2 for females
Mdme Calment’s age at death
omega
relative model fit
110 120 130 140 150
0.980
0.985
0.990
0.995
1.000
fit of Gompertz model, equal b for males and females fit of Gompertz model, separate b for males and females (d) Fit of Model 2 as a function of omega
Mdme Calment’s age at death
fit of Model 2 as a function of omega
Figure 6: Sensitivity analysis of the parameter estimates obtained for Models 1 and 2 in Table 1
dividuals in their susceptibility to death is also relevant for the traditional age range from, say,
40–100 years. The application of relative frailty models to these ages, however, is often hampered
by the fact that the observed mortality pattern across adult ages is well-described by a Gompertz
curve. In this case the estimation of the usual frailty models, which are based on Gompertz or
similar hazard functions, fails because the observed pattern lacks the typical ‘Àattening’ of the
mortality curve that results from the selection towards low-frailty individuals in a heterogeneous
population.
In this paper we propose a modi¿ed DeMoivre hazard function which is suitable for the
estima-tion of frailty models of mortality for adult ages, e.g., between 40–95 years. The hazard condiestima-tional
on a constant frailty in this speci¿cation increases faster than exponential. The observed hazard,
on the other hand, can capture a broad range of mortality patterns that are commonly encountered
in the analysis of mortality at adult ages.
We apply the Gamma-distributed relative frailty model with a modi¿ed DeMoivre hazard to
male and female mortality in Bulgaria during 1992–93. The two characteristic features of this
mortality pattern are a substantial difference in the level of adult mortality between males and
fe-males, and a considerably steeper increase of mortality with age for females than for males. Our
analyses show that a substantial part of this differential increase of mortality can be explained by
a differential selection process in the male and female population. Since the level of mortality
is higher for males than for females, the male population faces an earlier and stronger selection
towards low-frailty individuals, and the resulting differences in the frailty composition of the
pop-ulation at older ages can explain the convergence between male and female mortality.
This ¿nding of our analyses is robust across different speci¿cations for the hazard function.
Moreover, sensitivity analyses and a comparison with nonparametrically estimated hazard
func-tions show that the modi¿ed DeMoivre hazard function leads to plausible and relatively robust
estimates.
In summary, this paper provides a new substantive and methodological approach to the
under-standing of mortality at adult and old ages. First, we propose a new hazard function that implies,
conditional on frailty, a faster than exponential increase of mortality with age. This model is
there-fore suitable for the estimation of frailty models at ages between 40–100 years, i.e., the age range
where Gompertz or logistic models often yield a reasonable description of the observed mortality
pattern. Second, we argue that unobserved heterogeneity provides a plausible explanation of the
adult mortality pattern in Bulgaria — and possible also other countries — during the early 1990s.
Our estimations using the modi¿ed DeMoivre hazard function suggest that the stronger selection
of mortality, may constitute a primary mechanism leading to the convergence of male and female
mortality at higher ages. This¿nding implies that the convergence is not necessarily caused by
a differential process of aging across sexes, but is merely a consequence of the different levels of
mortality, and a subsequently different selection process, for males and females.
Acknowledgments: We are indebted to James W. Vaupel, Francesco Billari, Tan Qihua, Heiner
Maier, the members of the Laboratory of Survival and Longevity at the Max Planck Institute for
Demographic Research and two anonymous referees for many helpful comments and suggestion
that have greatly improved this paper. We gratefully acknowledge the support received for this
research by the Max Planck Institute for Demographic Research and the National Statistical
In-stitute (NSI) in Bulgaria. The Bulgarian mortality data has been made available by the National
Statistical Institute of Bulgaria, and we are greatly indebted to Ekaterina Arnaudova, Ivan Balev
Notes
1. The estimates for the life-table aging ratio have been smoothed using Kalman-Filter
tech-niques.
2. Madame Jeanne Calment was born on the 21st of February 1875 and died on the 4th of August
1997 at the age of 122 years, 5 months and 14 days. Madame Jeanne Calment age at death is
currently the highest veri¿ed age at death of a person.
3. In the period 5th of December 1992 – 31st of December 1993ScSdeaths occured in
Bulgaria. A relatively small fraction of HcDe deaths E. I, could not be linked to the census
records (4,142 (48.50%) of the unlinked deaths are males, and 4,399 (51.50%) are females).
Al-though the death certi¿cate in Bulgaria contains some limited information on the socio-economic
status of dead persons (e.g., education at death, marital status at death, place of residence at death),
we omit the unlinked deaths from our analysis mainly for two reasons: (a) We do not know whether
the persons corresponding to unlinked death certi¿cates have participated the census, and their
personal data were wrongly coded in the census records, or whether they are subject to census
undercount. This latter possibility is supported by the fact that some relevant minorities in
Bul-garia are more likely to be a subject of undercount, which is indicated by the fact that most of the
unlinked deaths involve persons with low education (76.56% of the unlinked male, and 86.63% of
the unlinked female deaths). (b) The unlinked deaths can also correspond to return migrants whose
prevalence has increased after the ¿rst waves of rapid emigration in the early 1990s. We believe
that census undercount and return migration are the most important factors leading to unlinked
death certi¿cates. If the persons corresponding to the unlinked deaths have not participated in the
census due to the above reasons, then excluding them from the analyses is appropriate. If they have
participated in the census, but the death cannot be linked due to incomplete identi¿cation numbers,
our estimates about the mortality level are biased downward. However, we have no reasons to
believe that this bias is highly sex-speci¿c.
Therefore, the Bulgarian age and sex-speci¿c patterns of mortality presented in this paper
cannot be attributed to a bias caused by unlinked deaths because the overall numbers of unlinked
deaths is quite small and is evenly distributed across sexes. Moreover, the age distribution of the
linked and unlinked deaths is relatively similar for males, while it is slightly shifted to higher ages
for females. For instance, the exact mean age at death of unlinked male deaths is 67.2 years, which
age of 76.7, which is above that of linked deaths with a mean age of 73.2.
Age reporting is of relatively high quality in the Bulgarian census. The age of a person is
coded in the personal identi¿cation number (PID), which was assigned to the individuals either
during 1976–78 for those alive at this time, or at birth for those born afterwards. The age in the
census form is taken from the age coded in the PID number. Since the old and oldest-old in 1992
have received their PID about 15 years earlier, when the propensity to age-misreporting may have
been lower due to younger ages and careful administrative checking, the age information in our
census data should be of high quality even for the old population.
4. The piecewise-constant proportional hazard model with unobserved frailty is speci¿ed as
fol-lows. Consider the age-intervalsESfc Soc cES3c Soc cESg3c Sgothat separate the observed
age range intog disjoint intervals. Then assume that the mortality hazard, conditional on a frailty
5 ' and the observed covariates +@, is constant within each of these age intervals and equals
@E+@> for % 5 ES3c So. In this speci¿cation > is the mortality hazard prevailing in the age
interval ES3c So, ' c c g, and @E+@ is the factor of proportionality for individuals with
characteristics+@. Denote as r `E%the corresponding survival function at age%. The observed
hazard at age%in a heterogeneous population with Gamma-distributed relative frailty then equals
7
> `E% ' @E+@>
E@E+@j2*L}r `E% for%5ES3c So (12)
Because of the numerical dif¿culties in estimating this piecewise-constant hazard function via
maximum likelihood in the presence of many age-intervals and large data, we implement a slight
approximation to the hazard function (12). In particular, the dif¿culties in the estimation arise
because the hazard>7 `E% is not constant within age intervals. This results from the fact that
the value of the survival functionr `E%in the denominator declines with age%. For suf¿ciently
small age-intervals, however, the effect of this changing value of the survival function on the
observed hazard>7 `E%within an age interval is small. The piecewise-constant hazard function
with relative frailty can therefore be approximated by replacing the value of the survival function
r `E%in (12) with the value of the survival function at the mid-point of each age-interval. With
this approximation, the observed hazard>7 `E% is constant within age intervals and the MLE
estimation is substantially simpli¿ed. We estimate this piecewise-constant hazard model with a
References
Baltes, M. M., A. M. Freund, and A. L. Horgas (1999). Men and women in the Berlin aging
study. In P. B. Baltes and K. U. Mayer (Eds.), The Berlin Aging Study. Aging from 70 to 100,
pp. 259–281. Cambridge: Cambridge University Press.
Barker, D. J. P. (1992). Fetal and Infant Origins of Adult Disease. London: Britisch Medical
Journal.
Carey, J. R. and D. S. Judge (2000). Mortality dynamics of aging. Generations - Journal of the
American Society on Aging 24(1), 19–24.
Carey, J. R. and P. Liedo (1995). Sex-speci¿c life table aging rates in large medÀy cohorts.
Exper-imental Gerontology 30(3/4), 315–325.
Carnes, B. A., S. J. Olshansky, and D. Grahn (1996). Continuing the search for a law of mortality.
Population and Development Review 22(2), 231–264.
Caselli, G., J. W. Vaupel, and A. I. Yashin (2000). Longevity, heterogeneity and selection. Paper
presented at the XL Riunione Scienti¿ca della Societa Italianà di Statistica, Florence, April
26–28.
Christensen, K., M. Kristiansen, H. Hagen-Larsen, A. Skytthe, L. Bathum, B. Jeune, K.
Andersen-Ranberg, J. W. Vaupel, and K. H. Orstavik (2000). X-linked genetic factors regulate
hematopoi-etic stem-cell kinhematopoi-etics in females. Blood 95(7), 2449–2451.
DeMoivre, A. (1725). Annuities on Lives: Or, the Valuation of Annuities Upon Any Number of
Livesas also of Reversions. London.
Doblhammer, G. (1999). Longevity and month of birth: Evidence from Austria
and Denmark. Demographic Research [Online] Available
http://www.demographic-research.org/Volumes/Vol1/3 1(3).
Elo, I. T. and S. H. Preston (1992). Effects of early-life conditions on adult mortality: A review.
Population Index 58(2), 186–212.
Gavrilov, L. A. and N. S. Gavrilova (1991). The Biology of Life Span. A Quantitative Approach.