Divided attention, selective attention and drawing: Processing preferences in Williams
syndrome are dependent on the task administered
Emily K. Farran
University of Reading
Christopher Jarrold University of Bristol
Susan E. Gathercole University of Durham
Address correspondence to:
Emily Farran
Department of Psychology University of Reading Earley Gate
Reading RG6 6AL UK
Tel: +44 (0)118 987 5123 x7531 Fax: +44 (0)118 931 6715
E-mail: [email protected]
Abstract
The visuo-spatial abilities of individuals with Williams syndrome (WS) have
consistently been shown to be generally weak. These poor visuo-spatial abilities have been ascribed to a local processing bias by some [30] and conversely, to a global
processing bias by others [24]. In this study, two identification versions and one drawing version of the Navon hierarchical processing task, a non-verbal task, were employed to investigate this apparent contradiction. The two identification tasks were
administered to 21 individuals with WS, 21 typically developing individuals, matched by non-verbal ability, and 21 adult participants matched to the WS group by mean
chronological age. The third, drawing task was administered to the WS group and the TD controls only. It was hypothesised that the WS group would show differential processing biases depending on the type of processing the task was measuring.
Results from two identification versions of the Navon task measuring divided and selective attention showed that the WS group experienced equal interference from
global to local as from local to global levels, and did not show an advantage of one level over another. This pattern of performance was broadly comparable to that of the control groups. The third task, a drawing version of the Navon task, revealed that
individuals with WS were significantly better at drawing the local form in comparison to the global figure, whereas the typically developing control group did not show a
bias towards either level. In summary, this study demonstrates that individuals with WS do not have a local or a global processing bias when asked to identify stimuli, but do show a local bias in their drawing abilities. This contrast may explain the
apparently contrasting findings from previous studies.
Divided attention, selective attention and drawing: Processing preferences in Williams syndrome are dependent on the task administered
Introduction
Individuals with Williams syndrome (WS) have poor visuo-spatial skills in
relation to other cognitive abilities [1, 6, 8, 9, 11, 14]. Based on previous research, it has been theorised that these individuals perceive the local and global aspects of visuo-spatial information in a manner that deviates from typical development. Local
processing refers to the perception of the individual elements of an image, whilst attending to the image as a whole figure is referred to as global processing. In typical
development, adults and older children process information at the global level faster than at the local level, thus global information is available before local information. This is known as the global precedence effect [21, 22]. It has been suggested that
individuals with WS do not show global precedence, but instead are biased towards processing the local elements of an image at the expense of the global form [3].
This proposal appears to be supported by observations of the nature of the errors made in visuo-spatial tasks. Individuals with WS show poor global organisation in the Block Design task [3] and similarly, their drawings consist of the individual
details of the image [4, 30], without being organised into a coherent global structure, thus apparently pointing towards a preference to perceive at the local level. However,
Pani, Mervis, and Robinson [24] found that in a visual search task, 12 adults with WS were influenced by the grouping of the stimuli to the same extent as a typically developing (TD) control group matched by gender and chronological age (CA). This
suggests that individuals with WS do exhibit global precedence in visual search. The different interpretations of WS performance among the visuo-spatial tasks
the task administered. The performance of individuals with WS on a task that requires the participant to identify stimuli show a different pattern of processing to the
performance observed on a visuo-spatial construction or drawing task. This difference in the task demands has not always been taken into account when interpreting results.
Task demands must also be accounted for within a task. A bias in local processing has been suggested to explain both an exceptionally poor level of performance on the Block Design task in WS, but to explain a superior level of
performance on the same task in autism [32]. The local bias on this task is apparent when identifying component parts in individuals with autism, but, as discussed above,
occurs at the stage of constructing the image in individuals with WS. In the present study, versions of the same task are employed in which identification, and image production through drawing are investigated separately. Patterns of performance can
then be associated with the appropriate task demand, identification or production. In addition to the problem of task demands, consensus has not been reached regarding the precise definition of „local‟, „global‟, and associated terms. Global
precedence is considered by many to be a modern version of the Gestaltist claim of primacy of wholistic processing in perception, i.e., that global properties, rather than
the component parts of that object, are the initial step for processing an object [e.g., 27, 37]. As such, the terms wholistic and global processing are often used
interchangeably. However, the term wholistic is also linked to the distinction between integrality and separability. In this sense, wholistic has a subtle but important different definition in which the properties of an object hold no weight in processing at all.
Solely the terms local and global will be employed for discussion in the present study. The use of local and global refers here to the notion that a visual scene
the structure of a scene dictates it‟s globality, i.e., it is global to a property lower
down the hierarchy, but local to a property at a higher hierarchical level. Three
versions of the Navon task [21] are employed. This task has been chosen because it has two distinct hierarchical levels, global and local. Individuals are presented with hierarchical figures, which are letters, e.g., a number of letter H‟s arranged to form a
letter A. Letters at both hierarchical levels are equally recognisable and complex, and thus equally codable. Identification of one level does not provide any information
about the identification of the other level, hence any differences in accuracy, or response time can be assumed to be accountable to hierarchical differences [21].
Four studies have investigated hierarchical processing in WS, typically employing the drawing version of the Navon task. Rossen et al. [30] and Birhle et al. [4] demonstrated that individuals with WS were more accurate at drawing the local
elements of the images (small letters) in comparison to the global formation (larger letter). Bellugi et al. [3] report similar findings from their group of individuals with
WS when asked to draw hierarchical figures of triangles made up of circles (a task taken from the Boston Diagnostic Aphasia Examination (BDAE) [10]). Accuracy was higher for their reproduction of the local forms than for the global whole.
The results of Stevens [34] are less in favour of a local bias in WS drawing than the three studies described above. Five out of 13 individuals with WS showed a
local bias in a Navon drawing task. In a second experiment, the motor response was omitted, by asking participants to describe the stimuli. All individuals with WS were able to describe both local and global levels of the stimuli. Stevens suggests that the
An individual‟s ability to identify a stimulus can also be directly investigated
by employing a decision making task in which individuals have to indicate whether a
particular letter is present at either the local or global level. Plaisted, Swettenham and Rees [26] employed the Navon task with individuals with autism through two
decision making tasks, one requiring selective attention and the other requiring divided attention. In the selective attention task, the individual completed two conditions, in which they were asked either to respond to the large letter (global
level), or to respond to the smaller letters (local level). Thus, participants only needed to focus on one level, local or global, in any one condition. In the divided attention
task, the individual was asked to respond to a target letter, which could appear at the local level, the global level or at both levels. In this task participants were required to attend to both levels simultaneously in order to identify the target. Plaisted et al. [26]
showed that the local bias typical of individuals with autism [13] was not present in the selective attention task, but was present in the divided attention task. The authors
conclude that when primed to focus on a particular level, individuals with autism can process at the global level. The local bias in autism appears to be restricted to cases when individuals are unable to focus their attention on one level.
In typically developing adults, these tasks illustrate the global precedence effect. Global precedence does not become fully apparent until late childhood, and
young children exhibit less of a bias towards processing at either global or local level [18]. In the selective attention task, global precedence is observed if targets at the global level are responded to faster than at the local level. In addition, when the target
is at the local level, the letters at the global level should interfere with response time and accuracy. In the divided attention task, according to global precedence, targets at
level. Similarly, response time should be faster, and accuracy greater in trials where the target is present at the local level only, than those where the target appears at both
levels. In contrast, no difference should be observed between trials where the target appears at the global level only in comparison to its appearance at both levels.
The selective attention task serves to indicate whether the participant is capable of processing exclusively at the local and at the global level. The divided attention task has the additional demand of requiring the individual to make
within-task switches of attention between processing levels. The results of this within-task indicate an individual‟s processing preferences. The present experiment examines the
identification of hierarchical figures in WS using tasks adapted from those employed by Plaisted et al. [26]. In light of Stevens‟ [34] Navon task study, and Pani et al.‟s [24] visual search study, it is possible that individuals with WS do not have a local
bias when asked to identify stimuli. If so, then they should perform similarly to typically developing controls, or to adult controls on these tasks.
A third task, a drawing version of the Navon task, was also employed in this study. This acted as a comparison task to the identification tasks (selective and divided attention) and thus was employed to assess whether any bias observed in
drawing is related to the process of letter identification, or if it is a result of the additional requirements of drawing such as a problem with motor planning [34] or
stimulus integration. Tada and Stiles [35] investigated drawing development in terms of the ability to segment objects into local units, and to integrate these units into a drawing. They found that young children segment objects into smaller, and more
local units than adults. The organisation of these parts when drawing the object is also less well integrated in young children than in adults, shown by a reduced global
reported a further investigation by Stiles, which tracked the developmental trajectory of local and global ability in the drawings of Navon figures of children aged 4 to 8
years. The youngest children achieved local scores which were 0.2 higher than global scores. At 5 years, local processing was 0.5 greater than global processing. By 8 years
the scores at each level had equalled out. One can predict from the evidence above that the drawings of the TD group will not demonstrate global precedence, but will show a pattern which is between that of the 5 year old and the 8 year old groups
reported by Stevens [34] i.e., no advantage of global over local processing.
Due to the unique cognitive profile of individuals with WS, the control group
in the present study are matched individually to the WS group by performance on the Ravens Coloured Progressive Matrices (RCPM; [28]), an accepted measure of fluid intelligence [39]. As such, performance can be assumed to be an appropriate
representation of general nonverbal ability. One potential problem of matching by nonverbal ability is that of matching away group differences. The RCPM test manual reports that 3 out of the 36 trials involve the perception of “gestalt formation” (pp. 5)
[29]. Global and local processing is therefore involved in this task, but it is not a major variable of the complete set of items. In addition, the RCPM gives an absolute
level of performance, whilst the present study is interested in the relative pattern of local and global ability. Even if matching for RCPM equates groups on their
performance on one task, it is still perfectly possible for them to differ on another; indeed arguably the most sensitive test for a difference in relative task difficulty is provided when groups are closely matched for overall level of performance. The local
and global aspects of the RCPM are therefore irrelevant to the local and global comparison being made within the experimental tasks. The RCPM is successfully
processing [e.g., 31]. Such studies have shown group differences, which suggests that the danger of matching away differences is minimal.
The evidence reported above suggests that in typical development the pattern of performance on the identification tasks should show global precedence, whilst due
to poor integration skills in children, performance on the drawing task should
demonstrate no advantage of global over local processing. Comparisons can be made between the WS group and the controls for each task. The same stimuli were
employed across the tasks, and any group differences observed will indicate the stage at which processing becomes atypical in WS. From the evidence discussed it is
expected that the WS group will show a deviation from typical development on the drawing task but not the identification tasks.
Method Participants
Twenty–one individuals with WS (11 males and 10 females), 21 typically developing children (7 males and 14 females), and 21 adult participants (4 males, 17 females) participated in this experiment. Each of these participants was able to
recognise the letters of the alphabet. The typically developing children were matched individually to the WS group by performance on the Ravens Coloured Progressive
Matrices (RCPM) [28]. In this task, the participant must decide which of 6 pieces matches the pattern or follows the correct sequence shown in a presented image. The adult group, while not matched individually, were matched to the WS group by mean
Chronological Age (CA). The RCPM was not given to the adult group as the CA of these participants was above the upper age limit of the test (18 years). Participant
All WS participants had been recruited from the records of the Williams Syndrome Foundation UK. Six members of the WS group had received a diagnostic
(FISH) test. This test checks for a deletion of the elastin gene on the long arm of chromosome 7 which has been found to occur in approximately 90% of individuals
with WS [23]. The elastin gene itself, however, is not related to the Williams syndrome cognitive phenotype, and the genetic deletion accountable to cognitive abilities has as yet not been identified [36]. It is therefore important that any positive
genetic evidence for WS is supported by phenotypic characteristics. All 6 cases received positive FISH results, thus confirming a deletion of the elastin gene. None of
the WS participants had received negative FISH results. The remaining fifteen WS participants had been diagnosed by medical practitioners before the WS genotype had been identified. This diagnosis was based on their unique cognitive, behavioural and
facial characteristics. Previous investigation employing the same sample showed that the cognitive characteristics typical of Williams syndrome are present in this group.
Each of these individuals demonstrated superior performance on the British Picture vocabulary Scale (BPVS) [7] relative to the Performance subtests of the Wechsler Intelligence Scale for Children (WISC) [38]. Within the WISC subtests, performance
was weakest on the Block Design task. Thus, one can be confident that the risk of including an individual who would not show the genetic deletion if tested, is minimal.
Table 1 about here Design and Procedure
The stimuli used across all of the experimental tasks consisted of a large letter
made up of 20 smaller letters, such as an A made up of Hs as illustrated in Figure 1. Two identification tasks and one drawing task were employed. All three participant groups took part in the 2 letter identification tasks. The drawing task was carried out
designed to match the level of ability of the WS group, and as such the performance of the adult participants on this task was predicted to be at ceiling.
Identification tasks
Both the selective attention and the divided attention tasks were presented on a
computer screen. Participants sat in front of the computer and given verbal instructions. Each task was preceded by practice trials, which began when the experimenter was confident that the participant understood the procedure and were
able to recognise the target letter. Participants were asked to rest their forefingers on the appropriate response keys in-between responses. Hierarchical letters appeared in
the centre of the monitor and only disappeared once a correct response had been made. This was followed by a delay of 500ms before the next stimulus appeared. The computer recorded response time (RT) for all responses. In the event of an error, RT
for both the incorrect response, and the subsequent correct response was recorded. Selective attention task: There were two separate conditions to this task. In
one condition the participant was asked to identify the small letter, and in the other condition the participants were asked to identify the large letter. The letters to identify were S and H in both conditions, thus the participant was instructed to press the appropriate „S‟ or „H‟ key to indicate their response. There were 6 stimuli types in
each condition: 2 congruent (the same letter was depicted at local and global levels), 2
incongruent (an S at one level and an H at the other hierarchical level), and 2 neutral (an S or H at the level being attended to, and an X at the other level). These can be seen in Figure 2. Each condition had 30 randomised experimental trials and was
Divided attention task: In this task, the participant was requested to press „A‟ if they saw the letter A and „’‟ if they did not see the letter A. The letter A could
appear as the large letter, or as the small letters, or as both simultaneously. There were 6 trial types presented, half of which depicted a letter A - the target present trials, and
half of which did not - the target absent trials. In the target present trials, the letter A was present either at both levels (a large A made up of 20 smaller As), at the local level (a large M made up of small As), or at the global level (a large A made of small
Ms). These 3 stimuli and the 3 target absent stimuli are shown in Figure 1. There were 12 practise trials, 2 of each stimulus type, and 60 randomised experimental trials, 10
of each stimulus type. This task was administered before the selective attention task.
Figures 1 and 2
about here
Drawing task: Participants (WS and TD controls only) were shown a
hierarchical figure such as those in Figures 1 and 2, presented in an A5 booklet. The figures used were HA (a larger H made up of 20 small As), AH, AA, HH, XS, SX, SS, XX presented in that order. The experimenter emphasised to the participant that
the stimulus was a large letter made up of small letters, and that they were required to copy the figure as accurately as possible onto an A5 piece of white paper. The figure
remained in front of the participant throughout. Time to draw the figures was recorded using a stopwatch. This task was presented after the two identification tasks.
Drawings were rated for local level accuracy, and for global level accuracy.
The rating scale employed was based on that of Stiles as cited in Stevens [34]. This provided criteria for rating the local and global accuracy of drawings from 0 to 5.
High global scores were given to drawings that represented the configural form accurately and at the correct orientation. The number of local elements would have to be approximately correct, and correctly spaced. Low global scores would be given
participants would have to draw a figure where the local elements were correctly oriented and well drawn. The correct number and spacing of the elements was also
important. Low local scores were given to drawings where either the global form was drawn but with no elements, or the elements were not recognisable.
Results Identification tasks Selective Attention task
Analysis of RT.
Reaction time for correct responses on the initial key press were analysed
using a 3 way ANOVA with hierarchical level (large/ global or small/ local ) and congruency (congruent, incongruent and neutral) as within-participant factors, and group (WS, TD controls, adult controls) as a between-participant factor (see Figure
3). There was a main effect of group (F(1, 60)=23.05, p<.001, partial 2=.43), which
post hoc Tukey analysis revealed, was due to significantly faster responses from the adult controls than the TD controls (p<.001) and the WS group (p=.001). There was a
significant main effect of congruency (F(2, 120)=20.77, p<0.001, partial 2=.26). This
was a result of significantly slower responses on the incongruent trials than on the
congruent trials (F(1, 60)=19.98, p<.001, partial 2=.25) and neutral trials (F(1,
60)=33.49, p<.001, partial 2=.36). The main effect of hierarchical level was also
significant (F(1,60)=5.27, p=.03, partial 2=.08) due to slower responses on the small
/local condition than the large/ global condition. The interaction between group and
congruency was significant (F(4, 120)=6.42, p<.001, partial 2=.18). Further analysis
demonstrated that this was due to a different pattern of congruency in the adult group than the WS and TD control group. All three participant groups showed significantly
partial 2=.47; TD: F(1, 20)=12.39, p=.002, partial 2=.38; adults: F(1, 20)=10.59,
p=.004, partial 2=.35). However, the adult group responded more rapidly to
congruent trials than neutral trials (F(1, 20)=13.99, p=.001, partial 2=.41), when no
such difference was observed in the WS group (F<1) or the TD control group (F<1).
In addition, the adult group showed no significant difference between congruent and
incongruent response times (F(1, 20)=3.79, p=.07, partial 2=.16) whilst the WS and
TD controls were significantly slower at responding to incongruent trials than
congruent trials (WS: F(1, 20)=10.58, p=.004, partial 2=.35; TD: F(1, 20)=18.38,
p<.001, partial 2=.48). The interaction between hierarchical level and congruency
was also significant (F(2, 120)=3.52, p=.03, partial 2=.06). This was due to a smaller
effect of congruency for the large/ global condition (F(2, 120)=5.33, p=.01, partial
2
=.08) than the small/ local condition (F(2, 120)=15.06, p<.001, partial 2=.20),
although both of these effects of congruency showed a similar pattern
(congruent<incongruent: large/ global condition: t(62)=2.20, p=.03; small/ local condition: t(62)=3.67, p=/001, neutral< incongruent: large/ global condition:
t(62)=2.89, p=.01; small/ local condition: t(62)=4.27, p<.001, congruent=neutral: larger/ global condition: t(62)=.43, p=.67; small/ local condition: t(62)=.75, p=.45). There were no significant interactions between hierarchical level and group (F<1) or
between hierarchical level, congruency, and group (F(4, 120)=1.66, p=.17, partial
2
=.05).
Figure 3 about here
Analysis of correct responses.
Number of correct responses on the selective attention task were analysed
These data, illustrated in Figure 4, show that the main effect of group was significant
(F(1, 60)=11.51, p<.001, partial 2=.28) . Post hoc Tukey analysis showed that adults
were producing more correct responses than both the WS participants (p<.001) and
the TD controls (p=.04). Individuals with WS also tended to make more errors than typically developing individuals (p=.06). As above, there was a significant main
effect of congruency (F(2, 120)=30.54, p<0.001, partial 2=.34). Significantly more
correct responses were made on the congruent trials than the incongruent trials (F(1,
60)=41.52, p<0.001, partial 2=.41) and the neutral trials (F(1, 60)=4.72, p=.03,
partial 2=.07). Responses for neutral trials were also significantly more accurate than
incongruent trials (F(,1 60)=28.21, p<0.001, partial 2=.32). There was a
nonsignificant main effect of level (F<1). The interaction between congruency and
group was significant (F(2, 120)=4.63, p=.002, partial 2=.13). The source of this
interaction was a weaker effect of congruency in the adult group (F(2, 40)=3.33,
p=.05, partial 2=.14), than the WS group (F(2, 40)=13.20, p<.001, partial 2=.40) or
the TD controls (F(2, 40)=15.89, p<.001, partial 2=.44). The remaining interactions
were not significant: hierarchical level by group (F<1); hierarchical level by
congruency (F(2,80)=1.10, p=.34, partial 2=.03).
Figure 4 about here Divided Attention task
Analysis of RT.
Reaction times for only those responses where the first key press was correct
were analysed using a 2 way ANOVA design with hierarchical level as a within-participant factor with 3 levels (congruent, incongruent/ global and incongruent/ local) and group as a between-participant factor with 3 levels (WS and TD controls,
from target absent trials. No difference was expected between the three levels for target absent conditions because although the letter K appeared in all three level types,
participants were never asked to identify it. Results showed that there was a significant main effect of group for target absent trials (F(1, 60) = 7.94, p=.001,
partial 2=.21 ). Post-hoc Tukey analysis showed that this was due to the WS group
taking significantly longer to respond than the adult controls (p=.001). There was no difference in the RTs of the adult controls and the TD controls (p=.12) or the WS group and the TD group (p=.12). The main effect of hierarchical level was not
significant for target absent trials (F<1), and there was no significant interaction between condition and group (F<1).
The data for target present trials are illustrated in Figure 5. Analysis showed that there was a significant main effect of group, F(1, 60)=29.87, p<.001, partial
2
=.50. Post-hoc Tukey comparisons revealed that this was due to the adult control
group responding significantly faster than the remaining two groups (adult controls and WS: p<.001; adult controls and TD controls: p<.001; WS and TD controls: p=.59). There was a significant main effect of hierarchical level (F(2, 120)=7.28,
p=.001, partial 2=.11). This was due to significantly quicker correct responses to
targets in the congruent condition than the incongruent/global condition (F(1,
60)=22.46, p<.001, partial 2=.27 ) and the incongruent/local condition (F(1,
60)=10.46, p=.002, partial 2=.15). There was also a significant hierarchical level by
group interaction (F(4, 120)=3.26, p=.01, partial 2=.10). This was due to the TD
controls showing a different pattern of performance across hierarchical levels than the WS and adult control group (effect of hierarchical level; TD: F(2,40)=3.75, p=.03,
partial 2=.16; WS: F(2, 40)=4.81, p=.01, partial 2=.19; adult controls: F(2,
adult control group revealed quicker correct responses on the congruent conditions
than both the incongruent/global (WS: F(1, 20)=10.02, p=.01, partial 2=.33; adult
controls: F(1, 20)=19.65, p<.001, partial 2=.50) and the incongruent/local conditions
(WS: F(1, 20)=8.17, p=.01, partial 2=.29; adult controls: F(1, 20)=7.69, p=.01,
partial 2=.28). In comparison, the TD group were significantly quicker on the
congruent condition than the incongruent/global condition (F(1, 20)=6.46, p=.02,
partial 2=.24) but not the incongruent/local condition (F<1). None of the three
groups showed a difference in RT between the incongruent/ global and
incongruent/local trials (WS: F(1, 20)=1.23, p=.28, partial 2=.06; TD: F(1, 20)=3.08,
p=.09, partial 2=.13; adult controls: F(1, 20)=2.00, p=.17, partial 2=.09 ).
Figure 5 about here
Analysis of correct responses.
The number of correct responses, for the initial key press only of each trial, for both target present and target absent trials were analysed by separate 2-way
ANOVAs, each with hierarchical level as a within-participant factor with 3 levels (congruent, incongruent/global, incongruent/local) and group as a between-participant
factor. In the analysis of target absent trials there was a significant main effect of
group (F(1,60)=6.08, p=.004, partial 2=.17). Post-hoc Tukey comparisons showed
that this was due to more correct responses from the adult controls than the WS group
(p=.003). No differences were revealed between the number of correct responses from the TD and adult control groups (p=.11), or the TD and WS groups (p=.33). There
was no main effect of hierarchical level (F(2, 120)=1.75, p=.18, partial 2=.03 ). The
interaction between hierarchical level and group was not significant (F(4, 120)=1.04,
The data for target present trials only are illustrated in Figure 6. Analysis of the target present trials demonstrated a significant main effect of group (F(1,
60)=3.67, p=.03, partial 2=.11). As above, post hoc analysis by Tukey comparison
showed that this was due to the adult controls producing more correct responses than the WS group (p=.03). No significant differences were revealed in the remaining
comparisons (WS and TD: p=.76; TD and adults: p=.15). The main effect of
hierarchical level was also significant (F(2,120)=4.59, p=.02, partial 2=.06). This
was due to the fact that more correct responses were given to the congruent trials than
the incongruent/ global trials (F(1, 60)=6.92, p=.01, partial 2=.10). There was no
significant difference between responses to congruent and incongruent/ local trials
(F(1, 60)=2.29, p=.14, partial 2=.04), or responses to incongruent/ global and
incongruent/ local trials (F(1, 60)=1.92, p=.17, partial 2=.03). The hierarchical level
by group interaction did not approach significant (F<1).
Figure 6 about here
Drawing task
Each participant‟s drawings were given two scores, one for local level
accuracy and one for global level accuracy. All of the drawings were rated by the experimenter; a second independent judge who was blind to the participants‟
identities rated the drawings of 2 individuals with WS and 2 control individuals. Inter-rater reliability was entirely satisfactory (Cohen‟s Kappa = 0.51, z=5.78, p<.01; [33]
pp. 284-291). A 2-way ANOVA analysis with local and global accuracy as the within-participant factor (2 levels: local and global ) and group as a
between-participant factor (2 levels: WS and TD) was carried out on these scores. This showed
WS group performing significantly below the TD controls. A main effect of local-global accuracy reflected significantly poorer local-global level accuracy than local level
accuracy overall: F(1, 40)=30.44, p<.001 (partial 2 = .43). Importantly there was a
significant interaction between local-global accuracy and group: F(1, 40) = 25.00,
p<.001 (partial 2 =.39). This reflected that the WS group had significantly poorer
global level accuracy than local level accuracy F(1, 20)=41.84,p<.001 (partial 2 =
.68), in comparison to the TD group who did not show a significant difference
between local and global levels of accuracy: F<1. T-tests comparing the performance of the two groups at each level revealed a smaller significant difference at the local
level: t(20)=2.08, p=.05, than at the global level: t(20)=4.61, p<.001 due to the WS group achieving lower scores than the TD controls at both levels, but particularly the global level (see Figure 7).
To investigate the possibility that any difference between local and global accuracy was an artefact of using different scoring systems, further analysis was
carried out using standardised data. Z-scores were calculated based on the mean and standard deviation of the complete set of scores (global and local) of the TD control
group. By transforming the data in this way, the performance of the TD group now provides a baseline in which any differences in the scoring systems have been removed. Performance of the WS group has thus been standardised relative to this
baseline. The results of a 2 way ANOVA were similar to those from the original data.
There was a main effect of group, (F(1, 40)=15.76, p<.001 (partial 2=.28). Global
accuracy was poorer than local level accuracy, as shown by a main effect of
local-global accuracy, F(1, 40)=30.48, p<.001 (partial 2 = .43). Crucially, the interaction
between group and accuracy also remained significant, F(1, 40) =25.15, p<.001
different levels of accuracy in the WS group: t(20)=6.48, p<.001. Due to the method of standardisation, a comparison of global and local accuracy in the TD group showed
no significant difference: t(20)=.44, p=.67.
Figure 7 about here
Discussion
The aim of this study was to investigate whether the bias toward drawing local
elements seen in WS is a product of a local processing bias at the level of stimulus identification which is a more perceptual processing requirement, or instead results from a bias acting somewhere beyond identification, where the reproduction of
elements is required. This study directly measured the identification of Navon figures and compared this to the ability to draw these figures among individuals with WS. As
the diagnosis of 15 of the individuals with WS did not include FISH testing, there is a slight possibility that these individuals do not have WS. However, the results showed clear differences between the WS and the controls which strongly suggests that all of
the WS group were correctly diagnosed. Individuals with WS did not exhibit a local bias in stimulus identification, but did show evidence of a local bias in drawing.
The inclusion of two control groups enables one compare WS performance to that expected by their overall level of nonverbal ability and to that expected by their CA. The relative levels of global and local performance could be compared across the
groups. Differences in patterns of performance between the two control groups serves to indicate developmental changes in hierarchical processing which occur in typical
development. The patterns of performance of the WS group can then be assessed as being commensurate to their general level of nonverbal ability, or to their CA, or as deviating from the patterns of performance of both of the control groups, and hence
The levels of ability across the three participant groups differed significantly in both selective and divided attention. The adult control group were performing at a
higher level than the WS group and the TD controls. This was true of both RT and correct response data. This result demonstrates the sensitivity of these tasks in
detecting the range in levels of ability of the participant groups. In contrast, there were no differences in the level of ability of the WS group and the TD controls, thus one can conclude that in both of the identification tasks, individuals with WS
demonstrated a level of ability which was below that expected of their CA, and which was comparable to their general level of nonverbal ability as measured by the RCPM.
The patterns of performance of the three participant groups on the
identification Navon tasks are described in terms of the overall performance of the three groups, before discussing any differences observed between the groups. The
global precedence hypothesis predicts global advantage and global interference. In the selective attention task there were two conditions, one in which the individual was
required to attend to the global level, in this case the large letter, and a second condition in which the participant attended to the local level, i.e., the small letters (Figure 2). A global advantage effect would be evidenced by quicker/ more accurate
responses in the large letter/ global condition when compared to the small letter/ local condition. This was shown in the RT data, but not in the analysis of the number of
correct responses, and thus shows some support for a global advantage effect in selective attention. Global interference was demonstrated by slower responses to incongruent than congruent in the small letter/ local conditions. However, a similar
pattern was observed in the large letter condition, suggesting that interference was not specific to global interference only. Therefore, there is some evidence of global
The group differences observed in performance on the selective attention task indicated that the TD group and the adult controls showed slightly different patterns
of processing. The pattern of the WS group resembled that of the TD group. This reflected, first that the individuals with WS were behaving in a manner appropriate for
their general nonverbal abilities, rather than their CA. Second, individuals with WS were able to focus on the global level when primed to do so. This is contrary to the predictions made by the local processing hypothesis. In the analysis of RT the effect
of congruency of the TD controls, and also the WS group, was stronger than that of the adult group. This difference between the control groups suggests that the ability to
inhibit unattended information may be more developed in adults than children, and hence interference is less pronounced in adulthood. This is supported by the analysis of correct responses. Whereas the TD controls and the WS group demonstrated
interference, the adult group did not show interference from incongruent trials. However, note that the adult group performed very well on this task; accuracy means
fell close to the maximum score of 10. In light of this, the group difference in the effect of congruency in this analysis could reflect ceiling effects in the adult controls.
The results of the divided attention task show less evidence of global
precedence. Accuracy was poorer, and RTs were slower, for the incongruent/ global stimuli than for congruent stimuli. Comparison between responses to incongruent/
local stimuli and congruent stimuli revealed slower responses on incongruent/ local trials, but no difference in the number of correct responses between the two types of trial. This pattern of results indicates that performance is impaired on incongruent
lack of global interference in the correct response data, one could suggest that local interference is slightly stronger than global interference across the participants.
The levels of performance on the incongruent/ local and the incongruent/ global trials were equivalent to one another in both the RT and the correct response
data. This indicates that across the three groups, interference was not solely from global input when processing local level information, as would be expected if
participants were exhibiting global precedence, but occurred in both directions. Thus,
overall there was no support for a specific advantage of global information, or of interference occurring only from global information, as would be expected if global
precedence was apparent.
The group differences in the divided attention task were evident in the RT data only. It appeared that a similar pattern of performance was followed by the WS group
and the adult controls, i.e., no global advantage, and interference in both directions. The nature of interference experienced by the TD group was slightly different.
Significant levels of interference occurred from local information only, thus showing some evidence of a local processing preference in this group. This could be an artefact of the lower level of development of the TD controls; previous research has shown
that younger children are less likely to show global precedence, and show some signs of local precedence [18]. However, as this group difference was not supported by the
correct response data, it cannot be taken as strong evidence for a local level bias in the younger controls. The pattern of performance of the WS group on the divided
attention task, therefore, appears to be entirely typical. It resembles that of the adult
controls, and also, for the most part, that of the TD control group. Thus, in light of the group differences in level of ability, one can conclude that in this task, the
Pani et al. [24] present an alternative account for the difficulties in visuo-spatial processing in WS. They suggest that individuals with WS find it difficult to
switch between hierarchical levels. The divided attention task presented here, requires an individual to do just that. Problems with switching between levels would be shown
by much higher levels of interference across levels than the controls. This was not the case, thus the current experimental findings cannot support Pani‟s hypothesis.
Despite similar patterns of performance across the three participant groups,
global precedence was not observed on the divided attention task, and there was only weak evidence of global precedence in selective attention. This contrasts to the results
of Plaisted et al., in which the TD control group did show global precedence.
However, the TD control group employed for the present study were younger and had less developed levels of non-verbal ability than the controls employed by Plaisted et
al [26]. As such, they were less likely to show global precedence [18].
One might predict that the performance of the adult control group would show
evidence of global precedence, but this did not occur. Previous research has shown that by increasing the spatial frequency of the local level letters in Navon tasks (using more, and smaller, „small‟ letters to make up the „large‟ letter), the task becomes more
demanding and that the effect of global interference and global advantage are more likely to be demonstrated [17]. In the present study, the tasks employed stimuli with a
larger spatial frequency than those used by Plaisted et al. [26] which could explain the differential effects of congruency in their study and this study. Larger spatial
frequencies were used in this study for two reasons. First, the tasks had to be set at a
level which elicited satisfactory task completion by the individuals with WS. Second, the stimuli used across identification and drawing tasks had to be equivalent. In the
spatial frequency at the local level to reduce the risk of floor effects. As a
consequence, due to the fact that the WS group were behaving at a level which was
significantly below that of their CA, the identification tasks were not set at an optimum level to elicit global precedence from the adult control group.
Further consideration of the argument made above could lead to the suggestion that the identification tasks were not sensitive enough to elicit a local processing bias from the WS participants, and that one cannot rule out the possibility
of a local processing bias in WS at the level of stimulus identification. However, the results suggest that the tasks did not lack sensitivity. This is demonstrated by a
difference between the TD and the adult control group in their levels and patterns of performance. The correct response data from the adult group may be subject to ceiling effects, and therefore the RT data is a more reliable measure of adult performance.
The adult group showed significantly higher levels of performance than the younger control group. In addition, although the problem of ceiling effects must be kept in
mind, it appears that the stimuli affected the patterns of performance of the adult control group in a manner which was different to the effect of the stimuli on the TD control group. It appears then, that had a local processing bias been present in the WS
group, this would have been reflected in their pattern of performance.
It appears that previous research made the assumption that a local bias in
drawing is also present on tasks which are predominantly perceptual in nature (e.g., [3, 30]). According to this account, one would expect that individuals with WS would show deviant performance, reflected by either local precedence in both divided and
selective attention tasks, or a local bias in divided attention, but global precedence in the selective attention task, as seen is autism [26]. However, the two identification
performance which is equivalent to their overall non-verbal level of ability. This demonstrates that individuals with WS do not deviate from typical development in
their patterns of performance on decision making hierarchical processing tasks. These results, therefore, cannot support the hypothesis that individuals with WS have a
general preference to process information at the local level.
The similarities in the patterns of performance of the WS and control groups contrast sharply with the differences that emerged on the drawing task that was given
to the WS group and the TD controls. As in the previous research, this shows strong evidence for a bias towards drawing the local elements at the expense of the global
form in WS. This did not occur in the TD group who did not show a preference for drawing either the local or the global form. The results imply that in WS, although the local components of the Navon figures are more salient when drawing, this is not the
result of a local bias at stimulus identification, i.e., the more perceptual level. This has important implications for the claims made in previous research where difficulties in
tasks such as constructional and pencil and paper tasks are attributed to abnormalities in the perceptual identification of the local and global aspects of stimuli.
Drawing and construction differ from perception due to the fact that they
necessitate the partitioning of a whole figure into parts. In order to obtain the correct global formation, the participant must not only produce each part correctly, but each
part must be produced with the correct spatial relation to the other parts of the image. Thus, in addition to identifying the parts and whole, as has been emphasised in the previous studies mentioned [3, 30], it is important to note the relationship between the
disorganised, piecemeal drawing.” (p.469) which appears to relate to the type of
drawings produced by individuals with WS (see Figure 8).
The suggestion made above that spatial relations are impaired in WS is supported by recent evidence that has shown that the comprehension of spatial language used to classify spatial relations such as “in”, “on”, and “behind” is
impaired in WS [25]. Thus, it appears that a poor ability to encode spatial relations results in the impairment in drawing and construction observed in individuals with
WS. It does not however affect performance on more perceptual tasks. This can be explained in relation to the spatial analysis necessary for producing an image. Tada and Stiles [35] describe „spatial analysis‟ in drawing as two separable processes:
segmentation and integration. Anecdotally, in this experiment, many individuals with WS drew long lines of the local letters (see Figure 8). This indicates that they are able
to segment an image. However, these individuals did not go on to draw subsequent letter strings with the appropriate spatial relations to one another in order to form the
global figure. An impairment in encoding spatial relations therefore becomes apparent when it is an essential feature of task completion. Stimulus integration is reliant on accurate spatial relational encoding. This can explain why such an impairment has a
detrimental effect on stimulus production, but not stimulus identification tasks.
Figure 8 about here
In conclusion, the present study has demonstrated first that there is no local
bias in stimulus identification in WS in either selective or divided attention. Second, and in line with previous studies [30], there is evidence of a local bias in drawing in
WS. These results imply that the bias in drawing is not necessarily related to a bias at the more perceptual level as has been previously assumed [3]. Instead, we suggest that the local bias observed in the drawings of individuals with WS, results from a
References
1. Arnold R, Yule W, Martin N. The psychological characteristics of infantile
hypercalcaemia: A preliminary investigation. Developmental Medicine and Child Neurology 1985; 27: 49-59.
2. Atkinson J, King J, Braddick O, Nokes L, Anker S, Braddick F. A specific deficit of dorsal stream function in Williams syndrome. Neuroreport: Cognitive
Neuroscience and Neuropsychology 1997; 8: 1919-1922.
3. Bellugi U, Sabo H, Vaid J. Spatial deficits in children with Williams Syndrome. In: Stiles-Davis J, Kritchevshy U, Bellugi U, editors. Spatial Cognition: Brain
Bases and Development. Hillsdale, New Jersey: Lawrence Erlbaum, 1988: 273-297
4. Bihrle A, Bellugi U, Delis D, Marks S. Seeing either the Forest or the Trees:
Dissociation in Visuospatial Processing. Brain and Cognition 1989; 11: 37-49. 5. Bruce V, Young A. Understanding face recognition. British Journal of Psychology
1986; 77: 305-327.
6. Dall'Oglio A M, Milani L. Analysis of the cognitive development in Italian children with Williams syndrome. Genetic Councelling 1995; 6: 175-6.
7. Dunn L M, Dunn L M, Whetton C, Pintilie D. British Picture Vocabulary Scale. Windsor, UK: NFER-Nelson, 1982.
8. Farran E K, Jarrold C. Visuo-spatial cognition in Williams syndrome: An uneven profile of abilities. Poster presentation at the British Psychological Society Developmental section conference, Nottingham, UK, 1999.
9. Farran E K, Jarrold C. Visuo-spatial cognition in Williams syndrome: Reviewing and accounting for the strengths and weaknesses in performance. Developmental
10.Goodglass H, Kaplan E. Assessment of aphasia and related disorders. Philadelphia: Lea and Febiger, 1972.
11.Grant J, Karmiloff-Smith A, Gathercole S E, Paterson S, Howlin P, Davies M, Udwin O. Phonological Short-term Memory and its Relationship to Language in
Williams Syndrome. Cognitive Neuropsychiatry 1997; 2: 81-99.
12.Guerin F, Sha B, Belleville S. Cognitive processing of drawing abilities. Brain and Cognition 1999; 40: 464-478.
13.Happé F. Autism: cognitive deficit or cognitive style? Trends in Cognitive Sciences 1999; 3: 216-222.
14.Howlin P, Davies M, Udwin O. Cognitive Functioning in Adults with Williams Syndrome. Journal of Child Psychology and Psychiatry 1998; 39: 183-9. 15.Karmiloff-Smith A. Crucial Differences Between Developmental Cognitive
Neuroscience and Adult Neuropsychology. Developmental Neuropsychology, 1997; 13, 513-524.
16.Kosslyn S M, Koenig O. Wet mind: The new cognitive neuroscience. Cambridge, MA: MIT Press, 1992.
17.Kosslyn S M, Malkovic V, Hamilton S E, Horwitz G, Thompson W L. Two types
of image generation: Evidence for left and right hemisphere processes. Neuropsychologia 1995; 33: 1485-1510.
18.Kramer J H, Elenberg L, Leonard J, Share L J. Developmental sex differences in global-local perceptual bias. Neuropsychology 1996; 10: 402-7.
19.Lamb M R, Yund E W. Spatial frequency and interference between global and
local levels of structure. Visual Cognition 1996; 3: 193-219.
20.Milner A D, Goodale M A. The Visual Brain in Action: Oxford Psychological
21.Navon D. Forest before trees: The precedence of global features in visual perception. Cognitive Psychology, 1977; 9, 353-383.
22.Navon D. Do attention and decision follow perception? Comment on Miller. Journal of Experimental Psychology: Human Perception and Performance 1981;
7: 1175-1182.
23.Nickerson E, Greenberg F, Keating M T, McCaskill C, Shaffer L G. Deletions of the elastin gene at 7q11.23 occur in ~ 90% of patients with Williams syndrome.
American Journal of Human Genetics 1995; 56: 1156-1161.
24.Pani J R, Mervis C B, Robinson B F. Global Spatial Organization by Individuals
with Williams Syndrome. Psychological Science 1999; 10: 453-8.
25.Phillips C, Jarrold C, Baddeley A, Karmiloff-Smith A. A spatial language problem in Williams syndrome: Evidence from grammatical errors. Poster
presentation at the British Psychological Society Developmental section conference, Bristol, UK, 2000.
26.Plaisted K, Swettenham J, Rees L. Children with autism show local precedence in a divided attention task and global precedence in a selective attention task. Journal of Child Psychology and Psychiatry 1999; 40: 733-742.
27.Pomerantz J R. Perceptual organisation in information processing. In: Kubovy M Pomerantz J R, editors. Perceptual organisation. Hillsdale, NJ: Erlbaum, 1981.
28.Raven J C. Coloured progressive matrices. Oxford, UK: Information Press Ltd, 1993.
29.Raven J, Raven JC, Court J H. Manual for Raven's Progressive Matrices and
30.Rossen R, Klima E S, Bellugi U, Bihrle A, Jones W. Interaction between language and cognition: evidence from Williams Syndrome. In: Beitchman J, Cohen N,
Konstantareas M, Tannock R, editors. Language, Learning and Behaviour disorders: Developmental, Behavioural and Clinical Perspectives. New York:
Cambridge University Press, 1996: 367-392.
31.Shah A, Frith U. An Islet of Ability in Autistic Children: A Research note. Journal of Child Psychology and Psychiatry 1983; 24: 613-620.
32.Shah A, Frith U. Why do autistic individuals show superior performance on the block design task? Journal of Child Psychology and Psychiatry 1993; 34:
1351-1364.
33.Siegal S Castellan N J Jr. Nonparametric Statistics for the Behavioural Sciences, International Edition, Singapore :McGraw-Hill Book Company, 1988.
34.Stevens T. Language Acquisition in Williams Syndrome: Lexical Constraints and Semantic Organisation. Unpublished PhD, University College London and MRC
Cognitive Development Unit, London, 1997.
35.Tada W L, Stiles J. Developmental change in children's analysis of spatial patterns. Developmental Psychology 1996; 32: 951-970.
36.Tassabehji M, Metcalfe K, Karmiloff-Smith A, Carette M J, Grant J, Dennis N, Rearcdon W, Splitt M, Read A P, Donnai D. Williams Syndrome: Use of
Chromosomal Microdeletions as a Tool to Dissect Cognitive and Physical Phenotypes. American Journal of Human Genetics 1999; 64: 118-125.
37.Treisman A. Properties, parts and objects. In: Boff K R, Kaufman L, Thomas J P,
38. Wechsler D. Wechsler Intelligence Scale for Children-Third Edition UK.: The Psychological Corporation, 1992.
39. Woliver R E Sacks S D. Intelligence and Primary Aptitudes: Test Design and Tests Available. In: Cattell, Johnson B, Johnson R C, editors. Functional
Author Note
The first author is supported by a research studentship from the Williams Syndrome
Foundation of the United Kingdom. We would like to thank those members of the WSF who have kindly participated in this study and the staff and students of Barton
Hill Infant and Nursery School for their co-operation with this work. Correspondence concerning this article should be addressed to Emily Farran, Department of
Psychology, University of Reading, Earley Gate, Reading, RG6 6AL, UK. Electronic
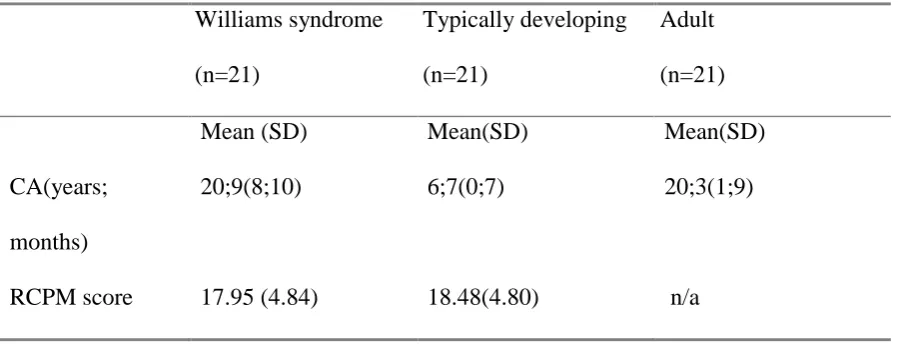
Table 1: Participant details
Williams syndrome (n=21)
Typically developing (n=21)
Adult (n=21)
Mean (SD) Mean(SD) Mean(SD)
CA(years;
months)
20;9(8;10) 6;7(0;7) 20;3(1;9)
Figures
Figure 1: Stimuli employed in the divided attention task
Figure 2: Stimuli employed in the selective attention tasks
Figure 3: Responses to large letter and small letter conditions on the selective
attention task: Response times and number of correct responses
Figure 4: Responses to target present trials only on the divided attention task: Response times and number of correct responses
Target present Target absent
congruent
incongruent/ global
Congruent (used in both selective attention conditions)
Incongruent (used in both selective attention conditions)
Neutral (used in condition when attending to small letters only)
400 800 1200 1600 2000
incongruent neutral congruent
re spon se t im es ( m se cs ) 7 8 9 10
incongruent neutral congruent
corr ec t re spon se s ( out
of 10) WS large
0
1
2
3
4
5
global score
local score
sc
or
e ou
t of
5
Model WS participant 1: aged 260 months