ISSN(Online): 2320-9801
ISSN (Print): 2320-9798
I
nternational
J
ournal of
I
nnovative
R
esearch in
C
omputer
and
C
ommunication
E
ngineering
(An ISO 3297: 2007 Certified Organization)
Vol. 3, Issue 9, September 2015
Evaluating the Most Efficient Edge Detection
Technique for Inspection of Chip Resistor
Kunal J Pithadiya
1,
Ketan S Patel
2Lecturer, Dept. of EC, B & B Institute of Technology, V V Nagar, GTU,Gujarat, India1,2
ABSTRACT: Identification and dimensional measurement of electronic components are important issues to be considered. A lot of research is going on to increase the liberty in dimensional measurements of the electronic components. It is an efficient method which works on previously acquired images. Electronic components such as IC chips, chip resistors, chip capacitors, chip LEDs etc., are identified by edge detection, colour pattern matching and gauging is used for dimensional measurement of the components. In this paper we have compared different template based and optimal edge detection methods. Various edge detection techniques are evaluated to inspect basic dimensions of Surface mount Chip resistor using machine vision. This paper represents the steps and approach to inspect basic notch dimension of chip resistor by using different edge detection techniques which would be helpful for quality inspection within précised time. Roberts, Sobel and Prewitt are used as template based edge detectors and Marr-Hilderth (LoG) Edge detector, Canny Edge detector and Infinite Symmetrical Exponential Filters (ISEF) are used as optimal edge detectors to find the notch termination dimension with discrepancies of SMD resistor. The results of both optimal edge detection algorithm and template based edge detection algorithms were found similar in this case.
KEYWORDS: Machine vision, Template based edge detection methods, ISEF, Optimal edge detection method, Surface Mount Chip resistor, Notch termination
I. INTRODUCTION
Edge detection method, finds edges along a line of pixels in the image. Edge detection tools are used to identify and locate discontinuities in the pixel intensities of an image. The discontinuities are typically associated with abrupt changes in pixel intensity values that characterize the boundaries of objects in a scene. To detect edges in an image, a search region is specified in which image is to be located. For example, we may want to locate edges along a specific portion of a part that has been previously located using particle analysis or pattern matching algorithms. The edge detection tool analyses the pixels along this region to detect edges. The edge detection tool can be configured to find all edges, to find the first edge, or to find the first and last edges in the region. Edge detection is also used to detect structural defects, such as cracks, or cosmetic defects, such as scratches, on a part. If the part is of uniform intensity, these defects show up as sharp changes in the intensity profile.
Edge detection identifies these changes. Alignment determines the position and orientation of a part. In many machine vision applications, the object that is inspected may be at different locations in the image. Edge detection finds the location of the object in the image before performing the inspection, so only the regions of interest can be inspected. Edge detection is an effective tool for many machine vision applications. It provides information about the location of object boundaries and the presence of discontinuities. If the overall light in the image is low, the edges in image will have low strengths. The change occurs in the edge strength along the boundary of an object relative to different lighting conditions. The presence of a very bright object causes other objects in the image with lower overall intensities to have edges with smaller strengths. Edge length defines the maximum distance in which the desired gray scale difference between the edge and the background must occur.
II. RELATED WORK
ISSN(Online): 2320-9801
ISSN (Print): 2320-9798
I
nternational
J
ournal of
I
nnovative
R
esearch in
C
omputer
and
C
ommunication
E
ngineering
(An ISO 3297: 2007 Certified Organization)
Vol. 3, Issue 9, September 2015
to rectify the problem related to recognition and analysis of electronic component. In [15], they have concentrated to detect SMT electronic modules automatically by using image processing matching technique to investigate its geometry and shape features. They have focused on, inspection of electronics SMT component with precision and speed without defect. In [16] the authors have proposed automated PCB recycling system. They have worked on SMD segmentation with different imaging condition using image processing technique. From the above literature survey we come to know that it is very important and we have inspired to find and check mechanical geometric information of SMD components, and in this paper we have tried to analyse and evaluate geometric information of Chip resistor.
III. PROBLEM DEFINITION
Machine Vision is used because the images, which are blurred and noisy, can be processed to obtain better images. The color pattern matching technique can easily extract color planes. Edge detection technique works very efficiently for dimensional measurement. It is capable of processing images consistently i.e. machine vision based systems are typically designed to perform single, repetitive tasks. This technique especially increases accuracy, robustness and efficiency of the image in the system. Machine vision system can be employed, to detect damaged part and flaws of the components which causes inefficient working of the whole system and also for checking the labels and color of the electronic components.
Dimensional measurement is required in number of fields, where the measurements of manufactured goods such as that of semiconductor chips, automobile parts etc. are to be noted, thus it helps to find the surface defects. Manufacturer favors machine vision systems for visual inspections that require high-speed, high-magnification, 24-hour operation, and repeatability of measurements, frequently as manual measurement of large number of manufactured goods in any of these applications can be a tedious and time consuming process, prone to human errors. Just as human inspectors working on assembly lines visually inspect parts to judge the quality of components, so machine vision systems use scanners or digital cameras and image processing software to perform similar inspections.
IV. EDGE DETECTION TECHNIQUES
Edge detection is one of the most commonly used operations in image analysis [5]. An edge is defined by a discontinuity in gray level values and is the boundary between an object and the background [5][7]. Many edge detectors are available based on templates and optimal, few of them are described as under.
A. Roberts Edge detector [5][8]:
The Robert’s Cross operator performs a simple, quick to compute, 2-D spatial gradient measurement on an image [8], [9]. The operator consists of a pair of 2×2 convolution kernels as shown in below matrix.
0 1
−1 0
1 0
0 −1
Gx GY
These kernels are designed to respond maximally to edges running at 45° to the pixel grid, one kernel for each of the two perpendicular orientations. The kernels can be applied separately to the input image, to produce separate measurements of the gradient component in each orientation (Gx and Gy). The gradient magnitude is given by:
𝐺 = 𝐺𝑥2+ 𝐺𝑦2
B. Sobel Edge Detector [5][8]:
The Sobel edge detector having the following values:
Sy=
−1 −2 −1
0 0 0
1 2 1
Sx=
−1 0 1 −2 0 2 −1 0 1
ISSN(Online): 2320-9801
ISSN (Print): 2320-9798
I
nternational
J
ournal of
I
nnovative
R
esearch in
C
omputer
and
C
ommunication
E
ngineering
(An ISO 3297: 2007 Certified Organization)
Vol. 3, Issue 9, September 2015
these edge detectors is their dependence on the size of the object. They are having high sensitivity to noise, and are inaccurate too.
C. Prewitt Edge Detector [5][8]:
Prewitt operator is similar to the Sobel operator and is used for detecting vertical and horizontal edges in images.
.
1 1 1
0 0 0
−1 −1 −1
−1 0 1 −1 0 1 −1 0 1
D. LoG algorithm [1][5][8]:
LoG is outlined in Table-I for which, Locality is not especially good, and the edges are not always thin. Still, this edge detector is much better than the previous one in case of low signal to noise ratio. Malfunctioning at corners, curves and where the gray level intensity function varies, not finding the orientation of edge because of using the Laplacian filter.
TABLE I LOG ALGORITHM
No. STEPS
1 Convolve the image I with a two dimensional Gaussian function.
2 Compute the Laplacian of the convolved image; call this L.
3 Edges pixels are those for which there is a zero crossing in L.
E. Canny algorithm [1][5][7][8]:
Canny specified three issues that an edge detector must address viz., Error rate, localization and response [7]. Canny algorithm is shown in Table II. It convolves the image with the derivative of a Gaussian, the canny implementation uses a wrap-around scheme when performing the convolution, and the areas near the boundary of the image are occupied with black pixels, although sometimes with what appears to be noise.
TABLE II
CANNY ALGORITHM
No. STEPS
1 2 3
4
5
6
Read the image I.
Convolve a 1D Gaussian mask with I.
Create a 1D mask for the first derivative of the Gaussian in the x and y directions.
Convolve I with G along the rows to obtain Ix, and down the columns to obtain Iy.
Convolve Ix with Gx to have Ix’, and Iy with Gy to have Iy’.
Find the magnitude of the result at each pixel (x, y).
x
y
Ix xy Iy xyM
,
' , 2
' , 2F. ISEF Algorithm [1][9][10][11][12]:
ISSN(Online): 2320-9801
ISSN (Print): 2320-9798
I
nternational
J
ournal of
I
nnovative
R
esearch in
C
omputer
and
C
ommunication
E
ngineering
(An ISO 3297: 2007 Certified Organization)
Vol. 3, Issue 9, September 2015
the derivative of a Gaussian, whereas Shen and Castan uses the optimal filter directly, or could be due to a difference in this way the different optimality criteria are reflected in reality. Shen-Castan’s Infinite symmetric exponential filter based edge detector is an optimal edge detector which gives optimal filtered image. First the whole image will be filtered by the recursive ISEF filter in X direction and in Y direction, which can be implement by using equations as written below. Then the Laplacian image can be approximated by subtracting the filtered image from the original image.
At the location of an edge pixel there will be zero crossing in the second derivative of the filtered image. The first derivative of the image function should have an extreme at the position corresponding to the edge in image and so the second derivative should be zero at the same position. And for thinning purpose apply non maxima suppression as it is used in canny for false zero crossing. The gradient at the edge pixel is either a maximum or a minimum. If the second derivative changes sign from positive to negative this is called positive zero crossing and if it changes from negative to positive it is called negative zero crossing. We will allow positive zero crossing to have positive gradient and negative zero crossing to have negative gradient, all other zero crossing we assumed to be false and are not considered to an edge. Now gradient applied image has been thinned, and ready for the thresholding. The simple thresholding can have only one cutoff but Shen-Castan suggests to use Hysteresis thresholding. Spurious response to the single edge caused by noise usually creates a streaking problem that is very common in edge detection.
Recursion in x direction:
,
1
,
1
,
1
1
,
1
I
i
j
b
y
i
j
b
b
j
i
y
eq. (1)M
i
N
j
1
...
,
1
..
,
1
,
1
1
1
,
2
I
i
j
b
y
i
j
b
b
b
j
i
y
eq. (2)M
i
N
j
...
1
,
1
..
i
,
j
y
1
i
,
j
y
2
i
,
j
1
r
eq. (3)
Recursion in y direction:
,
1
1
,
,
1
1
,
1
b
I
i
j
b
y
i
j
b
j
i
y
eq. (4)N
j
M
i
1
...
,
1
..
,
1
1
,
,
1
1
,
2
b
I
i
j
b
y
i
j
b
b
j
i
y
eq. (5)N
j
M
i
...
1
,
1
..
i
j
y
i
j
y
i
j
y
,
1
,
2
1
,
eq. (6)
ISSN(Online): 2320-9801
ISSN (Print): 2320-9798
I
nternational
J
ournal of
I
nnovative
R
esearch in
C
omputer
and
C
ommunication
E
ngineering
(An ISO 3297: 2007 Certified Organization)
Vol. 3, Issue 9, September 2015
TABLE III
ISEF ALGORITHM [1][9][10][11][12]
No Steps
1 Apply ISEF Filter in X direction as per eq. (1), eq. (2) and eq. (3).
2 Apply ISEF Filter in Y direction as per eq. (4), eq. (5) and eq. (6).
3 Apply Binary Laplacian Technique
4 Apply Non Maxima Suppression
5 Find the Gradient
6 Apply Hysteresis Thresholding
7 Thinning
The ISEF algorithm is given in Table III. The output of an edge detector is usually thresholded, to decide which edges are significant and streaking means the breaking up of the edge contour caused by the operator fluctuating above and below the threshold. Streaking can be eliminated by thresholding with Hysteresis. Individual weak responses usually correspond to noise, but if these points are connected to any of the pixels with strong responses, they are more likely to be actual edge in the image. Such connected pixels are treated as edge pixels if there response is above a low threshold. Finally thinning is applied to make edge of single pixel.
Fig.1. SampleImage
Fig.2. Sample Image with distances
Fig.3. Sample Image with Area A, B and C
V. EXPERIMENTAL METHOD
To detect the good quality surface mount chip resistor, we have to inspect the surface mount components as per the defined rejection criteria. Sample image is shown in Fig-1. We measure notch termination distances from a given reference line shown in Fig-2. This is one of the important dimensional parameter of chip resistor to be inspected and measured.
Referenceline Distances to be
measured
C
Referenceline Distance to be
measured
ISSN(Online): 2320-9801
ISSN (Print): 2320-9798
I
nternational
J
ournal of
I
nnovative
R
esearch in
C
omputer
and
C
ommunication
E
ngineering
(An ISO 3297: 2007 Certified Organization)
Vol. 3, Issue 9, September 2015
TABLE IV
Algorithm to find distances for Area A, B and C No. Steps
1 Acquire the image as shown in Fig-1. 2 Apply optimal edge detection algorithm. 3 Measure different distances for Area A,
B and C from the reference line as shown in the Fig-2 and Fig-3.
4 Distances for area A and B must be the same. For area C, distances will be little less than distances for area A as shown in Fig-2 and Fig-3.
5 Plot the graph for all distances measured for each edge detection method.
6 Find median distance for Area A, B and C for each edge detection method.
In this experiment, we have divided the notch termination area in three parts: A, B and C, where distances for area A and B must be same and for area C distances must be little less than A or B as per defined dimensional criteria. Area A, B and C in Sample Image and method to find out the distances for area A, B and C are shown in the Fig-3 and Table IV respectively. Generally in machine vision systems for edge detection template based edge detectors like Roberts, Prewitt, Sobel, or the optimal edge detection methods like LoG, Canny are used. Canny edge detector is near optimal while for ISEF with exponential function the optimality condition is checked and proved to be optimal one. Hence it is preferable to use most optimal edge detection methods to examine the physical dimensions of the chip capacitor, which is Shen-Castan’s Infinite symmetric exponential filter.
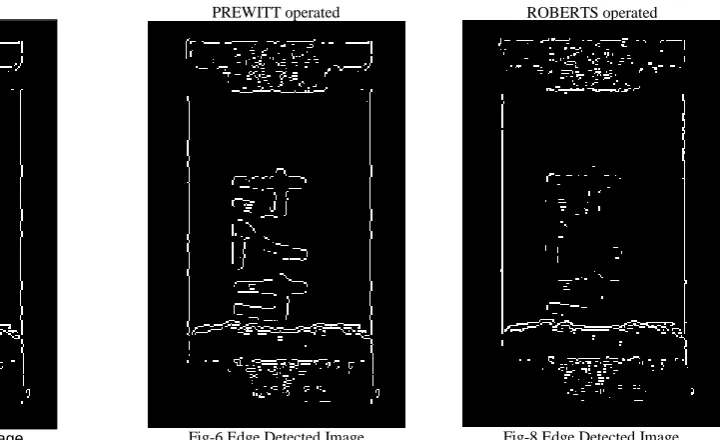
Fig.4 Edge Detected Image Fig-6 Edge Detected Image Fig-8 Edge Detected Image ROBERTS operated PREWITT operated
ISSN(Online): 2320-9801
ISSN (Print): 2320-9798
I
nternational
J
ournal of
I
nnovative
R
esearch in
C
omputer
and
C
ommunication
E
ngineering
(An ISO 3297: 2007 Certified Organization)
Vol. 3, Issue 9, September 2015
Fig-10 Edge Detected Image Fig.12 Edge Detected Image Fig.14 Edge Detected Image
Fig.5.Sobel Operated Distances Plot Fig.11.LoG Operated Distances Plot
Fig.7.Prewitt Operated Distances Plot Fig.13. Canny Operated Distances Plot
0 20 40 60 80 100 120
0 5 10 15 20 25 30
SOBEL Operated
Pixel
D
is
ta
n
c
e
0 20 40 60 80 100 120
0 5 10 15 20 25 30
LOG Operated
Pixel
D
is
ta
n
c
e
0 20 40 60 80 100 120
0 5 10 15 20 25 30
PREWITT Operated
Pixel
D
is
ta
n
c
e
0 20 40 60 80 100 120
0 5 10 15 20 25 30
CANNY Operated
Pixel
D
is
ta
n
c
e
ISEF operated CANNY operated
ISSN(Online): 2320-9801
ISSN (Print): 2320-9798
I
nternational
J
ournal of
I
nnovative
R
esearch in
C
omputer
and
C
ommunication
E
ngineering
(An ISO 3297: 2007 Certified Organization)
Vol. 3, Issue 9, September 2015
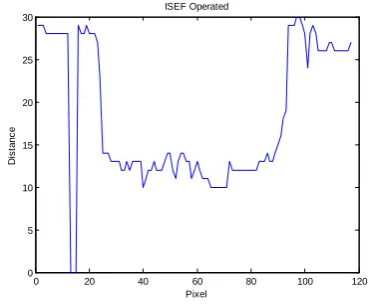
Fig.9. Roberts Operated Distances Plot Fig-15. ISEF Operated Distances Plot
VI. RESULT AND DISCUSSION
In this paper we have found and compared the notch termination distances for Area A, B and C using template based edge detection method and optimal edge detection methods. After applying Sobel, Prewitt, Robert, LoG (Threshold=0.015), Canny (threshold=0.7) and ISEF (with b=0.77, HT=100, LT=46 and thinning=4) edge detectors, the output images are shown in Fig-4 for Sobel operated edge detected image, Fig-6 for Prewitt operated edge detected image, Fig-8 for Roberts operated edge detected image, Fig-10 for LoG operated edge detected image, Fig-12 for Canny operated edge detected image and Fig-14 for ISEF operated edge detected image respectively. The Distance plot for each edge detection methods (discrete distances of each methods are shown in Appendix) are plotted as shown in Fig-5 for Sobel operated distance plot, Fig-7 for Prewitt operated distance plot, Fig-9 for Roberts operated distance plot, Fig-11 for LoG operated distance plot,Fig-13 for canny operated distance plot and Fig-15 for ISEF operated distance plot respectively. The notch termination median distances for Area A, B and C are shown in the Table V using all six template based and optimal edge detection methods with actual distances in terms of no. of Pixel. The distances shown are intentionally taken median and in terms of no. of pixels instead of mm for the accurate result.
TABLE V
Median of Distances for Area A, B and C for each edge detection methods
Edge Detection
Methods
Median of Distances For Area
A in pixel
Median of Distances For Area
B in pixel
Median of Distances
For Area C in pixel
Actual 28 28 12
Sobel 28 29 13
Prewitt 28 29 13
Roberts 28 29 13
LoG 28.5 29 14
Canny 29 29 14
ISEF 28 26.5 12
VII. CONCLUSION
The output median distance of area A, B and C for each edge detection method is shown in the Table V. From the all Distance plots of all edge detection methods, we can see ‘U’ shaped curve which shows the existence of the notch in
0 20 40 60 80 100 120
0 5 10 15 20 25 30
ROBERTS Operated
Pixel
D
is
ta
n
c
e
0 20 40 60 80 100 120
0 5 10 15 20 25 30
ISEF Operated
Pixel
D
is
ta
n
c
ISSN(Online): 2320-9801
ISSN (Print): 2320-9798
I
nternational
J
ournal of
I
nnovative
R
esearch in
C
omputer
and
C
ommunication
E
ngineering
(An ISO 3297: 2007 Certified Organization)
Vol. 3, Issue 9, September 2015
the SMD resistor at one side. We can conclude from the result shown in Table V that by using any one of the edge detection method used above, we can find out the Existence and dimension of notch regarding SMD chip register by seeing or measuring that ‘U’ shaped curve with having +/-1 pixel tolerance. After the observation of experimental Table V, one can prefer any one of above described edge detection method to find notch termination of chip resistor. The abrupt variation in the distance plot shows the irregular formation of the solder material in the end termination.
REFERENCES
1. Jayesh D. Chauhan, Chintan K. Modi, Kunal J. Pithadiya, ‘Location M estimator with optimal edge detector for quality inspection of surface mount device capacitor’, Proceedings of the International Conference and Workshop on Emerging Trends in Technology (ICWET '10),pp- 595-600,ACM Digital Library, ISBN 978-1-60558-812-4 ,2010.
2. Machine Vision Based Identification and Dimensional Measurement of Electronic Components, thesis, Jainy Sachdeva, Department of Electrical and Instrumentation Engineering, Thapar Institute Of Engineering & Technology, Patiala, 2006.
3. Micro Section examination preparation and evaluation of capacitors fixed ceramic leaded and chips manual: ESCC basic specification No. 23400.
4. Chi-Hao Yeh, Ta-Cheng Shen, Ful-Chiang Wu, ‘Passive Component inspection using a 1D Wavelet Transform’, International Journal of Advanced Manufacturing Technology 22: 899–910, 2003.
5. Alberto martin, ‘Image processing techniques for Machine Vision’, miami, florida, 2000.
6. ‘Johanson dielectrics manual’, Sylmar California, rev 1.02.
7. Canny, J., ‘A computational approach to edge detector’, IEEE transactions on Pattern Analysis on Machine Intelligence, pp 679-698, 1986. 8. Mohsen sharifi, ‘A classified and comparative study of edge detection algorithms’, proceedings of the international conference on information
technology: coding and computing IEEE, 2002.
9. Kunal Pithadiya et al., ‘Performance Evaluation of ISEF and Canny edge detector in acrylic fiber quality control production’,National conference in innovationas on Mechatronics, IME, India, 2009.
10. Shen Castan, ‘An optimal linear edge detector for step edge detection’, Computer Graphics and Image Processing: Graphical models and understanding : Vol.54, No.2, March, 1992
11. Kunal J Pithadiya, Chintan K Modi, Jayesh D Chauhan,‘Selecting the Most Favourable Edge Detection Technique for Liquid Level Inspection in Bottles’, International Journal of Computer Information systems and Industrial Management Applications (IJCISIM), ISSN: 2150-7988 Vol.3, pp.034-044, 2011.
12. Chintan K. Modi, Kunal J Pithadiya, Jayesh D Chauhan , P. S. V. Nataraj, ‘Selecting the Most Favourable Edge Detection Technique for Multi-layer Chip Capacitor’,2014.
13. John Maxwell , ‘CRACKS: THE HIDDEN DEFECT’,AVX technical information 14. Kuk Won KOa et al., ‘Enhancement of Placement Accuracy for SMD via Development of a 15. A. New Illumination System’, Proceedings of SPIE Vol. 4190 © 2001 SPIE · 0277-786X, 2001
16. Xibing Li et al., ‘Defect Detection of SMT Electronic Modules’, International journal Appl. Math. Inf. Sci. 7, No.2, 515-520, Natural Sciences Publishing Cor., 2013
17. Wei Li et al., ‘SMD segmentation for automated PCB recycling’, (white paper)
BIOGRAPHY
Kunal J Pithadiya Graduated in Electronics & Communication Engineering from the L. D College of Engineering, Gujarat University, Ahmedabad, Gujarat, India in 2002. He has done his Master’s in Communication Engineering from G H Patel College of Engineering and Technology (GCET), V V Nagar, Sardar Patel University in 2009. He is working as a Sr.Lecturer in Bhailalbhai & Bhikhabhai Institute of Technology, Vallabh Vidyanagar, Gujarat, India. He has published several National, International Conference and International Journal Papers based on Edge detection, Electronics, Machine Vision and Regression etc.
ISSN(Online): 2320-9801
ISSN (Print): 2320-9798
I
nternational
J
ournal of
I
nnovative
R
esearch in
C
omputer
and
C
ommunication
E
ngineering
(An ISO 3297: 2007 Certified Organization)
Vol. 3, Issue 9, September 2015
APPENDIX
List of Distances of different Edge Detection Techniques used above. ISEF
29 29 29 28 28 28 28 28 28 28 28 28 0 0 0 29 28 28 29 28 28 28 27 23 14 14 14 13 13 13
13 12 12 13 12 13 13 13 13 10 11 12 12 13 12 12 12 13 14 14 12 11 13 14 14 13 13 11 12 13
12 11 11 11 10 10 10 10 10 10 10 13 12 12 12 12 12 12 12 12 12 12 13 13 13 14 13 13 14 15
16 18 19 29 29 29 30 30 29 28 24 28 29 28 26 26 26 26 27 27 26 26 26 26 26 26 27
SOBEL
29 26 29 29 28 28 28 28 28 28 28 28 0 0 0 29 28 28 29 29 29 29 25 25 19 25 14 13 13 13
13 13 12 12 12 12 12 12 12 12 12 13 13 13 13 13 13 13 13 13 13 13 13 16 14 13 13 13 13 13
12 12 12 12 12 12 12 12 12 13 12 12 12 12 12 12 12 12 12 12 12 12 13 13 13 13 13 13 13 14
15 26 27 29 29 29 30 30 29 27 27 28 29 29 29 29 29 29 29 29 29 26 29 14 14 30 27
PREWITT
29 26 29 29 28 28 28 28 28 28 28 28 0 0 0 29 28 28 29 29 29 25 25 25 19 25 14 13 13 13
13 13 12 12 12 12 12 12 12 12 12 13 13 13 13 13 13 13 13 13 13 13 13 14 14 13 13 13 13 13
12 12 12 12 12 12 12 12 12 13 12 12 12 12 12 12 12 12 12 12 12 12 13 13 13 13 13 13 13 14
15 26 27 29 29 30 30 30 29 27 27 28 29 29 29 29 29 29 29 29 29 26 29 14 14 30 27
ROBERTS
26 26 29 29 28 28 28 29 28 29 28 28 0 0 0 29 28 28 29 29 29 26 26 24 26 25 14 13 14 13
13 13 12 12 15 13 13 13 13 11 11 13 13 13 13 13 13 13 13 13 13 13 13 16 14 14 14 14 13 13
12 12 12 13 13 13 13 13 13 13 12 13 13 12 12 12 14 12 12 12 12 13 14 14 13 13 14 14 14 15
26 27 27 29 29 30 30 30 28 27 25 28 29 29 29 29 29 29 29 29 29 29 29 14 14 30 28
LoG threshold with 0.015
26 26 29 29 30 28 29 29 29 29 29 28 0 0 0 29 28 28 30 30 30 29 27 26 25 17 14 14 13 13
14 14 12 14 14 14 14 14 13 13 13 14 14 14 14 14 14 14 14 14 14 14 15 15 15 14 14 14 14 13
13 13 12 13 13 13 8 8 8 8 13 13 13 13 12 13 13 13 13 13 13 13 13 13 14 14 14 14 15 24
26 27 27 29 29 30 30 30 29 28 28 28 29 29 30 30 30 25 25 25 30 30 30 30 25 4 28 0 0 0
CANNY with threshold 0.65
16 30 30 30 29 29 29 29 29 29 29 29 29 29 29 29 29 29 29 29 28 27 26 25 19 15 14 14 14 14
13 13 13 14 14 14 14 13 13 13 13 14 14 14 14 14 14 14 14 14 14 14 15 15 14 14 14 14 14 13
13 13 13 13 13 13 13 13 13 13 13 13 13 13 13 13 13 13 13 13 13 13 13 13 14 14 14 14 15 16