R E S E A R C H
Open Access
Rapid algorithm prototyping and implementation
for power quality measurement
Krzysztof Ko
ł
ek
*and Krzysztof Pi
ą
tek
Abstract
This article presents a Model-Based Design (MBD) approach to rapidly implement power quality (PQ) metering algorithms. Power supply quality is a very important aspect of modern power systems and will become even more important in future smart grids. In this case, maintaining the PQ parameters at the desired level will require efficient implementation methods of the metering algorithms. Currently, the development of new, advanced PQ metering algorithms requires new hardware with adequate computational capability and time intensive, cost-ineffective manual implementations. An alternative, considered here, is an MBD approach. The MBD approach focuses on the modelling and validation of the model by simulation, which is well-supported by a Computer-Aided Engineering (CAE) packages. This paper presents two algorithms utilized in modern PQ meters: a phase-locked loop based on an Enhanced Phase Locked Loop (EPLL), and the flicker measurement according to the IEC 61000-4-15 standard. The algorithms were chosen because of their complexity and non-trivial development. They were first modelled in the MATLAB/Simulink package, then tested and validated in a simulation environment. The models, in the form of Simulink diagrams, were next used to automatically generate C code. The code was compiled and executed in real-time on the Zynq Xilinx platform that combines a reconfigurable Field Programmable Gate Array (FPGA) with a dual-core processor. The MBD development of PQ algorithms, automatic code generation, and compilation form a rapid algorithm prototyping and implementation path for PQ measurements. The main advantage of this approach is the ability to focus on the design, validation, and testing stages while skipping over implementation issues. The code generation process renders production-ready code that can be easily used on the target hardware. This is especially important when standards for PQ measurement are in constant development, and the PQ issues in emerging smart grids will require tools for rapid development and implementation of such algorithms.
Keywords:Automatic code generation; Flicker; PLL; Power quality; Rapid prototyping; Simulink; Synchronisation
1 Introduction
Smart Grids offer an opportunity for effective power sys-tem management and utilisation of distributed and re-newable energy resources. Efficient utilisation of the grid includes maintaining power supply (voltage) quality and emission (current) quality according to the specified limits. These limits can be set by the regulator, provided by standards or grid codes, or even agreed as part of an energy supply contract. The requirement of measuring the power quality (PQ) parameters has increased the interest in applications using signal processing tech-niques for PQ measurement. Comprehensive overviews of this problem are presented in [1,2]. These books
describe classical methods of PQ analysis as well as the application of advanced techniques like neural networks, wavelet transform, and machine learning methods. It is clear that there is a need for increasingly complex PQ metering algorithms.
On the other hand, PQ metering is defined by stan-dards, e.g. EN 61000-4-30. These standards define volt-age quality measurement and provide implementation details needed to build a PQ meter. Consequently, algo-rithms for a PQ meter include not only signal processing techniques, but also data aggregation, gapless measure-ment, and synchronization with line voltage waveforms or time references, etc.
Because further requirements for PQ are constantly developing, there is a need for a rapid development plat-form for new algorithms. A rapid development framework
* Correspondence:[email protected]
AGH University of Science and Technology, al. A.Mickiewicza 30, Kraków 30-059, Poland
should enable fast modelling, testing, and hardware imple-mentation. The framework would be useful for preparing a reference PQ meter to test algorithms for PQ measure-ment or event classification in the field, prepare test pro-cedures for upcoming certification processes, or test new ideas for PQ metering. This framework should enable rapid modelling, facilitate model validation and testing, as well as enable automatic code generation for different hardware platforms, including code generation for micro-processors and reconfigurable FPGA devices.
The conventional V-model of software development includes specification, design, implementation, integration, testing, and verification and validation stages. This imple-mentation process is performed manually and is time intensive. The complexity of PQ measurement algorithms and the requirement for short development cycles motiv-ate the investigation of a more efficient, reliable, and cost-effective alternative. Model-Based Design (MBD), adapted to the development of measurement algorithms, is here considered as an option. The MBD approach to the devel-opment of measurement algorithms consists of five steps:
1. Modelling input test signals and defining reference responses to the test inputs
2. Synthesis of measurement algorithms (Computer-Aided Engineering (CAE) tools are heavily used at this stage.) 3. Simulation of measurement algorithms excited by
the test sequences
4. Tuning the algorithms to achieve compliance of the simulated responses with reference responses 5. Synthesis of the algorithms on a target hardware
platform
The MBD approach focuses on modelling and simula-tion, hence most of the development time is independ-ent of target hardware. Moreover, some CAE packages automatically convert the models into a source code library, which simplifies and accelerates the synthesis stage. The automatic code generation method reduces the number of errors that appear during manual coding.
Several attempts have been made to design rapid development methods for power systems algorithms. In [3], an analysis of CAE tools such as MATLAB/Simulink and dSpace/TargetLink describes how they perform fun-damental steps such as physical modelling, simulations, control algorithms design and testing, hardware evalu-ation, parameter optimizevalu-ation, and finally code generation for real-time software implementations. As an example, the development of a controller for a low power single-phase transformerless inverter was presented. The develop-ment, verification, and implementation stages of automatic code generation to implement over/under-power pro-tection functions and MATLAB/Simulink active power filter control blocks are given in [4] and [5], respectively.
The active power filter allows the rapid on-line tuning of the filter’s parameters, selection of control algorithms, and can be applied to generate code for microcontrollers. Kirubakaran et al. in [6] presented a Digital Signal Pro-cessing (DSP) controller for a fuel-cell based system. MATLAB/Simulink was used to generate Pulse Width Modulation (PWM) signals for the TMS320F2812 DSP. The same DSP was applied to implement a unity power factor PWM rectifier and shunt active power filter, as described in [7]. The automatic code generation in the MATLAB/Simulink environment for the fixed-point DSP was presented. A slightly different development path is given in [8]. Simulink diagrams are automatically converted to C code, afterward converted to assembly language, and finally transferred to a DSP for execution.
SCADA systems are considered to be the target platform for algorithms generated in Simulink. In [9], a Simulink implementation of a grid load forecast algorithm was given. The Simulink diagram was applied to automatically gener-ate OPen Connectivity (OPC) Data Access and Modbus/
TCP servers. The servers were“embedded”into a SCADA
for real-time load prediction.
code generation, evaluation, and conversion before the code was applied in safety systems were presented.
Finally, some effort has been made to generate auto-matic code for reconfigurable FPGA circuits and their applications in power systems. Mekonnen et al. in [16] presented the simulation of a complete full-bridge PWM converter for a solar grid-tie inverter that also provided the benefits of auto VHDL-code generation for an RMS-based digital controller. In [17], a rapid prototyping plat-form for photovoltaic power inverters was presented. The hardware-in-the-loop approach was used to develop and validate PWM signals for different converter topolo-gies. The control strategies are developed as Simulink di-agrams, and the goal of the platform is the automatic VHDL code generation for Xilinx FPGAs.
The scope of this paper covers the development of algorithms for PQ metering while following the MBD approach. The algorithms developed and validated first as models are then transferred to C code automatically. The MATLAB/Simulink CAE plays a central role during the development. The generated code is executed on a hardware platform and real-time processing results are compared to the measurement generated by a commer-cial reference device. The implementation path for two example algorithms is presented. The algorithms are chosen because of their importance in PQ metering. The authors’intention is to show not the novelty of the algo-rithms but rather the rapid implementation issues.
1.1 Rapid prototyping
1.1.1 Rapid prototyping approach
The main advantage of the rapid prototyping approach is the ability to focus on the problem while omitting the details of its implementation. Development is carried out in an environment that offers a high level of abstrac-tion, and the implementation on a hardware platform is performed by automatically generated code in the target programming language. The differences with respect to the classical software development process can be shown using the example of a filter design. The classical ap-proach requires the selection of the filter structure, the calculation of parameters, and, finally, the implementa-tion of the filter in a programming language. The rapid prototyping path is reduced to giving the type and pa-rameters of the filter bandwidth. The source code of the filter procedures is then generated automatically. This approach results in ability to rapidly test and verify the proposed strategy while at the same time reducing the number of programming errors.
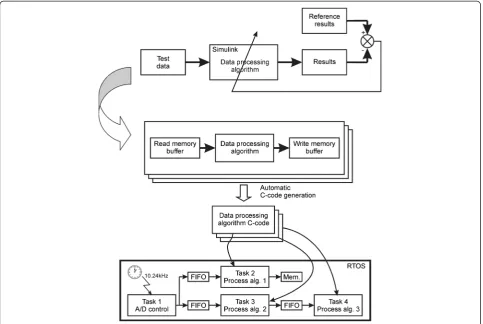
The MATLAB/Simulink stages of design and imple-mentation of a measurement algorithm are shown in Figure 1. A data processing algorithm is developed as a Simulink diagram and then excited by test data vectors until the results are compliant with the reference results.
At this point in the process, the design consists entirely of simulations without any references to the hardware on which the designed algorithm is intended to run.
The implementation on target hardware requires the replacement of simulation inputs and outputs by real signals. The interface can be established by controlling A/D and D/A converters, using files or databases, or over standard communication protocols such as Modbus, OPC Data Access, or OPC Unified Architecture. Modern processors map the A/Ds and D/As as memory, and com-munication protocol buffers also are allocated in memory, hence, without loss of generality, it can be assumed that in each case, communication is performed by reading and writing to memory locations. To switch from simulation to execution by a microprocessor, only the simulated in-puts and outin-puts need to be swapped for memory access blocks.
At this stage, the C code can be automatically
gener-ated. TheMATLAB Coder[18] andSimulink Coder[19]
packages are required to translate a Simulink diagram into equivalent C procedures. The generated code con-tains three sets of procedures: initialisation procedures executed once when the calculations begin, solver proce-dures that calculate the model at each sampling period, and termination procedures. Usually, the metering algo-rithms do not have a specific operating time, so the termination procedures are never called.
The generated code is functionally equivalent to the Simulink diagram. The solver procedures read data from the defined memory location, carry out the calculations, and store the results to the given memory addresses. In the case of a PQ metering application, the Simulink dia-grams implement calculations for root mean square values (RMS), spectrum, asymmetry, and flicker, result-ing in the automatic generation of a PQ measurement library.
The C procedures, generated from Simulink diagrams, are used to create tasks in a real-time operating system (RTOS). The data comes directly from A/D converters with a sampling frequency of 10.24 kHz. The A/Ds measure phase voltages and line currents, and the A/D results are stored in First In-First Out (FIFO) queues that trigger the execution of the tasks. The FIFO is a buffer where samples are stored until the following tasks become ready for execution, synchronizing the data source to the data consumer, and preventing any meas-urement points from being lost. The tasks read voltages and currents by accessing the FIFO memory and perform calculations for every incoming data sample. Inter-task communication is performed over memory locations, as was defined in the Simulink diagrams.
HDL code is synthesizable and can be implemented as an FPGA module. However, unlike C-code procedures, HDL modules may not perform floating point calcula-tions, and the algorithms must be converted into a
fixed-point representation. The Fixed-Point Designer
[21] toolbox supports this conversion, however, the con-version is usually time-consuming and sometimes may not even be possible.
1.1.2 Hardware platform
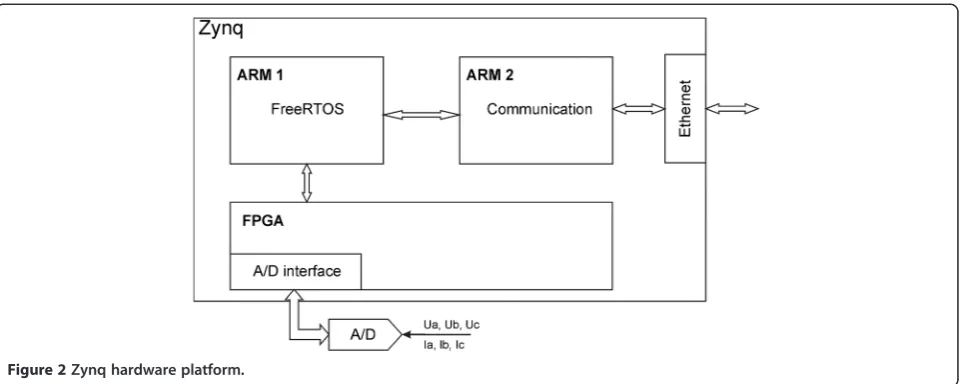
The Mars Starter Kit evaluation board from Enclustra was selected as the test hardware platform [22]. The board contains Zynq integrated circuits from Xilinx. The Zynq units contain within the single integrated circuit a dual-core ARM Cortex A9 processor equipped with the double precision floating point extension, reconfigurable FPGA fabric equipped with gates, registers, and RAM resources as well as communication cores (see Figure 2). An external A/D converter board is connected to meas-ure grid voltages and currents. The board is equipped with Analog Devices AD7980 1MSPS, 16-bit, successive approximation analogue-to-digital converters. The A/Ds are controlled by an IP (intellectual property) core
implemented in the FPGA. The core is developed in the VHDL language and operates as a component of the FPGA, as a kind of simple coprocessor. The A/D con-verters require the sequence of control signals to be gener-ated with accuracy on the order of a few dozen of nanoseconds. Such accuracy cannot be achieved in pro-gramming, and has to be implemented as a silicon circuit.
One ARM processor runs the FreeRTOS real-time oper-ating kernel. FreeRTOS tasks are created directly from the code generated automatically from Simulink diagrams. The second ARM processor runs a Linux distribution and is responsible mainly for implementing communication with the device via Ethernet.
The laboratory prototype of the flickermeter is shown
in Figure 3. It consists of two boards—one equipped
with the Zynq, memory, interfaces, and connectors to the communication channels. The second one operates as an interface to the analogue inputs.
The prototype has compact dimensions, but also has enough computational power to implement the chosen measurement algorithms. The worst case CPU utilisation of the ARM 1 processor is 7% when running the syn-chronisation and flicker calculation algorithms. The Figure 1Stages of rapid prototyping approach.
average ARM 2 utilisation is 5% when running the Modbus/TCP server in the Linux environment.
1.2 Case studies
1.2.1 Synchronization with line voltage
A significant part of the PQ metering process is syn-chronisation with the line voltage. The PQ metering standards, namely EN 61000-4-30 and EN 61000-4-7, define strict requirements in this area. In particular, all quantities should be measured within 10 cycle intervals for 50 Hz systems (for 60 Hz systems 12 cycles are re-quired). In addition, RMS measurements for event de-tection and flicker reference values must be measured by means of a sliding one cycle interval that moves in half-cycle steps. Consequently, correct detection of a half-cycle is crucial. A typical phase locked loop (PLL) could be used for this task; however, it can be prone to voltage distur-bances (e.g. harmonic distortion) or events (e.g. voltage dips). For three phase systems, the asymmetry could also
affect a typical PLL system. Therefore, a robust imple-mentation of the PLL is an important task in order to make a PQ meter operate correctly.
The PLL technique is a subject of great interest, and many PLL architectures and applications have been pre-sented (e.g. [23-26]). The Enhanced PLL (EPLL) contains an adaptive notch filter and provides a higher degree of insensitivity to variable-frequency input signals. A de-tailed description of the EPLL structure is given in [23,27-29]. This structure has been selected to demon-strate the proposed rapid implementation method.
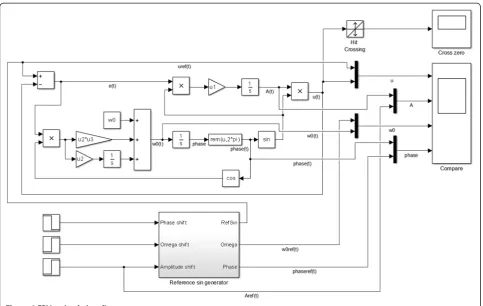
Figure 4 presents the Simulink diagram of the EPLL. The Reference sin generator block is the source of test data (see Figure 1). TheRefSinoutput generates the sine wave for which amplitude, phase, and frequency are dis-turbed. The output of the EPLL is a sine signal denoted
as u(t). The EPLL also outputs the detected amplitude,
frequency, and phase, marked respectively as A(t), w0(t),
andphase(t). TheComparescope acquires the simulation Figure 2Zynq hardware platform.
results and is used to compare the response of the EPLL to the reference signals.
The Hit Crossing block detects the zero crossing points of the sine signal generated by the EPLL. It is used for synchronising the PQ measurement algorithms to the power signal. Correct detection of the amplitude, frequency, and phase by the EPLL indicate the synchron-ous operation of the loop. The difference between the reference sine signal uref(t) and the EPLL outputu(t)is used to tune the loop. However, only the zero crossing signal is used for the measurement algorithms.
The EPLL tuning requires calculation of the u1, u2,
and u3 gains (see Figure 4). The parameter values were
determined by numerical optimization of the loop re-sponse to the test excitation. The rere-sponse to a step change in amplitude, frequency, and phase was tested. The following cost sub-functions were applied:
whereT0is the sampling period, urefand u are
respect-ively input and output sine signals of the loop, Aref
and A are respectively reference and measured
ampli-tudes, wref and w are respectively reference and
measured pulsation values, phaseref and phase are
respectively reference and measured phase values, and
Nis the number of samples during the numerical
opti-misation experiment. The sampling frequency was set to 10.24 kHz. The optimisation procedure can be defined as:
where W is a four element row vector of non-negative
constants. The optimisation is performed in the MATLAB environment by calling thefminsearchfunction [30].
The selection of theWvector elements determines the
optimal u1opt,u2opt and u3opt values and finally the be-haviour of the EPLL. For the flicker measurement, the EPLL is used to synchronise the algorithm to the grid signal when the loop output signal u(iT0) follows the input signal uref(iT0). The optimal loop parameters are
calculated for W such that only the first element is a
non-negative value and the remaining elements are set to zero. During the optimisation, the reference sine J ¼ Figure 4EPLL - simulation diagram.
signal is disturbed by step phase, frequency, and ampli-tude changes. The calculated optimal values are:
u1opt;u2opt;u3opt
¼½3 919:07; 147:7206; 208:1230
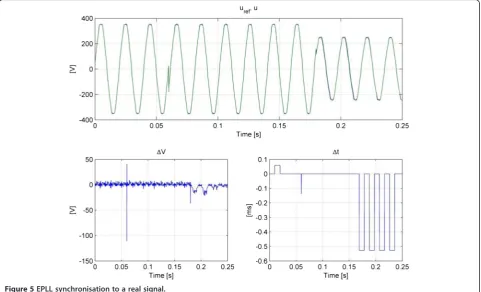
For test purposes, the optimised loop is applied not to the simulated signal but to synchronise to the real grid signal measured in the university power laboratory. The total harmonic distortion (THD) of the signal is 2.95% and, additionally, the signal is disturbed by a−π/6 rad step phase change, 5% frequency step, and 30% ampli-tude sag. The disturbances of the phase, frequency, and amplitude appear respectively at 60, 120, and 180 ms. The results are shown in Figure 5. The upper diagram
presents input test signal uref and the sinusoidal
re-sponse of loopu. The bottom left picture shows the dif-ference betweenurefandu. The time period between the
moments when theurefandusignals cross the zero
volt-age level is given in the bottom right diagram.
The miscellaneous sets of vector W values enable us to switch the EPLL into amplitude, frequency, or phase measurement modes and exemplify the flexibility of the proposed approach.
After simulation and optimisation phases, the test sig-nal sources are replaced by memory access drivers. The updated diagram is given in Figure 6. The input driver
Uaand the output drivers Cross zero, EPLL sin, Ampli-tude, Omega, and Phase are created as Simulink level-2
C-code S-functions [31]. The S-functions access memory buffers and operate as interfaces between the Simulink blocks and to the remaining flickermeter blocks.
The diagram is used to automatically generate code. The generation procedures call the input S-function to read the input signal from the memory hexadecimal ad-dress FCA0000, run the EPLL algorithm, and call the output S-functions to store the results to memory loca-tions from EA000000 to EA000010. When running the generated software in real time, it is essential that the execution takes place with the same sampling period as during code generation.
The steps presented during the EPLL implementation can be applied to other algorithms. The next section presents the rapid development path of the flicker meas-urement algorithm. However this approach can also be applied to the development of the remaining PQ algo-rithms, and even to the development of control strategies.
1.2.2 Flicker implementation
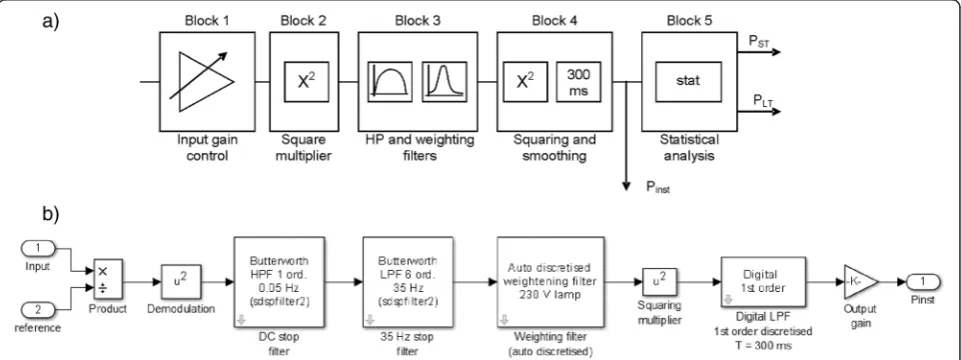
A nontrivial example of rapid prototyping and imple-mentation of a metering problem is the flickermeter. Light flicker measurement and the flickermeter are de-scribed in detail in standard EN 61000-4-15. Basically, the meter consists of several blocks (see Figure 7(a)).
The flickermeter is described in the standard as an analogue device, i.e. all signal processing blocks are
defined in the analogue domain. The reason for this is that at the time of the standard creation, the flicker-meter was intended to be single device built using stand-ard electronic parts. Nowadays, the flicker severity measurement is a function of a digital meter (PQ ana-lyser) but the algorithms for computing short-term flicker PSTand long-term flicker PLTmust follow the de-scription in the standard. In state-of-the-art devices, all the operations on the input signal are done in the digital domain. Consequently, the problem of implementing a flickermeter in a digital processor requires discretisation of the analogue blocks and implementation of the discrete transfer functions. The considered blocks are (see Figure 7(a)):
1. Input gain control block: in the standard, the block operates as a voltage adaptor and signal conditioning unit and provides initial scaling. In the digital model,
the block provides only the scaling, which is done by dividing the input signal by the reference signal. The reference signal is the half-period RMS value processed by the first order digital filter with a 27.3 s time constant (as defined in the standard). The filter has to be designed and implemented in the digital domain. 2. Square multiplier block: the squaring operation
resembles the behaviour of an incandescent lamp. The block, together with the high pass filter from the next block, operates as a demodulator. A digital implementation of this algorithm is straightforward. 3. High pass filter and the weighting filter: the blocks
consist of three filters. The first high pass filter eliminates the DC component of the voltage, and the standard suggests a first order filter with a−3 dB at 0.05 Hz cut-off frequency. The second filter is a low pass one, and the standard requires a sixth order Butterworth filter with a−3 dB at 35 Hz cut-off
Figure 6EPLL - diagram prepared for code generation.
Figure 7Block diagram and its Simulink model for instantaneous flicker computation.Block diagram of the IEC flickermeter according to the standard EN 61000-4-15(a)and its sample model for instantaneous flicker computation in MATLAB/Simulink(b).
frequency (for 230 V systems). A digital implementation of the filter requires utilisation of filter design tools in order to evaluate the parameters of the filter. The last filter is the co-called weighting filter. It simulates the spectral properties of the human visual system. The filter is described as a Laplace transfer function model: described in the standard and are different for 230 V and 110 V systems. Therefore the first operation is to obtain the discrete transfer function so the frequency response of the analogue filter and the discrete implementation are similar in the frequency domain.
4. Squaring and smoothing: this block performs two functions, it simulates the eye-brain perception by means of a squaring operation and emulates the memory effect of the brain. The effects can be implemented as the sliding mean operator, however the standard suggests the utilisation of a first order filter with a 300 ms time constant. The output of this block is instantaneous flickerPinst.
5. Statistical analysis: this is the only block that utilises digital data processing to obtain its output:PSTand PLTflicker levels. The computation is based on the
percentiles computation and calculates the flicker according to the formula:
logged during a specified time interval, where xis 0.1, 0.7, 1, 1.5, 2.2, 3, 4, 6, 8, 10, 13, 17, 30, 50, 80. The interval can vary from 1 to 15 m, however, the EN 61000-4-30 standard assumes 10 m for a typical flicker severity evaluation. This conforms with the interval set by EN 61000-4-30 for PQ evaluation. The evaluation ofPLTis performed using 12 samples
ofPST, hence the long-term flicker describes the
flicker severity for the last 2 h. Because the block is actually a discrete implementation in a digital processor, it requires numerical procedures for sorting and mathematical calculation.
The MATLAB/Simulink package provides toolboxes and blocksets for both digital and analogue system design and analysis. Therefore, implementation of the flicker-meter in MATLAB/Simulink follows the development stages of the rapid development method. The basic struc-ture of the Simulink diagram that implements the signal processing stages is shown in Figure 7(b). Note that the model closely resembles the description in the standard. Each filter defined by spectral properties is defined in the
z domain by means of standard tools available in the
MATLAB/Simulink package. The weighting filter requires special procedures. In [11], the transfer functions of the filters were obtained analytically by defining the filter in
thes domain and next using a Bilinear Transform to
ob-tain the transfer function in thezdomain. This procedure does not match the rapid implementation approach. Filter parameters in the flickermeter blocks are strictly defined in the standard, but their selection depends on the voltage level. On the other hand, there are several discretisation methods and the choice can affect the properties of the flickermeter. The discretisation also depends on sample time, which is related to the hardware platform, and there-fore can be unspecified at modelling time. Consequently, the best option is to discretise the filter numerically and let the software perform all necessary computations. The MATLAB/Simulink package supports this operation by providing commands for the immediate discretisation of transfer functions. This functionality is used to obtain a fully automatic discretisation of the weighting filter. Therefore, the filter is defined in the s domain and then numerically discretised using MATLAB commands.
The validation of the model and recalibration can also be done in the simulation environment. It requires additional blocks for test signal generation. The test signals are strictly defined in the EN 61000-4-15 standard. Figure 8 shows a sample flickermeter validation framework.
As in the case of the EPLL implementation in the flickermeter diagram, the signals are reconnected to the driver blocks to access the measurements and store the
PSTand PLTvalues. The C code is automatically gener-ated from the Simulink diagram, compiled, and executed in real-time by the Zynq hardware platform.
1.2.3 Results of the flicker algorithm
The results of the generated flickermeter are shown in Figure 9. The diagram presents 24 hours of
measure-ments. The upper diagram presents two PSTvalues: one
uncertainty is ± 0.1% of declared voltage (i.e. the grid’s nominal). Flicker uncertainty is 5% and is defined by IEC 61000-4-15. For the test device, the metering was done by means of voltage transducers of type LV 25-P [32]. According to the data sheet, the overall accuracy of the transducers is 0.9% of the voltage range, which is 400 V in this case.
The meters were arranged in the PQ metering labora-tory in which the building mains was available for meter-ing. The meters were connected to the same voltage signals so the comparison refers to the real metering situation.
The lower diagram presents the difference between the data series. The difference can be explained by the accuracy of the sensors. For the hardware platform, typ-ical off-shelf transducers were used with a conditional board not designed for precise measurements. On the other hand, the typical error allowed in the standard for
PSTis 5% whenPST= 1.
2 Conclusions
This article presented a method of rapid code generation for implementing and testing of PQ algorithms. The method covers not only the PQ meter development, but Figure 8The flickermeter model testing framework.
Figure 9The flickermeter results.
also the preparation of the certification tests and proce-dures. The MBD approach shortens the time from an idea to an operating device. A user is supported by the functions of a CAE package, can focus on the problem itself, and skip the laborious implementation details of the algorithms under development. In the presented case, Simulink was used as the CAE platform. The effi-ciency of the presented development path becomes ap-parent in the implementation of the flicker calculation algorithm. The flickermeter channel consists of a series of filters and data processing blocks. It was first devel-oped and validated in simulation, the C code was then generated and implemented on a real hardware plat-form. The correctness of the implemented algorithm was confirmed by the match of the generated flicker values with the results of the commercial reference metering device.
PQ measurements have recently become an important topic that has resulted in different regulatory documents. An example is the differences between the EN 50160 standard for supply quality and national regulations. The standard requires e.g. RMS voltage within ± 10% limits in relation to the nominal (or declared) value for low voltage networks. However, in some countries, the limits are different, e.g. in France, the admissible change is from−10% to +6%, and in Spain, it is ± 7%. In addition, the statistical measure differs: the standard requires computation of the 95 and 100 percentiles. The grid codes in Poland for a transmission system require a 99 percentile for flicker and voltage distortion when a wind farm connection is considered. There are also parame-ters not required in the standard but required in the grid codes, e.g. the THFF (telephone harmonic form factor). The metering interval is also subject to change, e.g. in Norway, a 1 minute interval is used. On the other hand, there is the possibility of change of the limit values, percentile, or even metering interval in the future. This requires additional work in the software of a PQ meter to make the change possible. The real problem arises when non-standard algorithms are required, e.g. the localization of a PQ disturbance source. This func-tionality is very useful when the introduction of PQ contracts is considered. However, the existing algo-rithms are not ready for implementation because of lack of efficiency.
The ability to easily add a new algorithm with new functionality to a PQ meter is clearly necessary. Rapid prototyping and implementation makes it possible to test the algorithm and produce the code without manual implementation.
This study highlights the need for a flexible and rapid development method for devices to meet the as yet non-existing standards. The presented approach is a step to-wards satisfying these demands.
Competing interests
The authors declare that they have no competing interests.
Acknowledgements
This work was supported by the AGH University of Science and Technology under European Regional Development Found, Subsidy no POiG.01.03.01-30-056/12 and by the AGH University of Science and Technology KIC-ASS Grant no 7.7.120.7037.
Received: 29 October 2014 Accepted: 2 January 2015
References
1. MHJ Bollen, IYH Gu,Signal processing of power quality disturbances(IEEE Press, New York, NY, USA, 2006)
2. A Zobaa, MM Canteli, R Bansal (eds.),Application of Signal Processing in Power Quality Monitoring, inPower Quality Monitoring, Analysis and Enhancement) (InTechOpen, 2012). doi:10.5772/21492
3. RV Dell'Aquila, L Balboni, R Morici,A new approach: modeling, simulation, development and implementation of a commercial grid-connected transformerless PV inverter, SPEEDAM International Symposium on Power Electronics, Electrical Drives, Automation and Motion, 1422–1429, 2010. doi:10.1109/SPEEDAM.2010.5542040 4. X Yang, B Kirby, Q Zhao, Y Ma, F Xu,Model-based design process for product
development of substation IEDs, 2nd IEEE International Conference & Exhibition (ENERGYCON), 2012, pp. 968–974. doi:10.1109/EnergyCon.2012.6348290 5. G Adam, A Zbanţ, G Livint,New Simulink control block for single phase shunt
active power filters, 8th International Symposium on Advanced Topics in Electrical Engineering (ATEE), 2013, pp. 1–4. doi:10.1109/ATEE.2013.6563485 6. A Kirubakaran, S Jain, RK Nema, DSP-controlled power electronic interface
for fuel-cell-based distributed generation. IEEE Trans. Power Electron.
26(12), 3853–3864 (2011). doi:10.1109/TPEL.2011.2138162
7. K Vardar, T Sürgevil, E Akpinar,Rapid prototyping applications on three-phase PWM rectifier and shunt active power filter. (International Conference on Electrical and Electronics Engineering, 2009), p. 258–262
8. P Meena, KU Rao, D Ravishankar,Real-time detection and analysis of PQ disturbances with DSP using MATLAB embedded link to code composer studio. (Third International Conference on Power Systems, 2009), p. 1–5. doi:10.1109/ICPWS.2009.5442725
9. K Kołek, K Piątek, P Włodarczyk, Rapid algorithm prototyping for SCADA applications, (Advances in Electrical and Computer Engineering, in press) 10. MF McGranaghan, S Santoso, Challenges and trends in analyses of
electric power quality measurement data. EURASIP J. Adv. Signal Process
57985, 1–6 (2007). doi:10.1155/2007/57985
11. LW White, S Bhattacharya, A Discrete, MATLAB-Simulink flickermeter model for power quality studies. IEEE Trans. Instrum. Meas.59(3), 527–533 (2010). doi:10.1109/TIM.2009.2023121
12. MI Milanes, V Minambres, E Romero, F Barrero,Quality meter of electric power systems based on IEEE standard 1459-2000. (Compatibility and Power Electronics, 2009), p. 86–92. doi:10.1109/CPE.2009.5156018
13. M Rogóż, Z Hanzelka,The design and construction of a power quality parameters recorder. 9th International Conference. (Electrical Power Quality and Utilisation, 2007), p. 1–6. doi:10.1109/EPQU.2007.4424150
14. J Krizan, L Ertl, M Bradac, M Jasansky, A Andreev,Automatic code generation from MATLAB/Simulink for critical applications. (IEEE 27th Canadian Conference on Electrical and Computer Engineering (CCECE), 2014), p. 1–6. doi:10.1109/CCECE.2014.6901058
15. MH Schwarz, H Sheng, A Sheleh, J Boercsoek,IEEE/ACS International Conference on Computer Systems and Applications, 1058–1063 (2008), 2008, pp. 1058–1063. doi:10.1109/AICCSA.2008.4493678
16. ET Mekonnen, J Katcha, K Parker,An FPGA-based digital control development method for power electronics. (IECON 38th Annual Conference on IEEE Industrial Electronics Society, 2012), p. 222–226. doi:10.1109/IECON.2012.6388804 17. R Selvamuthukumaran, R Gupta, Rapid prototyping of power electronics
converters for photovoltaic system application using Xilinx System Generator. IET Power Electron.7(9), 2269–2278 (2014). doi:10.1049/iet-pel.2013.0736 18. MATLAB Coder. User's guide, http://www.mathworks.com/help/pdf_doc/
coder/coder_ug.pdf. Accessed 5 December 2014
19. Simulink Coder. User's guide, http://www.mathworks.com/help/pdf_doc/ rtw/rtw_ug.pdf. Accessed 5 December 2014
21. Fixed-point designer. User's guide, http://www.mathworks.com/help/releases/ R2014b/pdf_doc/fixedpoint/FPTUG.pdf. Accessed 5 December 2014. 22. Mars Starter Kits, http://www.enclustra.com/en/products/hardware-kits/
mars-starter-kits/. Accessed 18 October 2014.
23. A Gupta, A Porippireddi, VU Srinivasa, A Sharma, M Kadam, Comparative study of single phase PLL algorithms for grid synchronization applications. IJECT3(4), 237–245 (2012)
24. S Shinnaka, A Robust, Single-phase PLL system with stable and fast tracking. IEEE Trans. Ind. Appl.44(2), 624–633 (2008). doi:10.1109/TIA.2008.916750 25. M Karimi-Ghartemani, M Mojiri, A Safaee, JA Walseth, SA Khajehoddin, P Jain,
A Bakhshai, A new phase-locked loop system for three-phase applications. IEEE Trans. Power Electron.28(3), 1208–1218 (2013). doi:10.1109/TPEL.2012.2207967 26. XQ Guo, W Wy, HR Gu, Phase locked loop and synchronization methods for
grid-interfaced converters: a review. PRZEGLĄD ELEKTROTECHNICZNY (Electric Rev)87(4), 182–187 (2011)
27. B Singh, SR Arya, Implementation of single-phase enhanced phase-locked loop-based control algorithm for three-phase DSTATCOM. IEEE Trans. Power. Deliv.28(3), 1516–1524 (2013). doi:10.1109/TPWRD.2013.2257876
28. M Karimi-Ghartemani, JA Walseth,Using the EPLL algorithm as a preprocessor for fault analysis. (11th International Conference on Information Science, Signal Processing and their Applications (ISSPA), 2012), p. 1377–1382. doi:10.1109/ISSPA.2012.6310508
29. M Karimi-Ghartemani, M Karimi-Ghartemani, Linear and pseudolinear enhanced phased-locked loop (EPLL) structures. IEEE Trans. Ind. Electron.
61(3), 1464–1474 (2014). doi:10.1109/TIE.2013.2261035
30. Optimization toolbox user's guide, MathWorks, http://www.mathworks.com/ help/pdf_doc/optim/optim_tb.pdf. Accessed 18 October 2014
31. Simulink. Developing S-functions, MathWorks, http://www.mathworks.com/ help/pdf_doc/simulink/sfunctions.pdf. Accessed 04 December 2014 32. Voltage Transducer LV 25-P, http://www.lem.com/docs/products/lv%2025-p.
pdf. Accessed 04 December 2014.
Submit your manuscript to a
journal and benefi t from:
7Convenient online submission
7Rigorous peer review
7Immediate publication on acceptance
7Open access: articles freely available online
7High visibility within the fi eld
7Retaining the copyright to your article
Submit your next manuscript at 7 springeropen.com