Copyright 0 1994 by the Genetics Society of America
Effective Population Sizes With Multiple Paternity
Derrick W.
Sugg*
and Ronald
K. Chesser*?+*Savannah River Ecology Laboratory, Aiken, South Carolina 29802 and tDepartment of Genetics and Institute of Ecology, University of Georgia, Athens, Georgia 30602
Manuscript received August 11, 1993 Accepted for publication April 26, 1994
ABSTRACT
While the concept of effective population size is of obvious applicability to many questions in population genetics and conservation biology, its utility has suffered due to a lack of agreement among its various formulations. Often, mathematical formulations for effective sizes apply restrictive assumptions that limit their applicability. Herein, expressions for effective sizes of populations that account for mating tactics, biases in sex ratios, and differential dispersal rates (among other parameters) are developed. Of primary interest is the influence of multiple paternity on the maintenance of genetic variation in a population. In addition to the standard inbreeding and variance effective sizes, intragroup (coancestral) and inter- group effective sizes also are developed. Expressions for effective sizes are developed for the beginning of nonrandom gene exchanges (initial effective sizes), the transition of gene correlations (instantaneous effective sizes), and the steady-state (asymptotic effective size). Results indicate that systems of mating that incorporate more than one male mate per female increase all effective sizes above those expected from polygyny and monogamy. Instantaneous and asymptotic sizes can be expressed relative to the fixation indices. The parameters presented herein can be utilized in models of effective sizes for the study of evolutionary biology and conservation genetics.
T
HE effective size of populations is a concept of con- siderable interest to population biologists because of its relationship to genetic variation and rates of in- breeding. Operationally, the effective size of a popula- tion can be defined as the size of an ideal population that would lose genetic variability, due to random processes, at the same rate as the actual population (WRIGHT 1931;-DE and BARROWCLOUGH 1987). The concept of effec- tive size is useful because it offers insight into future levels of genetic variability within and among groups in a population and the parameters that are important for determining rates of change in genetic variability. Ge- netic variability can be partitioned into several hierar- chical levels, each with a corresponding effective size
(CHESSER et al. 1993b). Population attributes such as in- breeding, dispersal, and mating tactics influence effective sizes to W n g degrees at each level (CHESER 1991a,b; CHESSER et al. 1993b) and play an important role in the evolution of social structures (CHESSER et al. 1993a).
While the concept of effective size is of obvious ap- plicability to many questions in population and conser- vation biology, its utility has suffered due to a lack of agreement among its various formulations (see HARRIS and ALLENDOW 1989). Many of these problems are re- lated to oversimplification of biological processes and restrictive assumptions. Recently, several attempts have been made to alleviate these shortcomings (CROW and DENNISTON 1988; CHESSER 1991a,b; CABALLERO and HILL 1992a,b; CHESSER et al. 1993b) while preserving con- cordance with the classical models O f WRIGHT (1969) and
CROW and KIMURA (1970) when the same assumptions are Genetics 137: 1147-1155 (August, 1994)
made (CHESER et al. 1993b). While these studies have ad- dressed the contributions of non random mating and in- complete isolation on effective population sizes, they need to be expanded to include more breeding systems.
Traditionally, multiple paternity has been used to de- scribe mating systems where there are multiple sires for a given brood (HASKINS et al. 1962; BOROWSKY and
KALLMAN 1976; BOROWSKY and KHOURI 1976; LESLIE and VRIJENHOEK 1977). Herein a broader definition is used to incorporate other systems of mating that result in more than one male sire for offspring produced during the lifetime of a single female. Using this definition, mul- tiple paternity also can be achieved through a series of broods being inseminated by different males; L e . , su- perfetation (SCRIMSHAW 1944) or serial monogamy. Re- gardless of how multiple paternity is achieved, it is ex- pected to increase the effective size beyond that expected if adults did not practice multiple paternity
(LESLIE and VRIJENHOEK 1977; VRIJENHOEK 1979; CHESSER
contributions of these factors to effective sizes will be dif- ficult to assess, and the genetic consequences of multiple paternity will be poorly understood.
The purpose of this manuscript is to extend the equa- tions for effective sizes presented by C ~ E R (1991a,b) and CHESER et al. (1993b) to include multiple paternity. The methodologies employed here can provide a guide for ex- tensions to other systems of matings. The results of these expressions will be compared to other models, and the relative influence of several parameters will be assessed. For the sake of brevity, extensions of previous models are explained in the text while modified expressions are pre- sented in the APPENDIX.
GENE CORRELATIONS
To determine effective sizes for subdivided popula- tions, it is necessary to obtain expressions for three vari- ables (COCKERHAM 1969,1973; CHESSER 1991a,b; CHESSER
et al. 1993b). Since there is the potential for relation- ships beyond full and half siblings when multiple pa- ternity is practiced, it is necessary to rederive expressions for the following variables:
F = correlation of genes within individuals (in- breeding coefficient).
within a breeding group (coancestry).
from different breeding groups.
e
= correlation of genes for random progenya = correlation of genes for random individuals
The parameters necessary to derive transition states for these variables are:
n, m = average number of breeding females and males, respectively, within a breeding group. average number of males mated by each female. number of breeding groups.
average of the number of progeny produced during the lifetime of a female that survive to reproduce.
variance in the number of progeny produced during the lifetime of a female that survive to reproduce.
average of the number of females mated by each male which result in progeny that survive to reproduce.
variance in the number of females mated by each male which result in progeny that survive to reproduce.
average of the number of progeny in a brood sired by a single male.
= variance in the number of progeny in a brood sired by a single male. -
dm, dJ = rates of migration among breeding groups for
The probability that random progeny born within a breeding group are sired by the same male is defined as
4m
= m[ai+
b(b-
l)]/en(n - 1) (cf. CHESSER et al.males and females, respectively.
1993b) and
4,
= (a:+ k(k
-
l))/lz(kn - 1) is defined as the probability that two randomly chosen progeny in a breeding group are the offspring of a given mother (Equation 5 of CHESSER et al. 199313). The parameter4m
represents the degree of polygyny with values of zero indicating complete monogamy and values of one in- dicating all progeny in a breeding group are sired by the same male. Values for4f
likewise range from zero (all progeny have different mothers) to one (all progeny have the same mother). Because multiple paternity can lead to relationships in a brood that span the range from half to full siblings (in the absence of inbreeding, av- erage coancestry of a brood can be 0.125 or 0.25), it is necessary to define a new parameter(4J
as the prob- ability that randomly chosen progenywithin a brood are the product of the same male.Values of zero indicate that each progeny in a single brood is the product of a different male (
p
= l ) , and values of one indicate progeny in a brood are the prod- uct of the same male (p
= k ) . Because 4 = k / p ,To determine how gene correlations accrue, it is nec- essary to develop transition equations for the critical variables across generations. CHESSER (1991a; Equation 15) has shown that the expected correlation of genes among full siblings is
where t references the generation. Using the parameters for probabilities of sharing parents described above, the average coancestry within breeding groups due to full siblings can be expressed as
2
where F refers to the inbreeding coefficient. Additional gene correlations within breeding groups can be devel- oped for siblings that share only one parent. Using the average coancestry of parents ( - y l ; CHESSER 1991b; Equa-
tion A.9), the average coancestry among half siblings is
kn
-
1 4Effective Size and Multiple Paternity 1149
where 8, and a, are the average coancestry within sions for instantaneous effective numbers that are ac- breeding groups and correlation of genes among curate for any generation and a single expression for groups, respectively. Gene correlations between non- the asymptotic effective size. These expressions will be sibling progeny can be determined using the average compared to those obtained under the assumption of coancestry of breeding adults
(y;
CHESSER 1991b; single paternity.Equation A. 10) Initial effective sizes: A critical effective size (identi-
B(nonsib),+, = (1
-
4Jy
Thus, the average coancestry of progeny in a breed- ing group (Equation A. 1) can be expressed by sum- ming Equations 4-6. CHESSER et aZ. (1993b; Equations 9 and 11) define the transitions for gene correlations within individuals (Ft+,) and among groups (a,,,), re- spectively. The complete transition for coancestry is obtained by substituting the expression for
F,,,
into Equation A.l to yield Equation A.2. Transition equa- tions for the gene correlations can be used to develop a transition matrix (T) to predict average correlations of genes at any generation t. Such a transition matrix must satisfy the requirement that (F,,,,et+,,
at+,] = T{F,,e,,
a,)+
C (see Equations A.3 and A.4).EFFECTIVE POPULATION SIZES
Accurate estimates for future levels of gene corre-
4 Nee
=
4/0
+4J
+
(1-
4fMm
kn - 1 kns - 1
fied by CHESSER et al. 1993b) is the number of random breeders that are necessary to produce the realized loss of genetic variation within breeding groups (coancestral effective size; N e e ) . This parameter, expressed in terms of coancestry, is
et+,
= 1/2N,+
[l-
1/2N,]8, ( i . e . , CROW and &MUM 1970), wheree,+,
corresponds to the portion of coancestry influenced by gene correlations among individuals within breeding groups ( COCKERHAM 1969, 1973; CHESSER 1991a,b). If it is assumed that contributions toe,+*
by Fand a are negligible (a good assumption for the first few generations), then the middle row of the transition matrix T (Equation A.3) becomes ( 0 , l - (1/2Nd), 0}, and the middle element of the vector C (Equation A.4) is 1/2N,. Thus, 1/2N, = (+A1+
+J
+
(1-
4)+J/8
and solving for the co- ancestral effective size-
-
4k(kn - I)(u:
+
k(k-
1))[ 1+
u ; + p ( p - 1)1
+
[k(kn-
1) - u:-
k(k - l)]44
+ b(b - 1))p(k
-
1) tn(n - 1)lations can be obtained with two methodologies; by iteration of the transition matrix (T; Equations A.3 and A.4), or by solving the transition matrix for ei- genvalues. The former method is preferred because of the large and cumbersome expressions resulting from the eigenvalue solutions. However, good approxima- tion for gene correlations can be obtained for short intervals of time by approximation of the eigenvalue solutions. We will derive expressions for effective sizes in the three stages described by CHESSER et aZ. (1993b). First, the initial effective sizes will be presented and results will be compared to formulas derived for single isolated populations with random mating and for sub- divided populations with nonrandom mating and single paternity. Subsequently, we will derive expres-
Note that when all of the progeny of a brood are the product of a single male
(4w
= l ) , this expression re- duces to that presented by CHESSER et al. (1993b; Equa- tion 53) which assumes single paternity. It can readily be seen in Figure 1 that the effective size with multiple pa- ternity ( N e @ ) is always as great or greater than the ef- fective size based on the expression in CHESSER et al.(1993b; N : @ ) . At its maximum value, the effective size with multiple paternity is twice that expected with single paternity.
The denominator in equations for coancestral effec- tive size can be simplified by accounting for variance in the number of progeny as in traditional expressions for effective sizes (cf. CROW and DENNISTON 1988). CHESSER
Nkl 2.00
1.75
1 S O
1.25
1 .OO
FIGURE 1.-Three-dimensional surface plots for the ratio of coancestral effective sizes with (Ne@; Equation 7) and with- out (NLo; CHESSER et al. 199313) multiple paternity. In each plot, ratios greater than one indicate conditions under
which expressions that account for multiple paternity result in coancestral effective size greater than that expected from systems that involve only one male mate. Plot A depicts the relative increase in effective size expected with changing probability that progeny within a brood are the product of the same male (+J as a function of the probability that progeny in a breeding group share the same sire (+J. Plot
B depicts the relative increase in effective size expected with changing probability that progeny within a brood are the product of the same male (9,) as a function of the prob- ability that progeny in a breeding group share the same mother Note that
+,
= 1 for the model presented by CHESSER et al. (1993b).the number of progeny produced by all breeding indi- viduals when the covariance in male and female progeny number is negligible (see also CROW and DENNISTON
1988). The relationship between total variation in prog- eny numbers and effective sizes can be shown to hold for systems of mating that involve multiple paternity, specifically
a:, = (1 +
4 3 4
-4 J 4
- k*(n - l)]. (8)Inspection of Equation 8 and Equation 25 of CHESSER et al. (199313) reveal that part of the total variation that had been attributed to males by CHESSER et al. (1993b) is no longer simply a function of the variation in prog- eny of females (a:), but it is now also a function of the number of sires of a brood
(4,~:).
Assuming that there is n o multiple paternity( 4 w
= 1 ) , Equations 8 and (25 of CHESSER et al. 199313) are equivalent. Uti-lizing Equation 8, the initial coancestral effective size can be expressed as
4k(kn - 1)
= a:,
+ (1 +
4 , ) k ( k - 1) ’ (9)The equations for initial effective sizes can be compared to those of CROW and DENNISTON (1988) by utilizing their assumptions. Because CROW and
DENNISTON’S model deals with only one population, there is only one breeding group ( s = l ) , and dispersal is complete for both sexes ( d m = df = 1). Also, assuming that all males mate ( m = n, b = 1 , and
ai = O ) ,
4m
will be zero and the total variance in prog- eny number becomesThese are not the only conditions under which
4m
will be zero (see CHESSER et al. 1993b), but are used simply for illustrative purposes. When there is random union of gametes, thenp
= 1, a% = 0 and a:, = a:. How-ever, if each female mates with only one male, then
p
= k , a; = 0 and the total variance in progeny number reduces to a:T = 2a:. In the case of random union of gametes, and remembering that 2n = N (total population size), the effective size becomes4k(kn - 1) k(kN - 2) Nee = a:
+
k(k - 1)CT:
+
k(k - 1) ’-
- (11)
which is twice the inbreeding effective size given by
CROW and DENNISTON (1988) and coancestral effective size given by CHESSER et al. (1993b), the same result obtained for Equation 7. Additionally, when there is only one mate per female, the effective size becomes
2k(kn - 1) k(kN - 2)
CT:
+
k(k - 1) a;+
k(k - 1) ’ (12)Ne = - -
identical to the values presented by CROW and
DENNISTON (1988) and CHESSER et al. (1993b), as expected.
Effective Size and Multiple Paternity 1151
individuals from different groups
dm
+ df- dmdf
+
(kn - l)(dm+
dr>4(kns - 1)
- -
dm
+ df
- dmdf+
(kn - l)(dm+
dr>.
(14) 2s 4(kns - 1)Low dispersal rates for either sex lead to low inbreed- ing effective size (and thus, rapid rates of inbreeding), when compared to intergroup effective size. Increas- ing the dispersal rate will increase the inbreeding ef- fective size; however, the gene diversity conserved within breeding groups can never be greater than that among groups in structured populations. If dispersal is complete in both sexes (dm = d, = l ) , then NeI will approach the value of Ne, with increasing values of ns
(see also CHESSER et al. 1993b).
The expression for Ne, is similar to the variance ef- fective size ( Nev) defined by CHESSER (1991b); however, these effective sizes are equivalent only under certain conditions. Because Nev depends on the number of progeny, while Ne, depends on the number of parents (CROW and KJMURA 1970), changing population size will lead to deviations in the respective effective sizes. By as-
suming that the sex ratio of breeding individuals (m/n) is constant over generations, even with changing population size, the ratio can be expressed as R/ (1 - R )
.
SubstitutingR/( 1
-
R ) for m/en and nk( 1 - R) for n in Equation 14 gives the variance effective sizeing coefficient of WRIGHT (1969). Their model does not explicitly define breeding groups and dispersal rates and, for this reason, does not account for all gene correlations (see CHFSSER et al. 199313). To determine instantaneous ef- fective sizes, one must first determine the rates of change for all gene correlations. FALCONER (1989) has shown that the rate of change in inbreeding is
By substituting Equation 9 of CHESSER et al. (1993b) for F,,, , Equation 16 becomes
AF=
e,
- F, -(e,
- aJ(1 - l/s)(d,+
df- dmd,)1 - 4
9 (17)which accounts for gene correlations within individuals (F), among individuals within groups
(e)
and among individuals from different groups (a). Definitions of the F statistics (COCKERHAM 1973)can be substituted into Equation 17 to yield
where the subscripts I, S and T refer to individuals, breeding groups and the entire population, respectively. Because NeI = 1/ (2hF), the instantaneous inbreeding- effective size can be expressed as
Ne" =
a:
+
k(k - 1) a:+
k(k - 1))(
R(d + b(b- 1)) d,+
df - d,df (k2n(l - R) - l)(d,+
d j k(kZn(1 - R) - 1) k(k2n(l - R) - 1) (1 - R)(kn(l - R) - 1)+
4(k2n(l - R)s - 1 )1
When the population census is constant and sex ratios are even, Nevwill equal N,. Alternatively, if population size is increasing or decreasing, Ncv may be considerably greater than or less than N,, respectively with single and multiple paternity.
Instantaneous effective size: While equations for ef- fective sizes presented thus far provide reasonable a p proximations for a few generations after gene correla- tion start to accrue, they can deviate considerably from true values because the contributions of inbreeding ( f l
and intergroup (a) correlations become increasingly important. CABALLERO and HILL (1992b; Equation 10)
derived a value for the asymptotic effective size which is obtained after several generations of consistent mating tactics with F, representing the within-group inbreed-
1 - Fm
2[(1
-
(1 - l/s)(d,+ dr- dmd,))F,
- Fm] * (20)A similar representation of the intergroupeffective size can be developed substituting Equation 11 of CHESSER et al. (199313) and the Fstatistics into Aa = (a,+l - at)/(l - a,)
and solving for
1
+
N, = dm
+ df- dmdr
(kn-
l)(dm+
d,)4(kns - 1)
2s
F,[3(dm + d,) - 2dmdfl'
"- -
1152 Sugg and Chesser
Nev Note that the breeding parameters and variance in progeny number are absent from Equations 20 and 21, although all are necessary for determining the values of the F statistics. Although these expressions (20 and 21) are identical to those derived in CHESSER et al. (1993b), their values will not be identical when multiple paternity is evident
(4w
> 0 ) . These expressions yield exact fits to values obtained by iterating the transition matrix(T;
equations A3 and A.4). Iteration of the transition matrix or Equations 20 and 21 has the advantage of determining effective sizes at any time t after gene correlations have begun to accrue, while the methodologies presented in Equations 13 and 14 yield only initial values (F
=
a=
0).Asymptotic effective sue:
As
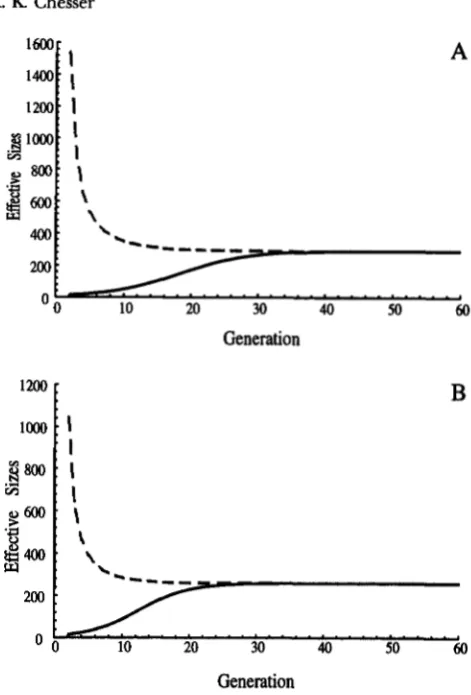
has been shown by CHESSER et al. (1993b; see also CABALLERO and HILL 1992a), subsequent to several generations all effective sizes converge on the same asymptotic value. The rate at which effective sizes approach asymptotic values (de- noted by a “hat”) is largely dependent upon dispersal rates. Figure 2 shows two situations that differ only in dispersal rates. It is readily seen that an increase in dis- persal (D = dm+
df - d,df) from 0.19 (Figure 2A) to 0.285 (Figure 2B) decreases the time to asymptote by 11 generations. In general, the change in time to reach asymptote can be expressed as AT = 2/(3-AD), pro- vided breeding and dispersal tactics remain constant(see also CHESSER et al. 1993b).
Given the above dependence upon dispersal rate, the asymptotic effective size can be estimated by substituting D into Equation 21
2s
Ne, z
-
3DFST
because the contribution of dmdf is negligible for large
s. At asymptote NeI
Ne,,
therefore Equations 20 and 22 should also be approximately equal2s 1 - FIT
*=
-
3DFsT
2[(
1 - (1 - 1/s)D)Ffl -PITI
’ (23)and solving Equation 23 for D will yield
The expression for dispersal can be substituted into either equation for instantaneous size (Equations 20 or 22) to solve for the asymptotic effective size
which is identical to the solution obtained by CHESSER et al. (1993b; Equation 48). The reason that these ex- pressions are identical is because the influence of breed- ing tactics, such as multiple paternity and polygyny, on gene correlations is subsumed in the fixation indices. A word of caution is needed in that the F statistics should
A
40 50 60
Generation
B
1”1
‘
“““uw)
0 0
...
10 20 30 40 50 60Generation
FIGURE 2.-Inbreeding (Ne,, solid lines) and intergroup
( N m , dashed lines) effective sizes from the generation when gene correlations begin to accrue until asymptotic values are obtained. In both plots, values of k = u: = 2 , n = s = 20,
+,,,
= 0.3, and +u = 0.5 were used. In plot A, dispersal rate was 0.19with d m = d = 0.1. In plot B this rate was increased by 50% to 0.285 w i d all dispersal due to males (d, = 0). Comparing these plots show that the change in time to asymptote is de- creased by
-
2 / ( 3 h D ) , where D = d m+
df-
d,d,.be applied to the lowest levels at which gene correlations begin to accrue. Sampling regimes which combine breeding groups will incorrectly estimate 8 leading to biased estimates for FST and F,. In general, the asymp-
totic estimate of effective size (and instantaneous ef- fective sizes based on Equations 20 and 21) will be applicable only when FIT < FST and F, < 0 as would be expected if breeding groups are accurately defined
(see also COCKERHAM 1973).
As
with initial and instantaneous effective sizes, asymp- totic sizes are larger with more than one sire per brood. In the case of random union of gametes (Figure 3;4m
= 0 ) , effective sizes with multiple paternity are ini- tially twice as large as effective sizeswith only one sire per brood; however, at asymptote they are only 1.92 times asEffective Size and Multiple Paternity 1153
0 1.60 5
&? 1.50
Iq/
1.301.00 . ' . . . . . ' . ' . . . . ' . . . . ' . . . . . ' . . . I
0 10 20 30 40 50 60
Generation
FIGURE 3."Ratio of effective size when $ m = 0 (no progeny in a brood sharing a sire) to effective size when
4,"
= 1 (all progeny in a brood sharing the same sire). In each plot solid lines represent inbreeding effective sizes ( N , ) and dashed lines represent intergroup effective sizes ( N e - ) . Values of k = u: = 2, n = s = 20, and d m = d, = 0.1 were used for each plot. Effective sizes with multiple paternity are always greater than with single sires of broods (ratios greater than 1). Although initial effective sizes start at the theoretical maximum for a given breeding system, asymptotic values are lower. In the case of all males in a breeding group mating, effective sizes are nearly double with multiple paternity. When the number of mating males decreases, the difference in effective sizes for multiple and single paternity are decreased.the asymptotic difference is always less than the initial difference.
DISCUSSION
Traditional expressions for Ne, and Ne, (e.g., WRIGHT
1922; CROW and KIMURA 1970) have employed assump tions that restrict the application of these concepts to isolated populations that practice random mating. The expressions presented herein provide the basis for es- timating the loss of genetic variation within and among breeding groups in subdivided populations exhibiting different dispersal regimes, mating tactics, and brood sizes. CHESSER et al. (199313) have shown that failure to take such population level parameters into account can lead to overestimates (in the case of Ne,) or underesti- mates (in the case of N,,) of the true effective sizes. Given the degree to which effective sizes are affected by polygyny, the influence of multiple paternity is of obvi- ous importance.
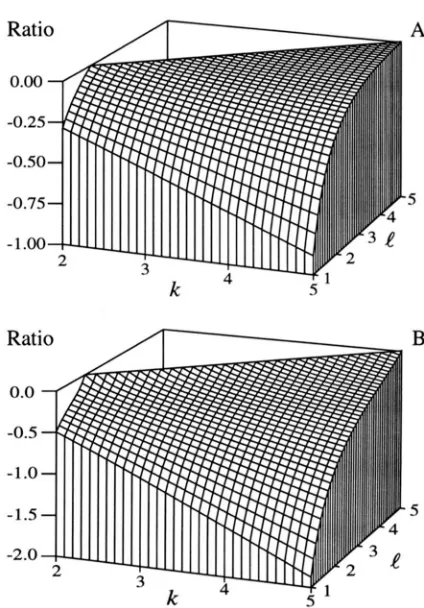
It has been suggested that the number of progeny produced is a more important for the maintenance of genetic variation than the number of male mates per female (WAPLES 1987). The relative contribution of brood size ( k ) and the number of males mated per fe- male ( I ) to effective sizes can be visualized by deter- mining the partial derivatives for equations of initial ef- fective size with respect to I and k and examining their ratios with changing values of k and
e.
Increasing the number of males mated per female will not be moreRatio
-0.25
-0.50
-0.75
-1.00
2
Ratio
B
0.0
-0.5
-1.0
-1.5 5
-2.0
FIGURE 4.Threedimensional surface plot depicting the relative importance of changing the number of surviving off- spring ( k ) and the average number of males mated by each female
( e ) .
Plot A represents the ratio (aN,/ae)/(aN,/ak)with values less than -1 indicating that changes in
e
results in faster changes in inbreeding effective size. Plot B represents the ratio (aN,v/dt)/(dN,Jt3k) with values less than -1 indicat- ing the same outcome as for plot A. Necessary parameters for both plots were defined as b = u: = 1, d m = d, = 0.25,k = ui, m = n = 15,
p
= 2, u; = 0, and s = 20. These figures show that changing k always results in more rapid changes in inbreeding effective size than does changinge;
however, this is not the case for variance effective size. The missing area on the surface of each plot represents impossible values for the independent variables.important than changing the number of surviving off- spring for initial N,, (ratio is never less than -1 for rea- sonable values of k , Figure 4.4). Increasing
e
is more important than increasing k for initial variance effective size increases when brood sizes are greater than three(Figure 4B); however, this effect is asymptotic as noted by WAPLES (1987).
The relative contributions of progeny number ( k )
and multiple paternity
( e )
discussed above are depend- ent on values for the variances of these parameters. Ob- viously, if the variance in k is zero, then the change ofNd relative to the change in k will likewise be essentially zero, especially if n is large. Because a Poisson distribu- tion of progeny numbers is commonly assumed (see
1154 D. W. Sugg and R. K.
is often a fixed tactic ( i. e.,
CT;
= 0). When both variances are assumed to be zero, the relative contributions of mul- tiple paternity to Ne, are always greater than those at- tributable to changes in progeny number; however, the relative contributions to Ne, remain unchanged. In situ- ations where there are limits on increasing k , then breeding tactics that increase the number of male mates will decrease rates of loss of genetic variation.Initial and asymptotic effective sizes differ in two re- gards. In the case of variance and intergroup effective sizes, the initial values are always greater than the asymptotic values. The opposite condition holds for in- breeding and coancestral effective size. Also, all effective sizes have identical values at asymptote, but they can differ considerably when gene correlations begin to ac- crue. The reason that initial values are dissimilar is that gene correlations are accruing at different rates within individuals, within breeding groups, and among breed- ing groups. With consistent breeding tactics and dis- persal regimes, the rate of change in gene correlations become equivalent and WRIGHT’S (1969) F statistics be- come asymptotic (see CHESSER 1991a,b). The rate at which the asymptote is reached depends on the effective number of migrants, which in turn depends on proportions of males and females dispersing and their relative contribu- tions to the variance in progeny numbers. Both initial and asymptotic effective sizes have utility in population genet- ics; however, the instantaneous effective sizes are likely to be most valuable when either contributions to variance in progeny numbers and dispersal rates vary.
Multiple paternity can have great consequences for both the initial and asymptotic effective sizes. Equations 11 and 12 show unequivocally that initial effective sizes are twice as large with multiple paternity, as is expected for single paternity. As gene correlations continue to accrue, this difference is reduced, and, at asymptote, only systems of mating that result in random union of gametes maintain an effective size nearly double that expected with single paternity (Figure 3). As the number of males actually mating decreases, the impact of mul- tiple paternity decreases, as would be expected.
The results presented herein show that breeding structure can have great impacts on gene diversity in natural and captive populations. Increasing the number of males that contribute to the gene pool obviously in- creases all of the effective sizes, although the relation- ship is asymptotic. Breeding tactics that maximize the numbers of males mating preserve the maximum amounts of gene diversity at all levels, and, therefore, provide the means for greater adjustments to environ- mental change. The ability to double effective sizes is unrealistic for organisms that are unable to mate with more than one male during a breeding season; however, when generation times allow multiple breeding seasons, significant increases in effective sizes can be achieved. Because all effective sizes are identical at asymptote, then captive breeding programs that argue for mainte-
nance of genetic diversity either within or among breed- ing groups are moot if mating tactics and dispersal re- gimes are held constant.
It is clear from the expressions presented herein that all aspects of the natural history of species play an im- portant role in the fate of gene diversity within and among populations. Traditional models of effective population sizes have had limited capacity for incorpo- rating the complexity of various breeding tactics and dispersal regimes into their formulations. The expres- sions presented herein demonstrate that multiple pa- ternity, as well as other mating schemes, can be a crucial determinant of rates of change in gene diversity and inbreeding in natural populations. These parameters can now be readily incorporated into predictive models of effective sizes for the study of evolutionary biology and conservation genetics.
Thanks are extended to F. S. DOBSON, 0. E. RHODES, JR., and three anonymous reviewers for their helpful comments on this manuscript. This work was supported by funds from contract (DE-AC09-765R00- 819) between the United States Department of Energy and the Uni- versity of Georgia’s Savannah River Ecology Laboratory.
LITERATURE CITED
BOROWSKY, R., and K. D. KALLMAN, 1976 Patterns of mating in natural populations of Xiphophorus (Pisces: Poeciliidae). I. X. rnaculatus
from Belize and Mexico. Evolution 30: 693-706.
BOROWSKY, R., and J. KHOURI, 1976 Patterns of mating in natural populations of Xiphophoms. 11. X. variatus from Tamaulipas, Mexico. Copeia 1976 727-734.
CABALLERO, A., and W. G. HILL, 1992a A note on the inbreeding ef- fective population size. Evolution 46: 1969-1972.
CABALLERO, A., and W. G. HILL, 199213 Effective size in nonrandom mating populations. Genetics 1 3 0 909-916.
CHESSER, R. IC, 1991a Gene diversity and female philopatry. Genetics CHESSER, R. K , 1991b Influence of gene flow and breeding tactics on
gene diversity within populations. Genetics 1 2 9 573-583. CHESSER, R IC, M. W. SMITH and M. H. SMITH, 1984 Biochemical ge-
netics of mosquitofish. 111. Incidence and significance of multiple insemination. Genetica 6 4 77-81.
CHESSER, R. K., D. W. S u a , 0. E. RHODES, JR., J. M. NOVAK and M. H. SMITH, 1993a The evolution of mammalian social structures. Acta Theriol. 38: (Suppl.2): 163-174.
CHESSER, R. K., 0. E. RHODES, JR., D. W. Sum and A. F. SCHNABEL, 1993b Effective sizes for subdivided populations. Genetics 135:
COCKERHAM, C. C., 1969 Variance of gene frequencies. Evolution 23:
COCKERHAM, C. C., 1973 Analysis of gene frequencies. Genetics 7 4
CROW, J. F., and C. DENNISTON, 1988 Inbreeding and variance effec- tive population numbers. Evolution 4 2 482-495.
CROW, J. F., and M. KIMURA, 1970 A n Introduction to Population Genetics Theory. Harper & Row, New York.
FALCONER, D. A., 1989 Intz-oduction to Quantitative Genetics, Ed. 3. Longman, London.
HARRIS, R. B., and F. W. ALLENDORF, 1989 Genetically effective popu-
lation size of large mammals: an assessment of estimators. Con-
HASKINS, C. P., E. F. HASKINS, J. J. A. MCLAUGHLIN and R. E. HEW^,
serv. Biol. 3: 181-191.
1962 Polymorphism and population structure in Lebistes reticu- latus, an ecological study, pp. 320-395, in Vertebrate Speciation, edited by W. F. Blair. University of Texas Press, Austin. LANDE, R., and G . F. BARROWCLOUGH, 1987 Effective population size,
genetic variation, and their use in population management, pp. 86-123, in Viable Populations for Conservation, edited by M. Soule. Cambridge University Press, New York.
127: 437-447.
1221-1232.
72-84.
Effective Size and Multiple Paternity 1 1 5 5
LESLIE, J. F., and R. C. VRIJENHOEK, 1977 Genetic analysis of
natural populations of Poeciliopsis monacha. J. Hered. 6 8
ROBBINS, L. W., G . D. HARTMAN and M. H. SMITH, 1987 Dispersal, reproductive strategies, and the maintenance of genetic variability in mosquitofish ( Gambusia affinis)
.
Copeia 1987:SCRIMSHAW, N. S., 1944 Superfetation in poeciliid fishes. Copeia 1944:
VRIJENHOEK, R. C., 1979 Genetics of sexually reproducing fish in a 301-306.
156-164.
180-183.
highly fluctuation environment. Am. Nat. 113 17-29.
WAPLES, R. S., 1987 Sperm storage, multiple insemination, and ge-
netic variability in mosquitofish: a reassessment. Copeia 1987:
WRIGHT, S. 1922 Coefficients of inbreeding and relationship. Am.
WRIGHT, S. 1931 Evolution in Mendelian populations. Genetics 16
WRIGHT, S. 1969 Evolution and Genetics of Populations. IV. The Theory of Gene Frequencies. University of Chicago Press, Chicago.
Communicating editor: B. S. WEIR 1068-1072.
Nat. 5 6 330-338.
97-159.
APPENDIX
Transition equations for coancestry with multiple paternity: Equation A1 represents the summation of Equations 4-6 from the text, and Equation
A2
expands the expression to include equations for the transition of inbreeding from Chesser et al. (199313; Equation 9).B*+l = f Y { X F 4 2
+
Wf+l + A!(1 2 + FJ + (1 - +J[
(
1 -(
1 --
;:s--ll)dm)ef + (1 - E ) d m a t ] }(-41 )
++{
(1 - 9 ) + ~ 1 + 2 FS+ [2-
+ m - (1 - -)(dm(l kn - 1 -+A
+
d>]ef+
Wf+,+
(1 - =)(dm(' -$3
+ +at} k n - 1kns - 1
et+, =
9/u
+9J
+ (1 -9J9,(,
+ F3
8 (A2)
2 1 - 1" d,,,+d,-d,,,dJ +4,(1-$J 1 - 1"
+
(
(
3
)
( (
k n - ' ) d m ) + ( l - 9 > [ * - 9 m - ( 1 - ~ ~ d m ( l - 9 ~ + d J ] kns- 1 kns- 14 Or
2 1 -
-
(dm+
df- dJ>+
(1 - c#)J(l - =)dm+
(1 - $>(l - &)(dm(1 - +J +'2
+
(
3
4 at.Transition matrix used in determination of long-term effective population sizes: Exact solutions for gene corre- lations at any time can be obtained by iteration of the matrix T (Equation A.3) where A = ( k n - 1 ) / ( kns - 1) and D = d m
+
dl-
dmdT0 1 - (1 - l/s)D (1 - l/s)D
T = E . ; + ( l - 9 h r # J m 2(1 - (1 - + l/s)D) [2 - r#Jm
+
+/(l - (1 - - r#~J(l A)(dm(l - (1 - - 93 A)dJ +9 1
2(1 - l/s)D+
$/(l - +,)(1 - A)dm+ (1 - 9>(dm(1 - 4%) + d,)
8 4 4
1.
2(D/s)
+
A(dm+
dJ4
0 2 ( D / s )
+
A(dm+
d,)4 1 -
(A3) For the transition equations to be complete, a constant vector (Equation A.4) must be added such that
0