Independent component analysis techniques and their
performance evaluation for electroencephalography.
VIGON, Laurence Celine.
Available from Sheffield Hallam University Research Archive (SHURA) at:
http://shura.shu.ac.uk/20479/
This document is the author deposited version. You are advised to consult the publisher's version if you wish to cite from it.
Published version
VIGON, Laurence Celine. (2002). Independent component analysis techniques and their performance evaluation for electroencephalography. Doctoral, Sheffield Hallam University (United Kingdom)..
Copyright and re-use policy
See http://shura.shu.ac.uk/information.html
Sheffield Hallam University Research Archive
,AMPUS, PONl) ctREET,
SHEFFIELD, S1 V
1 01 7 1 5 6 3 5 2
ProQuest Number: 10701126
All rights reserved
INFORMATION TO ALL USERS
The quality of this reproduction is dependent upon the quality of the copy submitted.
In the unlikely event that the author did not send a com plete manuscript and there are missing pages, these will be noted. Also, if material had to be removed,
a note will indicate the deletion.
uest
ProQuest 10701126
Published by ProQuest LLC(2017). Copyright of the Dissertation is held by the Author.
All rights reserved.
This work is protected against unauthorized copying under Title 17, United States C ode Microform Edition © ProQuest LLC.
ProQuest LLC.
789 East Eisenhower Parkway P.O. Box 1346
Independent Component Analysis Techniques
And Their Performance Evaluation For
Electroencephalography
Laurence Celine Vigon
A thesis submitted in partial fulfilment of the requirements of
Sheffield Hallam University
for the degree of Doctor of Philosophy
April 2002
I dedicate this thesis to my beloved parents Georges and Nelly Vigon, and to my dearest sister Corinne Vigon, for always keeping faith in me
Acknowledgements
I am grateful to have received the joint Sheffield Hallam University - Sheffield University research grant which gave me the opportunity to pursue my PhD studies and carry out this study within the research community of both Universities.
I would like to deeply thank Prof A.K. Ray, head for research of the Electronics group, who kindly helped me with financial assistance during my final year and made it possible for me to complete my PhD.
I would like to express my very special thanks and profound gratefulness to Prof J.E.W. Mayhew for his continuous and most valuable help and guidance as a supervisor during the project, and to Dr N.A. Taroyan and Prof J.P. Frisby for their active collaboration to the study and for numerous and valuable discussions. I am very grateful to Dr Peter Furness for helping with the data recording procedures, to Dr David Buckley for his help in designing the experiment, and to Drs David Johnston and Olivier Pascalis for valuable discussions. Everyone in the Vision Research Unit at Psychology Department - Sheffield University, provided a warm welcome to this wonderful research environment and made it possible for me to use their facilities and equipments, and with their kind help and assistance to design experiments and record a considerable amount of data. I benefited greatly from this collaboration which provided me with a deeper understanding of neuroscience and the clinical importance of this area of research. And my special thanks also go out to the kind co-operation of all the subjects who took part in the electroencephalogram data recordings.
Declaration
No portion of the work referred to in this thesis has been submitted in support of an application for another degree or qualification to this or any other university, institute of learning or industrial organisation.
Laurence Celine Vigon
Abstract
The ongoing electrical activity of the brain is known as the electroencephalogram (EEG). Evoked potentials (EPs) are voltage deviations in the EEG elicited in association with stimuli. EPs provide clinical information by allowing an insight into neurological processes. The amplitude of EPs is typically several times less than the background EEG. The background EEG has the effect of obscuring the EPs and therefore appropriate signal processing is required for their recovery.
The EEG waveforms recorded from electrodes placed on the scalp contains the ongoing background EEG, EPs from various brain sources as well as signal components with sources external to the brain. An example of externally generated signal which is picked up by the electrodes on the scalp is the electrooculogram (EOG). This signal is generated by the eyes when eye movements or blinks are performed.
Saccade-related EEG waveforms were recorded from 7 normal subjects. A signal source separation technique, namely the independent component analysis (ICA) algorithm of Bell and Sejnowski (hereafter refereed to as BS_ICA), was employed to analyse the recorded waveforms. The effectiveness of the BS_ICA algorithm as well as that of the ICA algorithm of Cardoso, was investigated for removing ocular artefact (OA) from the EEG. It was quantitavely demonstrated that both ICA algorithms were more effective than the conventional correlation-based techniques for removing the OA from the EEG.
A novel iterative synchronised averaging method for EPs was devised. The method optimally synchronised the waveforms from successive trials with respect to the event of interest prior to averaging and thus preserved the features of the signals components that were time-locked to the event.
The recorded EEG waveforms were analysed using BS_ICA and saccade-related components (frontal and occipital pre-saccadic potentials, and the lambda wave) were extracted and their scalp topographies were obtained. This initial study highlighted some limitations of the conventional ICA approach of Bell and Sejnowski for analysing saccade-related EEG waveforms.
Novel techniques were devised in order to improve the performance of the ICA algorithm of Bell and Sejnowski for extracting the lambda wave EP component. One approach involved designing a template-model that represented the temporal characteristics of a lambda wave. Its incorporation into the BS_ICA algorithm improved the signal source separation ability of the algorithm for extracting the lambda wave from the EEG waveforms. The second approach increased the effective length of the recorded EEG traces prior to their processing by the BS_ICA algorithm. This involved abutting EEG traces from an appropriate number of successive trials (a trial was a set of waveforms recorded from 64 electrode locations in a experiment involving a saccade performance). It was quantitatively demonstrated that the process of abutting EEG waveforms was a valuable pre-processing operation for the ICA algorithm of Bell and Sejnowski when extracting the lambda wave.
Nomenclature
List of abbreviations
(in alphabetical order)
ANOVA Analysis-of-variance
BS_ICA ICA algorithm of Bell and Sejnowski
BSS Blind Signal Separation
DAC Data Acquisition Computer
ECG Electrocardiogram
EGI Electrical Geodesic Incorporation
EEG Electroencephalogram
EMG Electromyogram
EOG Electoocculogram
EOGl Left EOG channel
EOGr Right EOG channel
EP Evoked Potential
ERP Event-Related Potential
Ext.ICA Extended version of the ICA algorithm of Bell and Sejnowski
FCM Fuzzy C-Means
GSN Geodesic Sensor Net
GSNIC Geodesic Sensor Net Interface Cable
ICA Independent Component Analysis
Infomax Information Maximisation
JADE Joint Approximate Diagonalisation Eigen-matrices
ms Milliseconds
MI Mutual Information
Net Amps Net Amplifier unit
NLPCA Non-linear Principal Component Analysis
NS Negative Shift
OA Ocular Artefact
PCA Principal Component Analysis
RLS Recursive Least Square
SAS Statistical Analysis System
Std Standard deviation
STDR Standard Deviation Ratio
SSS Signal Source Separation
SVD Single Value Decomposition
USB Universal Serial Bus
AV Microvolts
List of symbols
N n
i, j, k, I, r
S — { $ h • • • ? ^ n }
X = {xi, • • • ? xn
N= {ni,
5
U = {uh . . . )
H;
an • •
A = • • •
.
_am• •
v
~wn . • wm
w=
w.ni •number of time points in a waveform
number of original sources and number of recorded (measured) mixtures (i.e. number of channels)
counting index which take positive integer values
digital sample (time) index which take positive integer values matrix of original sources signals
matrix of recorded mixtures Noise matrix
matrix of estimated underlying signals
mixing matrix where the a,j are the mixing coefficients
unmixing (or separating) matrix where the wy are referred to as weights
(or unmixing coefficients).
/
P
M =
Mn . . Mln
H a • • H n
A = { Al, ... , An } T = { T1, . . . , T n j
function that relates the measured signals to the transmitted signals matrix of normalised (i.e. no amplitude information) principal components
eigen-matrix (set of linear weights factors) or mapping matrix
L matrix of non-normalised (i.e. that contain amplitude information) principal components
Rx covariance (correlation) matrices of mixtures X
Ry covariance (correlation) matrix of output signals Y
Rs covariance (correlation) matrix of source signals S
Rv covariance (correlation) matrix of whitened mixtures V
p(), q() probability distribution functions
E[.] expectation operation
J2(.) NLPCA cost function
g(.) non-linear transfer function
ln(.) Natural logarithm function
v whitened mixture
y output of tranfert function g(.)
D, h, m intermediate variables used for computational purposes.
Q inverse correlation matrix of the input signals in the RLS algorithm
e estimated error
P constant forgetting term
Tri[.] operation that computes the upper triangular part of a matrix
Ox(.) whitening operation
Y probability distribution
H(.) Entropy measure
I(.) Mutual information
First derivative with respect to weight W
°c proportional to
W0 bias weight matrix
Wopt optimum value for W
J Jacobian matrix
AW Rate of change in the weight matrix W
AW0 Rate of change in the bias weight matrix W0
rjn Learning rates
mi, m2, m3 gradients of the lambda wave template model
Cj
c
2
cx
Kt C() Cum(n)(.) diag(.)
E
In
V
T
-1
H (or#)
A
tanh( ) Z
Bn . B =
. BIn:
constant that controls the contribution of the model to the BS_ICA algorithm
constant that controls the contribution of the error to the model cost- function
Finite fourth-order cumulants of mixture X
Kurtosis
function of Cx
nth-order cumulants function diagonalisation operation sum operation
Identity matrix
matrix of whitened mixtures transpose operator
inverse operator
Hermetian operator (or pseudo-inverse operator) Estimation operaor
Conjugate operator
norm (or absolute function) square route function hyperbolic tangent function Unitary matrix
Set of matrices (input to the joint diagonalisation process)
B
e
p o r ki, k2
s P St
Sa
fraction symbol row vector original signal recovered signal scaling factors Euclidean distance correlation coefficient
Sum of normalised contributions of a component to all electrodes Sum of normalised contributions of a component to the parieto occipital area of the cerebral cortex
s topographic feature (percentage of Sx over St).
Ai, A2 names of the electrodes located on the scalp region near the ears
c3)c4>c z
names of the electrodes located in the central region of the scalpF3, F4, F7, Fg, Fz names of the electrodes located in the frontal region of the scalp
Fpi,Fp2 names of the electrodes located in the frontal pole region of the scalp
P3 P4 PZ names of the electrodes located in the parietal region of the scalp
Oi o2(oz
names of the electrodes located in the occipital region of the scalpT3, T4, T5, T6 names of the electrodes located in the temporal region of the scalp
fl> fc> f3 temporal features of the lambda wave
a viewing angle
F set of BS_ICA-extracted component waveforms
V cluster prototype (mean) in fuzzy c-means clustering algorithm
( iteration number in fuzzy c-means clustering algorithm
Mik membership value of a waveform k to a class i
dik distance between a pattern k and the ith cluster center
W matrix of degree of membership values
S fuzzification factor
%C percentage of waveforms classified to a category
List of Figures
Fig.1.1 A typical lambda wave together with its saccadic EOG waveform.
Fig.2.1 The signal source separation (SSS) principle.
Fig.2.2 Block diagram of the operation of NLPCA when applied to 2 sources; Ox(.) is the
whitening process of the mixtures.
Fig.2.3 The information theoretic principle
Fig.2.4 Optimal information flow in sigmoidal neurons [1.9]
Fig.2.5 A diagram to illustrate the operation of BS_ICA.
Fig.2.6 A diagram to illustrate the operation of JADE: inverting A by chaining a whitener
and a unitary matrix.
Fig.3.1 Spike-shaped EOG waveform caused by blinks.
Fig.3.2 Square-like waveforms caused by saccadic eye movements.
Fig.4.1 The international 10-20 system of electrode placement: (a) top view and (b) side
view of the head with the alpha-numeric designation of electrodes placement on the scalp for the EEG recordings.
Fig.4.2 The Electrical Geodesics Inc. (EGI) system.
Fig.4.3 The Electrical Geodesics sensor network (GSN) of 64 electrodes.
Fig.4.4 Subject wearing the 64-channel GSN.
Fig.4.5 A representation of the checkerboard showing the directions of saccade and the
Fig.4.6 Composition of the recorded trials.
Fig.5.1 Typical distributions of transformed EEG waveforms (the horizontal axis is
amplitude in juV 2 and the vertical axis is frequency of occurrence for an amplitude range).
Fig.5.2 Typical plots of original EEG (a), EOG (b), contaminated EEG (c), contaminated
EOG (d), recovered EEG waveforms using JADE (e), extended ICA (f), EOG subtraction (g)
and PCA (h). The vertical axis is amplitude in juV2and horizontal axis is time in seconds.
Fig.5.3 Plots of standard deviation ratio (STDR) (a-d), correlation coefficient (e-h) and
Euclidean distance (i-1) parameters for JADE, extended-ICA, EOG subtraction and PCA algorithms. The horizontal axis is trial number for all plots.
Fig.5.4 Plots to demonstrate the effect of noise on the performances of extended-ICA (-■-),
JADE (-♦-), PCA ( - X - ) and EOG subtraction (-A -). The horizontal axis is signal to noise
ratio (SNR).
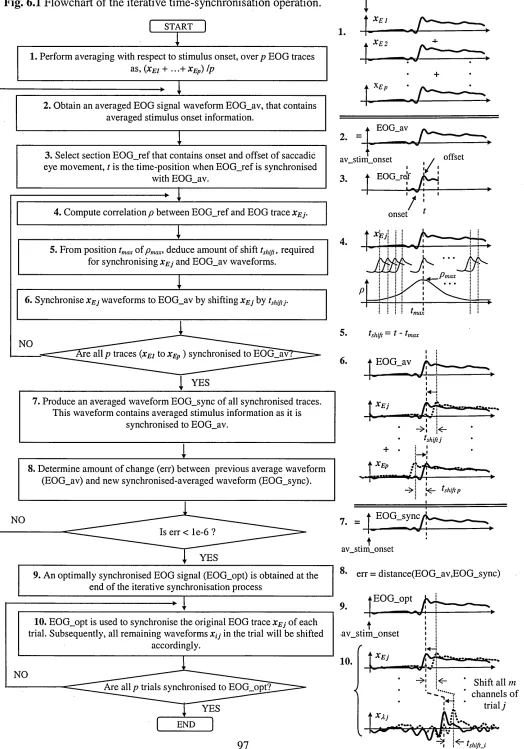
Fig.6.1 Flowchart of the iterative time-synchronisation operation.
Fig.6.2 Scaled eye-movement EOG waveform and its first derivative.
Fig.6.3 Spatial averaging operation: (a) the Electrical Geodesics sensor network of 64
electrodes and (b) the International 10-20 system of electrode placement with the alpha
numeric designation of electrodes placement on the scalp for the EEG.
Fig.6.4 Averaged EEG waveform with lambda wave features: (a) not-abutted, (b) abutted for
3 trials. Vertical arrow indicates.the average stimulus onset.
Fig.6.5 Averaged eye-movement EOG waveform: (a) not-abutted, (b) abutted for 3 trials.
Vertical arrow indicates the average stimulus onset.
Fig.6.7 (a) The averaged eye-movement EOG waveform before synchronisation, (b) the saccade offsets distribution, (c) the averaged eye-movement EOG waveform after
synchronisation, (d) the saccade offsets distribution.
Fig.6.8 The lambda wave (top) and eye-movement EOG waveform (bottom) obtained by (a)
averaging without time-synchronisation, (b) averaging with time-synchronisation. The
vertical arrow indicates the average stimulus onset.
Fig.6.9 The 22 averaged waveforms displayed (a) in a clinical format' and (b) with their
amplitude range and time-course information. In (b), the vertical axis is in microvolts and the
horizontal axis is in second.
Fig.6.10 (a) Correlation coefficient values and (b) Euclidean distance
values, between the original and recovered EEG waveforms.
Fig.6.11 (a) Mean correlation coefficient values and (b) mean Euclidean distance values,
(across the four mixing ratios), between the original and recovered EOG waveforms.
Fig.6.12 The extracted EOGl waveform.
Fig.6.13 The extracted EOGr waveform.
Fig.6.14 The pre-saccadic potential extracted in the frontal area.
Fig.6.15 The lambda wave component.
Fig.6.16 The pre-saccadic potential extracted in the occipital area.
Fig.6.17 BS_ICA-extracted lambda waves (top row) and eye-movements (bottom row)
together with their respective scalp distributions for ((a), (b)) the not-abutted and ((c), (d)) the abutted approaches. The vertical arrow indicates the average stimulus onset.
Fig.7.1 A model of the lambda wave represented by three straight lines.
Fig.7.2 The model-based BS_ICA operation.
Fig.7.3 Two Lambda wave components extracted by BS_ICA (top and middle) with their respective scalp distributions (side) and the corresponding extracted EOG component
(bottom) for (a) BS_ICA without model, (b) model-based BS_ICA. The vertical arrow
indicates the average stimulus onset.
Fig.7.4 (a) The training results when no SF was incorporated into the model cost function.
(b)-(h) The effect of gradually increasing the contribution of the SF to the model cost
function by increasing the value of constant ratio C1IC2.
Fig.7.5 Effect of the feedback-error on the dropping effect caused by overtraining, (a) and (c)
Training results for model without smoothing factor, (b) and (d) Same information when the
smoothing factor is incorporated into the model.
Fig.7.6 (a) The training results for a value of C; (C/=54) when the model does not work, (b)
The same training results for the same value of C; (C/=54) when the error-feedback was
incorporated into the model cost function.
Fig.8.1 (a) The BS_ICA-extracted lambda wave, (b) The corresponding EOG component.
The vertical arrow indicates the averaged stimulus.
Fig.8.2 Subject 1: Typical NLPCA extracted lambda waves with their scalp distributions (top
three rows) and the corresponding extracted EOG waveforms with their scalp distributions (bottom row).
Fig.8.3 Subject 2: The NLPCA extracted lambda waves with their scalp distributions (top
three rows) and the corresponding extracted EOG waveforms with their scalp distributions (bottom row).
Fig.8.4 Subject 3: The NLPCA extracted lambda waves with their scalp distributions (top
Fig.8.5 Subject 4: The NLPCA extracted lambda waves with their scalp distributions (top three rows) and the corresponding extracted EOG waveforms with their scalp distributions (bottom row).
Fig.9.1 (a) Binary clustering membership functions and (b) Fuzzy logic clustering
membership functions.
Fig.9.2 Operations involved for fuzzy C-means clustering.
Fig.9.3 Plot of the features of BS_ICA-extracted single-trial components identified as either
the lambda waves (o) or non-lambda waves (+). (a) and (b) represent the gradients (mi, m2
and m3) features, (c) and (d) the scalp topography feature (S).
Fig.10.1 Results of the single-trial BS_ICA-extracted lambda waves classification for the
List of Tables
Table 2.1 A review on the work reported on signal source separation (SSS) since 1986. Part
A and B described general purpose methods, Part C deals the non-linear mixing, Part D
deals with the non-stationary condition, Part E deals with unequal number of mixtures and
sources.
Table 5.1 A review of reported work on occular artefact removal over the past 2 0 years.
Table 5.2 Means and variances for the three parameters over 32 trials.
Table 5.3 Tukey’s test (at level of significance 0.05) for pair-wise differences between
algorithms.
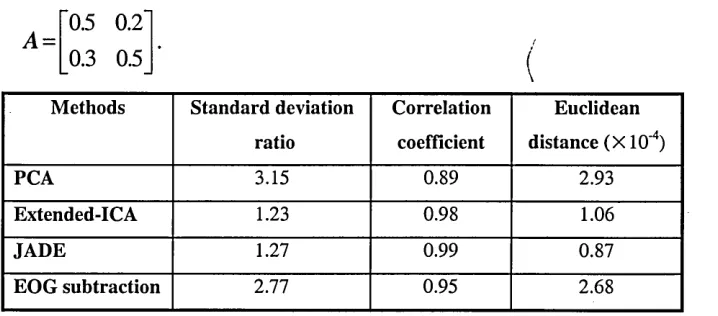
Table 5.4 Performance evaluation results when the mixing matrix A = 0.5 0.2
0.3 0.5
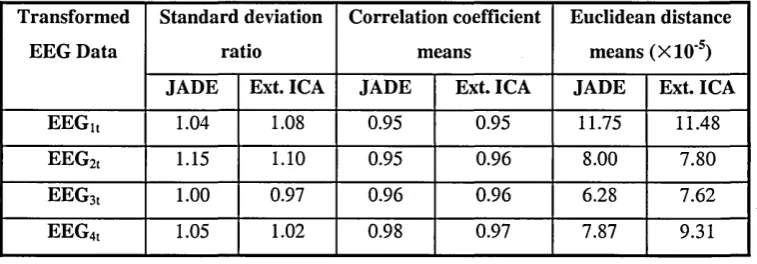
Table 5.5 Results obtained when the algorithms were applied to four transformed EEG
sources.
Table 6.1 The mixing coefficients used to generate the EEG mixtures
Table 6.2 Mean and standard deviation (std) values (across the four mixing ratios) for p and
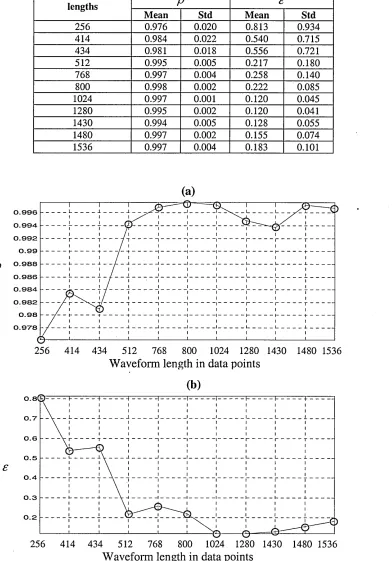
£ (in /xV) for different lengths of waveforms.
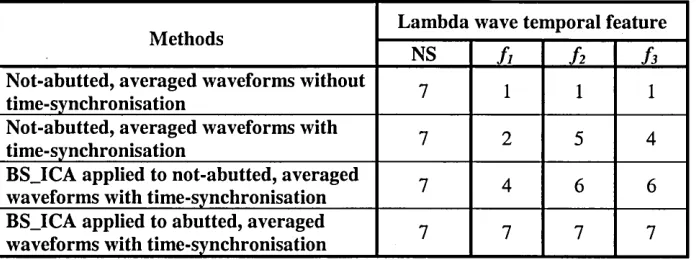
Table 6.3 Summary of the analysis results for the temporal features of the lambda wave
when assessing four methods to recover the lambda wave component.
Table 6.4 Summary of the analysis results for the scalp distribution and amplitude range
features when assessing four methods to recover the lambda wave component (std = standard deviation).
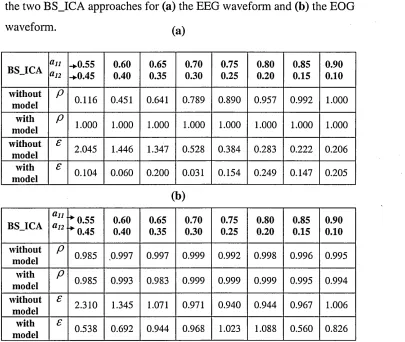
Table 7.2 Correlation coefficient (p ) and Euclidean distance (£ ) values for the two
BS_ICA approaches for (a) the EEG waveform and (b) the EOG waveform.
Table 7.3 Mean and standard deviation (Std) values of p and e (in /xV) for the data shown
in Table 2, for (a) EEG and (b) the EOG waveforms.
Table 7.4 Correlation coefficients (p ) and Euclidean distance (£ in /xV) for the approaches.
The total power of each signal within the mixtures were less than its power before mixing.
Table 7.5 Summary of the analysis results for the temporal features of the lambda wave
when assessing the two BS_ICA-based approaches to recover the lambda wave component.
Table 7.6 Summary of the analysis results for the scalp distribution and amplitude range
features when assessing the two ICA-based approaches to recover the lambda wave component (std = standard deviation).
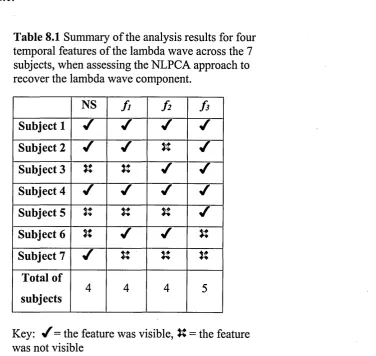
Table 8.1 Summary of the analysis results for four temporal features of the lambda wave
across the 7 subjects, when assessing the NLPCA approach to recover the lambda wave component.
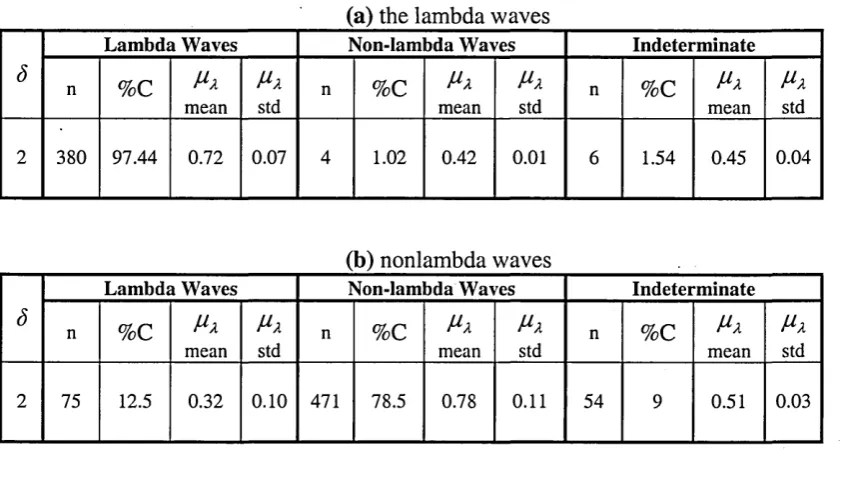
Table 9.1 Performance results of the fuzzy c-means clustering algorithm, with fuzzification
factor (S) = 2 and number of iteration (£) =1 0.
List of Publications
1. Vigon, L., Saatchi, R., Mayhew, J.E.W. and Fernandes, R.: ‘Quantitative evaluation of techniques
for ocular artifact filtering of EEG waveforms’, IEE Proceedings - Science, Measurement and
Technology, 2000,147 (5), pp.219-228.
2. Vigon, L., Saatchi, R., Mayhew, J.E.W., Taroyan, N.A., Frisby, J.P., Johnston, D. and Pascalis, O.: ‘Independent Component Analysis of Saccade Related Electroencephalogram Waveforms’,
Electronics letters, 2000, 36 (12), pp. 1006-1007.
3. Taroyan, N.A., Vigon, L., Saatchi, R., Mayhew, J.E.W. and Frisby, J.P.: Extracting the Lambda Wave Using Model-Based Independent Component Analysis', Symposium on Eye Movements and Vision in the Natural World, Amsterdam, September 27-29 2000, pp. 123-124.
4. Vigon, L., Saatchi, R., Mayhew, J.E.W., Taroyan, N.A., Frisby, J.P.: ‘Signal Source Separation of
Saccade-Related Evoked Potentials’, Clinical Neurophysiology Proceedings (formely
Electroencephalography and Clinical Neurophysiology), 112 (6) (June 2001 issue), The British
Society for Clinical Neurophysiology meeting, London, 20 October 2000, pp.l 117-1118.
5. Vigon, L., Saatchi, R.: ‘Adaptive non-linear principal component analysis for the extraction of a
saccade related EEG component called the lambda wave’, IEE Conference Proceedings on
Intelligent Sensor Processing, Birmingham, 14 February 2001, pp.19/1-19/6.
6. Vigon, L., Saatchi, R., Mayhew, J.E.W., Taroyan, N.A., Frisby, J.P.: ‘The Effect of Signal Length
on the Performance Of Independent Component Analysis For Extracting the Lambda Wave’,
Medical, Biological Engineering & Computing (MBEC), 2002, 40, pp.260-268.
7. Vigon, L., Saatchi, R., Mayhew, J.E.W., Taroyan, N.A., Frisby, J.P., Buckley, D.: ‘Model-Based
Independent Component Analysis for Extracting the Lambda Wave from the EEG’, IEE
Proceedings - Vision, Image and Signal Processing, 2001 (submitted).
8. R. Saatchi, L. Vigon, “Fuzzy Clustering Identification of ICA-Extracted Single-Trial Lambda
Contents
Acknowledgements... i Declaration... ii Abstract...iii Nomenclature... ... iv List of Figures...ix List of Tables... xiv List of Publications...xvi Contents...xvii
Chapter 1. Introduction 1
1.1 Chapter Summary... 1 1.2 Background of the study... 1 1.3 Aims and objectives of the study...5 1.4 Original contribution...8
1.5 Organisation of thesis...9
Chapter 2. Signal Source Separation Principles 12
2.1 Chapter summary... ..12 2.2 The objectives of signal source separation... 12 2.3 A review of the most relevant SSS techniques...14 2.4 A brief review of the principal component analysis (PCA)...21 2.5 A brief overview of the non-linear PCA (NLPCA) approach...22 2.6 Independent component analysis of Bell and Sejnowski (BS_ICA)... 24 2.6.1 Assumptions and general principle...24 2.6.2 The information theoretic principle...25 2.6.3 A neural network implementation of BS_ICA... 28 2.6.3.1 Principle of maximum entropy preservation (infomax)...29 2.6.3.2 The BS_ICA learning rule...29
2.6.4 Mathematical analysis and derivation of the BS_ICA learning rule ...31
2.6.5 The extended version of the BS_ICA learning rule...39 2.6.6 Mode of operation of BS_ICA... 40
2.7 ICA using the joint diagonalisation of Eigen matrices (JADE)... 41 2.7.1 Definition and assumptions...41 2.7.2 JADE principle and mathematical analysis... 42 2.7.2.1 Concept...42
2.12.2 Whitening... 43
2.1.23 Simplification of the SSS problem...45 2.7.2.4 Determining the unitary matrix through joint-diagonalisation... 45
2.1.2.5 Summary of the main steps of the JADE algorithm... 47 2.8 Conclusion... 48
Chapter 3. Description of Signals Included in the Study 49
3.1 Chapter summary ...49 3.2 Electroencephalogram (EEG)...50 3.3 Evoked potentials (EPs) and event-related potentials (ERPs)...50 3.3.1 EPs/ERPs characteristics... 50 3.3.2 ERP analysis...51 3.3.3 Clinical and other applications of ERPs... 52 3.4 Electrooculogram (EOG)... 52
3.4.1 EOG characteristics... 52
3.4.2 EOG filtering...54 3.5 Saccade-related evoked potentials ... 54
3.5.1 Types of saccade-related EPs... 55 3.5.2 Saccade-related EP/ERP model...56 3.6 Analysis of the data considered in this study... 57
3.7 Conclusion... 58
Chapter 4. Data Recording Experimental Methodology 59
4.1 Chapter summary...59 4.2 Data recording system set-up... 59 4.3 Electrical Geodesic Inc. (EGI) EEG recording system... 61 4.3.1 The Geodesic sensor net (GSN)...61 4.3.2 The Geodesic sensor net interface cable (GSNIC)... 63
4.3.3 The Net Amps amplifier unit... 63
4.3.5 The Net Station software...64 4.4 Data recording procedure... 65 4.4.1 First set of experimental data: EOG filtering from the EEG waveforms...65
4.4.2 Second set of experimental data: saccade-related EEG and EOG waveforms 6 6
4.5 Conclusion...6 8
Chapter 5. Analysis of Conventional and Signal Source Separation Approaches
for Removing Ocular Artefact from the EEG 70
5.1 Chapter summary...70
5.2 Introduction... 70
5.3 A brief overview of the EOG subtraction method... 77 5.4 Experimental procedures... 78 5.4.1 Experimental methods... 78 5.4.2 Source signals and mixtures generation... 79 5.4.3 Procedures to enable JADE and Extended-ICA deal with the problems of
amplitude scaling and channel permutation...82 5.4.4 Parameters for evaluating the OA removal methods... 83 5.4.5 Statistical tests for determining the significance of differences...84 5.5 Results and discussion...84 5.5.1 Single EEG and EOG data set analysis...85
5.5.2 Analysis to determine the effect of mixing matrix... 89
5.5.3 Effect of additive Gaussian noise...90 5.5.4 Multiple EEG channels analysis... 91 5.6 Key observations of this Part of the the study...91 5.7 Conclusion ...93
Chapter 6. The Effect of Signal Length on the Performance of Independent
Component Analysis For Extracting the Lambda Wave 94
6.1 Chapter summary... 94
6.2 Introduction... 94 6.3 Experimental Method...95
6.3.1 Pre-processing procedures... 95
6.3.2 Iterative Time-Synchronisation Operation and its Evaluation...95 6.3.3 Averaging process... 96
6.3.3.1 Spatial Averaging... 99 6.3.3.2 Temporal Averaging... 100 6.3.4 Whitening process and Application of BS_ICA... 100 6.3.5 Backprojection of the separated components ... 101 6.3.6 Analysis procedure...101 6.3.7 Summary diagram for the data processing and analysis procedures...104 6.4 Results and discussion...105 6.4.1 Iterative time-synchronised averaging... 105 6.4.2 BS_ICA applied to artificial mixtures... •...107 6.4.3 BS_ICA applied to 22 spatially and temporally averaged waveforms... 110 6.4.3.1 BS_ICA extraction of three saccade-related EPs components... 110 6.4.3.2 The effect of signal length on the performance of BS_ICA for extracting the
lambda wave...113 6.5 Conclusion...117
Chapter 7. Model-Based Independent Component Analysis for Extracting the
Lambda Wave 119
7.1 Chapter summary... 119 7.2 Introduction...119 7.3 Experimental procedure...*...120 7.3.1 Outline of the procedure for extracting the lambda wave... 120 7.3.2 Design of the model-based BS_ICA for the lambda wave extraction...120
7.3.2.1 Development of a model for the lambda wave...121
13.2.2 Development of a suitable cost-function...123
13.23 Development of a model tracking algorithm...123 7.3.2.4 Integration of the model into the BS_ICA algorithm...123 7.4 Analysis procedure... 125
7.5 Results and discussion... 126
Chapter 8. An Analysis of Adaptive Non-linear PCA for EEG Signal Source
Senaration and the Extraction of the Lamhda Wave 137
8.1 Chapter summary... 137 8.2 Introduction...137
8.3 Experimental procedure... 138
8.3.1 Data analysis ... 139
8.3.2 Signal source separation using NLPCA... 139 8.4 Results and discussion...i...139 8.5 Conclusion...146
Chapter 9. Fuzzy Clustering Identification of BS_ICA-Extracted Single-Trial
Lambda Waves 147
9.1 Chapter summary... 147
9.2 Introduction... 147
9.3 Fuzzy C-Means (FCM) Clustering Pattern Recognition Method... 148 9.4 Experimental method...150 9.4.1 Operations for Extracting the Single-Trial Components from EEG Mixtures... 150 9.4.2 Inspection of BS_ICA-Extracted Components...151 9.4.3 Lambda Wave Representation by Feature Set...151 9.4.4 Classification of the BS_ICA-Extracted Components...152 9.5 Results and Discussion...153 9.6 Conclusion...156
Chapter 10. Summary of overall results, Conclusions and Future Works 157
10.1 Chapter summary... 157 10.2 Summary of the overall results... 157 10.3 Thesis conclusion... 164 10.4 Suggestions for future work...167 10.4.1 Non-linear IC A ... 167 10.4.2 A Bayesian-based model approach to IC A ... 168 10.4.3 Final remarks...168
References... 170
Chapter 1.
Introduction
1.1 Chapter Summary
In this chapter the background of the study is provided. The aims and objectives of the research are stated and an outline of the thesis is included.
1.2 Background of the Study
Electroencephalogram (EEG) is a record of the electrical activity of the brain. It contains valuable information about the brain functions and its abnormalities. Evoked potentials (EPs) are voltage deviations in the EEG which are time-locked to the onset of stimuli. They contain information about the neuronal mechanisms involved in sensory functions.
They are caused by external stimuli or cognitive processes triggered by external events. EPs have found numerous applications in clinical neurophysiology and psychiatry. This is because their recording is non-invasive and accurate, and they are consistently shown to be an indicator of brain functions and its abnormalities. For example, visual EPs have proved valuable in improving the understanding of dyslexia and were used as an objective method for early diagnosis of dyslexia [1.1] [1.2].
This study was based on a saccade-related visual EP called the lambda wave. Saccades are rapid changes in the orientation of the eyes for realigning the visual axes on objects of interest. Dysfunction in this system may affect various visual functions such as depth perception and reading [1.3]. The lambda wave is believed to be related to visual information processing triggered by the relative movement of features of the visual field across the retina [1.4]. The lambda wave has a number of sub-components. These are generated by the brain when a subject visually follows a target stimulus (such as a red square) appearing at different locations on a black and white checkerboard background. These sub-components are time-locked to the saccade onset (i.e. initiation of the eye- movement) and its offset (i.e. termination of the eye-movement) [1.5]. One of these sub
components has a pronounced positive peak which appears within a 2 0 0 ms time window
after the saccade offset [1.5]. A typical lambda wave together with its saccadic eye- movement EOG waveform are shown in Fig. 1.1.
Main lambda wave peak
An eye-movement waveform
<o
■a3
An EEG waveform with the lambda wave features
- 2 0
-0 . 2 0 . 2 0.4 0 . 6
Time, sec. Stimulus Saccade
onset onset
F ig .1 .1 A typical lambda wave together with its saccadic EOG waveform.
It is reported that the lambda wave originates in the parieto-occipital area (back of the head) of the cerebral cortex [1.6]. The study of the saccade-related EPs provides valuable information about how the brain deals with vision when eye-movements are performed [1.7].
Saccade-related EEG waveforms recorded from electrodes placed on the scalp contain a mixture of signals. These are:
i) Saccade-related EP components (for example the lambda wave).
ii) Non-saccade-related EEG components, i.e. the background EEG and stimulus time- locked EP components that are not related to the saccade.
iii) The contaminating electrophysiological signals such as the electrooculogram (EOG). EOG is generated by the eyes when eye-movements or blinks are performed. Other contaminating electrophysiological signals include for example muscle activity (electromyogram, EMG) and the heart beat (electrocardiogram, ECG).
iv) Non-electrophysiological (external) contaminating signals, for example the noise generated by the recording system and the 50 hertz mains interference.
recorded and then averaged. Averaging is a valuable pre-processing tool prior to signal source separation as it can improve the signal-to-noise ratio. However, the EP recovered using this method remains a mixture of signal components from a number of different sources.
Therefore, signal source separation techniques that allow the recorded EEG waveforms to be unmixed are valuable for extracting and studying specific EP components such as the lambda wave. A detailed review of signal source separation methods is provided in Chapter 2. Techniques that can be used for this puipose are called independent component analysis (ICA) techniques. The goal of ICA techniques is to recover the independent source signals given only the recorded mixtures. ICA techniques are reviewed in reference [1.8]. Bell and Sejnowski [1.9] proposed a method for implementing ICA that extracts independent components by maximising the joint entropy (i.e. minimising the mutual information) of the separated components. Cardoso [1.10] proposed an approach for implementing ICA which exploits the fourth-order cumulant. The operation of the ICA algorithm of Bell and Sejnowski [1.9] (hereafter refereed to as BS_ICA) is based on a number of assumptions. These are: (i) the mixing process is linear, (ii) not more than one source signal has a Gaussian distribution, (iii) the source signals are stationary and statistically independent. When BS_ICA is applied to the EEG waveforms, the source signals are considered to be concurrent electromagnetic activities that are temporally independent of each other and that are generated by spatially fixed sources. These signals are mixed as they propagate from their sources to the electrode locations on the scalp.
ERPs are susceptible to contaminations from various electrophysiological signals. The most serious of these (which are picked up by the electrodes on the scalp) is the electrooculogram (EOG). The human eye contains an electric dipole with a positive cornea and negative retina. As a result of eye movements or blinks, the electric dipole changes causing the voltage potential known as EOG. A fraction of the EOG spreads across the scalp and it is superimposed on the EEG, causing it serious contamination. The current method of OA removal is based on correlation-based techniques. A detailed review of some of the most relevant work done in the area of OA removal is provided in Chapter 5. In this study, the performances of two ICA-based approaches, namely the ICA algorithm of Bell and Sejnowski (BS_ICA) [1.9] and the joint diagonalisation of eigen matrices (hereafter refereed
to as JADE) algorithm of Cardoso [1.10], were quantitatively assessed and compared to that of two correlation-based methods for removing EOG based contamination from the EEG.
The features of EPs contained in successive EEG recordings can vary slightly in time, due to cognitive and electrophysiological effects. A novel iterative synchronised averaging method for EPs was devised. The method provided the ability to optimally synchronise the trials with respect to an event of interest prior to averaging, in order to preserve the signals components that are time-locked to the event.
For the EEG to conform to the stationarity requirement of BS_ICA, the statistical properties of its signal components should be time invariant. However, EEG signal components (such as EPs) are short-duration transient signals and may not fully conform to the stationarity assumption of BS_ICA. In this study a method was devised to increase the effective length of the EEG traces containing the EPs so as to increase their stationarity pre-requisite. The performance of BS_ICA for extracting the lambda wave was assessed for different lengths of EEG waveforms.
BS_ICA was investigated and applied to the recorded saccade-related waveforms. This enabled the extraction of a number of EP components related to the performance and generation of saccadic eye movements, and their scalp topographies to be obtained. Theses were: the frontal and occipital pre-saccadic potentials, and the lambda wave. This initial study also highlighted some limitations of BS_ICA for analysing saccade-related EEG waveforms.
Nonlinear principal component analysis (NLPCA) is a recursive least-square based signal separation algorithm [1.11]. In this study, NLPCA technique was applied to saccade-related signals and its performance was compared to that of BS_ICA. The results obtained with NLPCA provided further insight into the functioning of the brain during the performance of a saccadic eye movement.
The application of BS_ICA to n recorded EEG waveforms resulted in n independent signal
components. These components were originally visually inspected to identify a specific EP. The task of visual identification of specific EPs (specially when dealing with single-trials) can be time consuming and requires an expert familiar with the characteristic features of the desired component. A fuzzy c-means method that automated the process of identifying the single-trial lambda waves extracted by BS_ICA from the recorded EEG waveforms was implemented and its effectiveness was investigated.
1.3 Aims and Objectives of the Study
The aim of the study was to develop and apply novel signal processing techniques to improve the estimation, analysis and interpretation of EPs. The objectives are listed below and introduced as highlighted in the original proposal.
1. Recording of saccade-related electroencephalogram (EEG) signal waveforms
In this study, saccade-related EEG waveforms will be recorded from 7 subjects using an Electrical Geodesics Inc. (EGI) EEG recording machine. A variety of skills will be learnt and mastered in order to conduct a saccade-related experiment successfully. These will include for example practical skills related to utilising the EEG recording equipments (such as applying a network of electrodes on a subject’s scalp) and softwares (for example to initialise parameters of the EEG recording machine, display the data on the screen and store the recorded data to the hard-drive for later processing and analysis). Prior to recording the data, an appropriate saccade-related experiment will be designed with the collaboration of clinicians to enable brain activity related to eye- movements to be monitored and studied.
2. Investigation of the effectiveness of independent component analysis (ICA) techniques for performing electrooculogram (EOG) filtering of the EEG -Comparison of ICA-based methods with correlation-based methods for EEG ocular artefact (OA) removal
In this study, the performances of two main signal source separation techniques, namely the independent component analysis algorithm of Bell and Sejnowski (BS_ICA) [1.9] and the joint approximation diagonalisation of eigen-matrices (JADE) algorithm of Cardoso [1.10] will be quantitatively assessed and compared to that of existing correlation-based methods for removing EOG based contamination from the EEG. The correlation-based methods to be investigated in the study will be principal component analysis (PCA) [1.12] and the EOG subtraction method [1.13]. The effect of additive noise on the performance of the four approaches will also be investigated.
3. Investigation of BS_ICA for extracting saccade-related EEG components
The Independent component analysis of Bell and Sejnowski (BS_ICA) will be applied to the recorded saccade-related waveforms so as to enable the extraction of a number of EP components related to the performance and generation of saccadic eye movements, and their scalp topographies will be obtained. The components of interest are: the frontal and occipital pre-saccadic potentials, and the lambda wave.
4. Devise techniques to improve the performance of BS_ICA for extracting the lambda wave - Three approaches.
Novel procedures will be developed in order to improve the performances of BS_ICA to extract an EP signal of interest called the lambda-wave. Three approaches will be investigated.
evaluated and assessed for preserving the features of EP components in the EEG, prior to input to the BS_ICA algorithm.
The second approach will consist of devising a method to increase the effective length of the EEG waveforms processed by BS_ICA in order to enhance their stationarity property and thus to make them more suitable for BS_ICA signal source separation. The performance of a process which involves abutting EEG waveforms prior to BS_ICA will be quantitatively assessed when extracting the lambda wave.
The third approach will consist of developing a novel model-based BS_ICA algorithm to extract the lambda wave from the EEG waveforms. This will include developing a template-model that represents the temporal characteristics of a saccade-related EP called the lambda wave and incorporate it into the BS_ICA algorithm. The conventional BS_ICA techniques do not allow prior knowledge of the source signals to be incorporated as part of the algorithm’s signal separation operation. Prior information, when available can aid the extraction of a component of interest. Therefore it may prove valuable to incorporate such prior information into the algorithm. The signal source separation ability of the developed model-based BS_ICA will be investigated and its performance for extracting the lambda wave will be compared to that of a conventional (model-less) BS_ICA technique.
5. Investigate nonlinear principal component analysis (NLPCA) peformance for extracting the lambda wave
Nonlinear principal component analysis (NLPCA) is a recursive least-square based signal separation algorithm signal separation technique. Signal source separation algorithms such as the ICA algorithm of Bell and Sejnowski maximises entropy in order to extract signal components. However NLPCA uses a recursive least square algorithm for tracking signal subspaces in the data. In this study, NLPCA technique will be applied to saccade-related signals and its performance will be compared to that of ICA algorithm of Bell and Sejnowski [1.9].
6. Devise a method for automating the identification of BS_ICA-extracted lambda waves
A fuzzy logic based method will be implemented to automate the process of identifying the single-trial lambda waves extracted by BS_ICA from the recorded EEG waveforms.
The application of BS_ICA to n recorded EEG waveforms resulted in n independent
signal components. These components originally were visually inspected to identify a specific EP such as the lambda wave. The task of visual identification of specific EPs (specially when dealing with single-trials) can be time consuming and requires an expert familiar with the characteristic features of the desired component. The performance of a fuzzy c-means clustering pattern recognition approach to perform the identification of the single-trial BS_ICA-extracted lambda waves will be assessed.
1.4 Original Contribution
Novel ICA-based signal processing procedures were developed for the analysis and
quantification of techniques employed for the extraction of saccade-related EP components from the recorded EEG waveforms. The original contributions of the study are as follows:
- Development of a procedure that enabled the quantitative assessement of four methods employed to perform OA removal of the EEG. (chapter 5)
- Development of an iterative synchronisation procedure that enabled the features of the
saccade-related component signals to be preserved during averaging, (chapter 6)
- Development of an abutted-trial averaging procedure that enabled the stationary
properties of the EEG waveforms to be enhanced prior to BS_ICA application, (chapter
6)
- Using BS_ICA, the characteristics of the temporal and spatial relationships of three saccade-related EP components were analysed. The EP components were: the frontal
-. Development of a novel model-based BS_ICA approach that enabled a priori knowledge of the EP component of interest called the lambda wave to be incorporated into the BS_ICA algorithm for improving its performance for extracting the lambda wave, (chapter 7)
- An analysis of saccade-related EEG waveforms using nonlinear PCA technique that provided a new insight into the scalp distribution of the brain mechanisms involved in
the generation and performance of saccades. (chapter 8)
- Implementation of a Fuzzy logic based procedure that enabled the automation of the identification of BS_ICA-extracted single-trial lambda waves, (chapter 9)
1.5 Organisation of Thesis
An outline of the organisation of the thesis is provided in this section.
Chapter 1: The background of the study is provided. The aims and objectives of the research are identified and an outline of the thesis is given.
Chapter 2: The theoretical background of the signal processing techniques used in the study is provided. The discussion concentrates mainly on two signal source separation algorithms, namely the ICA algorithm of Bell and Sejnowski [1.9] and the JADE algorithm of Cardoso [1.10]. The methods of PCA [1.12] and NLPCA [1.11] are also explained in this chapter.
Chapter 3: The signals used in the study are described. The discussion concentrates on saccade-related EPs.
Chapter 4: The experimental procedures and methodologies used to record the signal waveforms are described. This includes a description of the data recording system/set-up and the design and implementation of the experiments.
Chapter 5: An analysis of signal source separation approaches for removing ocular artefact from the EEG is provided. The methods were the ICA algorithm of Bell and Sejnowski [1.9], the JADE algorithm of Cardoso [1.10], the PCA data decomposition [1.12] method
and the EOG subtraction method [1.13]. Procedures to quantify the algorithms performances are developed and explained. The results obtained when using each method to remove OA from the EEG are provided.
Chapter 6: Procedures to improve the performances of BS_ICA to extract an EP signal of
interest called the lambda-wave are described. Three approaches are provided.
The first approach is a iterative synchronisation procedure devised to optimally time synchronise the waveforms with respect to an event of interest prior to averaging, in order to preserve the signals components that are time-locked to the event. A detailed description of the algorithm is provided and the results of the effects of the iterative synchronisation process on the averaged waveforms are provided.
The second approach is a method devised to increase the effective length of the EEG waveforms processed by BS_ICA. The performance of BS_ICA for extracting the lambda wave is assessed for different lengths of EEG waveforms. The results of applying BS_ICA to the abutted waveforms and to the not-abutted waveforms are provided. Results for both simulated waveforms and saccade-related waveforms are shown. Plots of the BS_ICA- extracted lamda wave components waveforms produced by the two approaches (BS_ICA applied to abutted and not-abutted waveforms) are provided and the results are compared.
Chapter 7: The design of a model-based BS_ICA algorithm for improving the extraction of a saccade-related ERP component called the lambda wave is provided. The procedures used to develop (i) a model for the lambda wave, (ii) a suitable cost-function for incorporation into the BS_ICA algorithm and (iii) a model tracking algorithm are decribed and explained. The results of applying the model-based BS_ICA algorithm to both simulated waveforms and saccade-related waveforms are shown. The results of comparing the performances of the model-based BS_ICA algorithm with that of conventional (model-less) BS_ICA are discussed. Plots of the BS_ICA-extracted lamda wave components produced by the two approaches (with and without model) are provided and the results are compared.
Chapter 8: The performance of the adaptive NLPCA method for the EEG signal source
using the ICA algorithm of Bell and Sejnowski [1.9]. Plots of the waveforms produced by the two approaches are provided and the results are compared.
Chapter 9: A method that automates the process of identifying the single-trial lambda waves extracted by BS_ICA from the recorded saccade-related EEG waveforms is implemented. The performance of a fuzzy c-means clustering based pattern recognition approach is investigated for this purpose and the results obtained are provided.
Chapter 10: A summary of the overall results, a conclusion to the study and future works are provided.
Chapter 2.
Signal Source Separation (SSS) Principles
2.1 Chapter Summary
An overview of the signal processing techniques used in the study is included in this chapter. A general introduction to signal source separation (SSS) principles is initially provided. The most relevant SSS studies over the past fifteen years are reviewed. The discussion concentrates mainly on the independent component analysis (ICA) of Bell and Sejnowski [1.9] and the joint approximation diagonalisation of eigen-matrices (JADE) of Cardoso [1.10]. The related methods of principal component analysis (PCA) [1.12] and non-linear principal component analysis (NLPCA) [1.11] are also described.
2.2 The Objectives of Signal Source Separation
Consider for example a situation where there are a number of signals emitted by some physical objects or sources. These sources could be, for instance, different brain areas emitting electric signals, people speaking in the same room, emitting speech signals, or mobile phones emitting their radio waves. Further, assume that there are several sensors or receivers placed at different locations so that each one records a mixture of the original emitted signals with slightly different weights, depending on the distance between the sources and the sensors. When several signals are transmitted down the same medium at the same time, it is often difficult to identify them at the receiving-end (sensor) as they are very likely to have been mixed together during transmission. One must therefore attempt to separate the different signals in the recorded mixtures in order to retrieve the original signals.
observations that are mixtures of the original signals. The technique is said to be ‘blind’ because it assumes no a priori knowledge of:
1- the characteristics of the signals that have been mixed,
2- the number of original sources in the mixtures,
3- the physical properties of the transmitting medium,
4- the mixing relation between original sources and observations.
The principle of SSS is illustrated in Fig.2.1.
Original signals Recorded mixtures
Xr
Mixing Matr ix
Separating IV atrix
(o r / ;
Estimated signals
U,
U2
Fig.2.1 The signal source separation (SSS) principle.
The technique assumes that n sources transmit certain signals s,-, which, after transmission
through an arbitrary medium, are measured by n sensors Note that for simplicity, the
case where the number of sensors is set equal to the number of sources will be used all throughout the thesis. The measured signals will be related to the transmitted signals by some unknown function /, referred to as the mixing relation. With added measurement noise iii, this becomes,
*/=/(
sI, . . . , s n) + ni (2.1)The aim is to find a separating matrix W - A' 1 and thus to estimate the original signals ut as shown in Fig.2.1 by the operation:
Ui=f'1( x l f . . . , x n) (2.2)
The estimated signals w/ are the underlying components that describe the essential structure of the data (recorded mixtures). These components correspond to some physical causes
that were involved in the processes that generated the mixtures. In most cases, / is considered a linear function because the interpretation of the representation is simpler, and so is its computation. Thus every component u; is expressed as a linear combination of the observed variables:
n
«.= Y . wi] x i (2-3)
i , j = l
where W y are the coefficients of the separating matrix W that define the representation. The
problem can then be rephrased as the problem of determining the coefficients w y . Using
linear algebra, the linear transformation in (2.3) can be expressed as a matrix multiplication
/ \U2 c v* 1 \
• = W •
• •
<.Un;
It can be safely assumed that the mixing coefficients are different enough to make the matrix that they form (A) invertible. Thus there exist a matrix W with coefficients w y so
that the h,- can be separated. W will be determined by the statistical properties of the transformed components w,-.
2.3 A review of the most relevant SSS techniques
Ta bl e 2.1 A rev iew on the wo rk re po rte d on sig na l so ur ce se pa ra tio n (S SS ) sin ce 19 86 . Pa rt A and B de sc rib ed ge ne ra l pu rp os e m et ho ds , Pa rt C de als the no n-lin ea r m ix in g, Pa rt D de als wi th the no n-sta tio na ry con di tion , Pa rt E de als wi th un eq ua l nu m be r of m ix tu re s and sour ce
s. - ’S
« o
*5xO c/a e0
c/a TO
« v
c/a ^
= 1 TO £ < * oi
<N JL.
CN
T3 3 3 XZ
1/3 ■£! 3 E
-9 2
2 § 3 3 3 X )
3 C/3
s | O 2 T33
3 CX
X) cx £ 2
eo £
.s .
3 CO E 3
3 o 3 3 O co co ° ti XZ 3
> 3
^ T3 3 c fa CD
2 p* B *g
TOTO£
§
a &
c
3
3 .3 T3
P 33 2 3 >
3 c/a
CL
.1 ^CO ^ 3 9 3 CX 3 CO -oG X> cm O E JO
3 o
M CX o ,3 o MM 0 1 y *c
8 cn § ci
CN
m 3 u
‘C g i—o .E cn 60 CO
8 2 CO £ 3 x. 5 CX U 3p- 2 3 CO *d 1 2 “
3 O 3
rt 3 2
*3 cd o
^ ~ >J * 5
g .3 O M O CX
.£ § 2 M 3 q CX > .p B 2 33 cd "3
X )
T3 <D ,P
(D x2
E B .3 3
00 3
3. co
2 P
o 0
P-i c/a
T3 0
TO TO TO ^ .22 g E« 3
”3 ^3 m
3 3 cd .3
3 P
g .2 ° p CX 3 £ o o o p
S *p
O M T3 3 3 3 P 3 CX c O cm
-3 O .£ 3 c*-i 2 2O..S3
3 g o P 3
o<o -33
3 v- O O E o CX
p B
13 3 o
S' 2 cn o
0 ^ 1 s
o o "3 0 co 3 31
P 52 cd P
E I p 5
u £ CN
O
o
p
<N
. 3
CN 3
3 ^
■3 £c/a 2 % o. 3 ^ _ CO
rt 5 3 £ .22 n-l
•r T3
> 3 M 3
cS .22>, ^
00 3? 3 cd cd S *c/a eg £
C3 TO
CO ’O
a d o
^ CM c2 ° ^ M
O 3 3 co O “ TO£
TO Vh
G cP
S> c J I
” CJ 3 3
3 — P ^ *3 PO cd O 3 X ? 33 -r .x o
O Cm
3 O
-3 M 3 3 3 3
^ CX 2 o 5 CX < 3
>,.52
X> ^-1 *3 21 o .
3 0 X <
3 (J S3 es
^ .«*
O ’co "3 >,
O 3 O P E-1 CX
3 to
> "3 CO S 3 co O' O p *2 -3 o
3 <U "3
3 3 O O 3 •rj 3
3 M 'o 2
fc CX
O 3 3 -rt 3 ~ (O
’B ^ O g cd
CQ CX 3 . 3 -a O . S g
S § -^
0 1 3 0 33 3
1—1 m
c-°0 co ^ a p .s - g o
2 § a O ■5 E -E
3 0 3 3 3 >
"3O c/a TO a to TO — -f o 8 6 (U 3 Q E
MM
O >, B 3 *o P 3 ^3
co 3 Pc E
o 2
M 3 CX cd 3 cm
S3 ° ^ £
^ 1- O 3
3 § - x)
p E
o 3
c/a TO E cx £ -s C ^ -5
c ° o T3 3 3 ^ CO Ct
3 a,
X ) X) co M P O 3 -3 1-1 3
g“l i f3 .3
(O _ 23 3 "3 3 8 3
t e O 3 co O 3 co 3/ e
g ‘x ^ B to O P co O cd 3 ^M — 3 3 CX O O 60
-rt 0
12 *p
.5 H 3
0 3
1 ^
Id g 3 ^ o CO P- 3 3 •
.s ^ >. O too co CD 3 2 2 M 3co O 60 P 3 »-i .3 aj "3 .3
O dd O 3
co 3 3 |
£ g
E eg
cm
c7 .3
x> £ p
’S x>
■Si I H -P 3 M D. T3
3 © *VJ
TO X3
TO 3 *g
TO ^ ^5 P 3 3 8 5 ’S
k-J COO O ”3 M CX
CO 31£
■M 3 . d 3 CO TO PQ
3 O g 3 M
P 3 M T3 3
T3 OCO 3CO
iU 3 O co‘m
33 3 co 3 3 CX 3 T3 M 3 3 cr 3 3 O M CX 0 M 3 «P cm 60 60 3
M • »— •- G
p ^ x : 3M
3
X)
CO
P 130 3 3 33
3 3 3 3 O
CJ CO 3 3cm O73
3
"3 3 *33 OCO
3
3 CO 3
M CO CX 3 .O
>, 3 cx2 O 3 3 3 3 P
3 3 m 0M ,33
-a M T3cm
c
3 3 CN 33 M>,
33 CO CO CO
3 3 3
M 3 60 3 3
cm
O 3"cdPM3
lh
CX _3 T3>> 3
2 1 .3
cmT3
c 33
'3
_pT33 O 3 3 3 £ M 23 ‘m
CX3G T3M X )3 OM
3 3
2 3 3#o
CX 3 O3
0 CO 3 .3•c "3
3 x :CO 3 CXEM 3>
3 3 cS
m)
.2 o
2 S .22 g
2 ° 3 cd 2 w
cx •
sr co B* 3 P o c/a u £ 3 H 3
cmO P 3r-1
E 2 1 3 3 3
s !_ •
« E 'c 3 x 2 M 3 O 3 E <2
"3 3
CD O 22 " 3 > 3 M CO 1) 3 CX -P
2 00 co u TO *TO
!-^ P
>, O 3 3 "3 3 3 T3 (D O 2 g
cx -x O 3 P 5 •r1 ^bd 3
Cl t_)
<N
d> JTO•4—>
TO <2 3 ^ -2 2 -a 3 3M 60 CX 3 CX
'P M T 3^
2 p
3 cd
• 3 ^
§ g
^ 2 p -60 P 3 Id '3 c-i co 3 3 CD
x : 3 8 3
3 CM CO o
3 co 3 *d > 5
•c &<D 3
•a o
>. (D
3 x:
3 •- 3 -a
■g §
8. a
3 3 l . s
' 3 2 3 % B
■73? 3 3
co . 2
3 3
§ l ^ I pq .£
3 13
E 5
3^ m
M . (D ^
CN XZ
I o bd P 3 o PQ 3
3 2
TO ’ M
3 P
3
*M ^ N3 co
O 32 >
s 3 g ■s 3
M
3 3 CX 3
O CX 32
co S' CO 3 S S3 5 CX M
”3 "g « 13 co B 3 jo 8 §
§ I
co 3
cm ^3 O "O
3 P O « 3 34 3 J-3 i & 3
CO P CD 3 2 * M 3
.O M cm gj c ° .22 "Vco 3 _>, O Id 3
P e
3 S co fc .2 c2 M 3 CD -P ^ P (D 3 E O
*~H M
*1 E 60 '2
3 E
3 3
p ?
3
M cx
I I*1 3
-J' M >^ 3 CD CX > 3 .M co
O 3 (D 3 P- M
3 3 01M 3 CX 3
.m 3 P -CO 3 3 ^ 60
p 2 o p
3 3
3 > 3 cd co .3 3 M ”3 3
2 "P 60 co 3 3 3 2
S §
m cj
3
CX co 3 3 "P r23 0 •9 X>
3 3 >P co
3 3 ^ CH O 8 ffi O
s S
3 ’3 »-i tS 3 ^ O *3 co M -O 3
3 co X 3 E g o CU M M M CO O CO
2 3
60 3
3 60 3 ‘E o 2 3
co m2
o .—, m co1—h
CN CN CN
T3 3 co O £ *p CX T3 co 3 3 CX £ 5
,— 13
CO >• 3
CN *0 >» cm O 3 O 3 1 1 3 1
>> o
-a o ’
3
3 p
T3 — 2 W
1 9
-pCj cm
3 O
2 3 &•&
3 T3 3 3 TOTO
COT3
3 3 T3
3 x
O
3 g
3 O
CO 3
3 3 [to c M O 3 *0
6 0 CXJP
3 O •TO
2 MO UTOn
M 3 (4-1
3 CO O
O 3 0 0 CO 3
O
T 3 0 00 0
CO W 0
3 Q TO
T3 •w 3 3 ^<h-5 O1+->
T3 X 3
-co rc O 2 3 «
T3 133 M
S3 .52 £ -p
3 3 3 O P &
E P
3 cd 3 _cO «J jE ■2 H
O rX *-• mM .M
3 ” CN
*« 13
T3 O 3 2
3 d3
e g > 8
§”§ Cd M T3 3
3 (J
< x>
.§ 2 to .2
’•TO 'ti TO 5 1 O) Vh
<u ^ 2 o ° £ M JX
3 •*-’
>p60 O 2 2 «2
CO p
m cd 2 *3 6 1 2
x 3
3 CJ
J 3 M CJ 3
2 2 * ? rX ^
\ n j-. TOh TO CN 2
1—1 3
2 -p
TO w *S TO
3 -2
2 3
3 co
O cd CO -P
’p P c-.2
3 3
o
CO
O T3M
3
co~ "P
B 3 ^
■S cx in
-r- CX —H
. . o «<N
g 60 > > >—1 3 *3 .P >, cm 3 P So E
g 3 O
E u n
TO
>•> <A. 2 TO +* > TO o £ 3
<-> E E p ^ B
o 2 o •p cm P 3 O _2 •52 c 3 . 1 . 1 1
x td 2
TO
E g .S
3
x z CO r/]3M r tx2 - CX 3 M « M 2 ‘co
B p A
5 3 .2 O m T3 -52 p
3 P CX m "3
M CO £ 2 3 p
O 5 3 3 .O 3 3 E
0 8 P- 9
0 >: a >. 3 -r E 52 3
•2 E p
P J2 3 3 2 p
G
3 60
w •S i
p 1 o ■ CX 3 CX CO
m 3 60 .3 3 O >P
CO E
3 -P 3 /3 C Xh
2 o 3 60
E Id
Ta bl e 2.1 Pa rt A (c on tin ue d)
73
.
" ’S *§O 73
| S « u M
CO . « '— 1
= 1 5 £
< CN
© u
co O C x
3 2
T3 O 3 3 0,3 3 x ’j)
& o >* o | £ £ l a
"O G
<u O 13 2 G X 73
0 3 j :Vi X o
D- in cl x £ OC/2 *+-• Wi • iS X CM G O G ^ c3 «
id P x c a 2 3 a E G 3 2
.2 § u > 2 *c
t
f+->
3 CD o CD X 3
X<D co O G X O OO a, *1
3 £L
<d
ID SS X 3
<D >