1830
High-b-value Diffusion-weighted MR Imaging of Adult
Brain: Image Contrast and Apparent Diffusion
Coefficient Map Features
Mark C. DeLano, Thomas G. Cooper, James E. Siebert, Michael J. Potchen, and Karthik Kuppusamy
BACKGROUND AND PURPOSE: Recent improvements in MR gradient technology allow significant increases in diffusion weighting without prohibitive signal-to-noise degradation. The purpose of our investigation was to establish normative references for the signal intensity char-acteristics and apparent diffusion coefficient values of the adult brain at high b values.
METHODS: Fifty adults underwent diffusion-weighted single-shot spin-echo echo-planar MR imaging. Isotropic diffusion-weighted images were obtained with b values of 0, 1000, 2000, 2500, 3000, and 3500 s/mm2. Qualitative assessments were made in multiple regions of interest in gray and white matter. Three apparent diffusion coefficient maps were generated for each of six patients with a 2-point technique at a b value of 0 and at b values of 1000, 2000, and 3000 s/mm2.
RESULTS: Increasing b values result in a progressive decrease in the gray to white matter signal intensity ratio. Isointensity between gray and white matter results at b values between 1000 and 2000 s/mm2. At b values greater than 2000, the gray-white pattern reverses relative to the usual b value of 1000. Apparent diffusion coefficient values were shown to decrease with increasing b values.
CONCLUSION: Attention to the reversal of gray-white contrast and the dependence of ap-parent diffusion coefficient on the b value are important in avoiding erroneous assignment of pathologic abnormalities to normal regions. This study provides the normative data for future diffusion investigations performed at high b values.
Recent improvements in MR gradient technology allow significant increases in diffusion sensitivity without prohibitive signal-to-noise degradation. Understanding the appearance of images obtained with higher b values is critical for the assessment of future clinical applications and investigations us-ing this technology. The ability of current diffu-sion-weighted imaging to detect and delineate re-stricted diffusion is well documented (1–5). The purpose of our investigation was to establish nor-mative standards for the signal intensity character-istics and trace apparent diffusion coefficient (ADC) values of the adult brain at varying high b values.
Received July 23, 1999; accepted after revision May 10, 2000. From the Michigan State University (M.C.D., T.G.C., J.E.S., M.J.P.), Department of Radiology, East Lansing, MI, and Gen-eral Electric Medical Systems (K.K.), Waukesha, WI.
Presented at the annual meeting of the American Society of Neuroradiology, San Diego, May 1999.
Address correspondence to Mark C. DeLano, MD, Depart-ment of Radiology, 184 Radiology Building, Michigan State University, East Lansing, MI 48824.
qAmerican Society of Neuroradiology
Increased gradient amplitudes permit higher b values and greater diffusion sensitivity. Gradient subsystems available on clinical imagers with echo-planar imaging have been limited to diffusion-weighted imaging with b values up to 1200 s/mm2. Newer clinical imagers can provide b values of 3500 s/mm2with echo times less than 100 ms. Iso-tropic diffusion-weighted images at the standard diffusion gradient strength of 1000 s/mm2 reveal relative hyperintensity of cortical gray matter com-pared with white matter. The signal characteristics of adult brain at higher b values have not been reported.
This investigation aimed to establish normative references for the signal intensity characteristics and trace ADC measurements of the adult brain with diffusion-weighted spin-echo echo-planar im-aging at varying high b-value diffusion sensitivi-ties. Furthermore, this study provides the normative data for future diffusion investigations performed at high b values.
Methods Participants
re-mum echo times were used to improve signal-to-noise ratios at higher b values in 43 of 50 participants. The number of acquisitions was adjusted for each b value: b51000 images, number of acquisitions5 one; b5 2000 images, number of acquisitions5two; b53000 images, number of acquisitions
5four.
Quantitative assessment of trace ADC measurements and of signal intensity variation with b-value modulation was con-ducted for six of the 50 participants using a fixed echo time and variable numbers of excitation. One of the 50 participants was studied with a fixed number of excitations to control for potential influence on the ADC measurement while the echo time was held constant. This participant also underwent im-aging with a fixed number of excitations and variable echo times of 96 and 72 ms at a b value of 1000 to assess the effect of echo time modulation on ADC measurement. The ADC data regarding this participant were not averaged with those of the other six because of the differing numbers of excitation.
The signal characteristics of diffusion-weighted imaging se-quences were qualitatively assessed for all 50 participants and are reported together because they were independent of the number of signal averages and echo time. In the spin-echo echo-planar diffusion-weighted imaging pulse sequence, the duration of diffusion bipolar gradient pulses and the duration between the two bipolar gradient pulses were held constant for different b values; hence, different b values were obtained by changing the gradient strength of the bipolar gradient pulses while keeping the diffusion time constant.
Data Analysis
Qualitative assessments were made of gray-white contrast and regions of interest (ROI) in the cortical gray matter, cen-trum semiovale, caudate nuclei, lentiform nuclei, thalami, in-ternal capsules, central pons, middle cerebellar peduncles, and dentate nuclei for isotropic diffusion-weighted images. Quan-titative ADC measurements were made from ADC images for the same ROI for six participants.
The diffusion-weighted imaging signal intensity ratio of pu-tamen to centrum semiovale white matter was calculated for b values of 1000, 2000, and 3000 s/mm2for the six participants
evaluated with a fixed echo time and variable numbers of ex-citation. Although the signal intensity of putamen is not always isointense to cortical gray matter, the putamen was chosen to avoid the issue of partial volume averaging of CSF in the mea-surement of gray matter signal intensity. The centrum semiov-ale is heterogeneous on diffusion-weighted imaging, particu-larly at higher b values. Therefore, measurements were independently obtained for two areas of white matter that were visually assessed to have the greatest and least signal intensity on the diffusion-weighted images. All measurements were ob-tained using a developmental software program on a separate workstation.
Results
Gray-White Contrast
The pattern of gray-white matter contrast ob-served on the diffusion-weighted imaging obtained with b values of 1000 s/mm2 is similar to the con-trast features of T2-weighted images, with gray matter hyperintense to white matter. Increasing b values result in progressively greater diffusion weighting while diminishing the appearance of T2 weighting. At b values greater than 2000, the gray-white pattern reverses relative to what is observed at the usual b value of 1000. The most pronounced reversal occurs at a b value of 3500 s/mm2(Fig 1). Isointensity between cortical gray and white matter accordingly results at b values between 1000 and 2000 s/mm2, although the precise value corre-sponding to isointensity was not determined.
ROI Assessment
FIG1. Isotropic diffusion-weighted images with varying b values.
A, Image obtained with a b value of 1000 and 72/1 (TE/excitations). There is hyperintensity of cortical gray matter, particularly in the insular and medial frontal regions.
B, Image obtained with a b value of 2000 and 84/2. Near isointensity of gray and white matter is seen with slight hyperintensity of posterior capsular white matter and pontine regions.
[image:3.612.47.276.371.500.2]C, Image obtained with a b value of 3500 and 96/4. Progressive hyperintensity of white matter is present with diminished gray matter signal intensity.
TABLE 1: Gray-white matter DWI signal intensity ratios and av-erage values for 6 subjects: fixed TE (96 ms) and variable number of excitations; putamen and centrum semiovale regions of interest were chosen as described in the text
Subject
b51000, NEX51 WM Bright
WM Dark
b52000, NEX52 WM Bright
WM Dark
b53000, NEX54 WM Bright
WM Dark 1
2 3 4 5 6
0.91 0.81 0.88 0.89 0.76 1
1.15 1.02 1.04 1.12 1 1.13
0.65 0.63 0.62 0.58 0.64 0.73
0.93 0.86 0.92 0.74 0.87 0.85
0.48 0.49 0.43 0.50 0.42 0.50
0.70 0.71 0.60 0.67 0.61 0.69 Average 0.88 1.08 0.64 0.86 0.47 0.66 Note.—WM bright: ratios obtained from white matter of greatest signal intensity; WM dark: ratios obtained from white matter of least signal intensity.
FIG2. Mean ADC values with SDs for ROI in six participants. Echo time was fixed at 96 ms for all acquisitions. The numbers of excitation were varied to improve signal-to-noise ratios at high-er b values: numbhigh-ers of excitation whigh-ere one, two, and four for b values of 1000, 2000, and 3000, respectively. ADC values di-minish with increasing b values. ADC SDs decrease with multiple numbers of excitaiton.
signal intensity ratio with increasing b values for ROI in the putamen and centrum semiovale white matter.
ADC Measurements
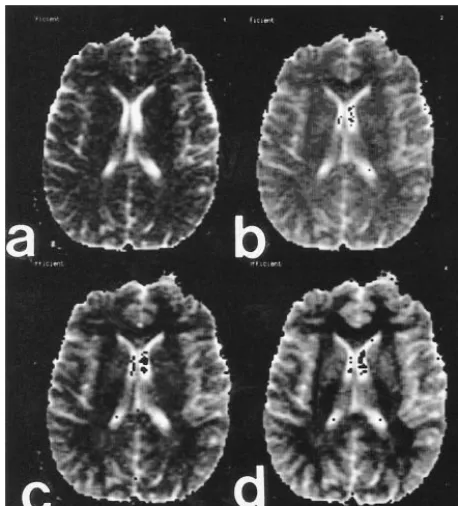
ADC values decreased with increasing diffusion weighting. Greater SDs were noted for ROI adja-cent to CSF spaces and for ADC maps derived from the single number of excitations with a b val-ue of 1000 (Fig 2 and Table 2). ADC measurements were shown to vary with diffusion sensitivity, in-dependent of number of excitations (Table 3). Echo time did not affect the mean ADC values measured at a fixed number of excitations (Table 4). Differ-entiation of gray and white matter on the ADC maps improved with increasing b values (Fig 3).
Discussion
Note.—R5right, L5left, CC5corpus callosum, PLIC 5posterior limb internal capsule, Post5posterior, Lat5lateral, Cereb Ped5 cerebellar peduncle. All values310E-6 mm2/s.
TABLE 3: Mean ADC and SD for single subject: fixed number of excitations (2) and TE (96 ms)
ROI Location
b51000, TE596 ADC SD
b52000, TE596 ADC SD
b53000, TE596 ADC SD R motor cortex
R centrum semiovale R medial frontal cortex CC genu
L caudate head L putamen L PLIC L post thalamus Lat ventricle L central pons L middle cereb ped L dentate nucleus
811 722 866 923 847 717 679 717 2670 737 612 684 220 66 67 323 336 92 52 112 403 86 58 68 771 543 724 778 749 648 605 677 1780 583 511 663 119 55 82 190 117 47 52 70 315 39 64 78 668 475 667 576 661 638 509 649 1280 535 455 555 147 35 71 102 62 66 57 65 105 74 44 50 Note.—R5right, L5left, CC5corpus callosum, PLIC 5posterior limb internal capsule, Post5posterior, Lat5lateral, Cereb Ped5 cerebellar peduncle. All values310E-6 mm2/s.
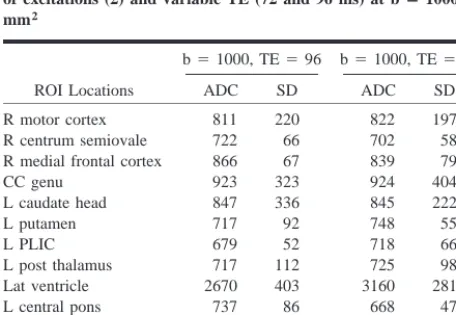
TABLE 4: Mean ADC and SD for single subject with fixed number of excitations (2) and variable TE (72 and 96 ms) at b51000 s/ mm2
ROI Locations
b51000, TE596 ADC SD
b51000, TE572 ADC SD R motor cortex
R centrum semiovale R medial frontal cortex CC genu
L caudate head L putamen L PLIC L post thalamus Lat ventricle L central pons L middle cereb ped L dentate nucleus
811 722 866 923 847 717 679 717 2670 737 612 684 220 66 67 323 336 92 52 112 403 86 58 68 822 702 839 924 845 748 718 725 3160 668 600 712 197 58 79 404 222 55 66 98 281 47 51 64 Note.—R5right, L5left, CC5corpus callosum, PLIC5 pos-terior limb internal capsule, Post5posterior, Lat5lateral, Cereb Ped
5cerebellar peduncle. All values310E-6 mm2/s.
physiological basis of diffusion imaging as differ-ent characteristics of tissue are revealed at differdiffer-ent diffusion sensitivities. Increasing the acquisition b value has several implications for diffusion-weight-ed imaging. The gray-white contrast reversal re-sults in an alteration of the lesion-to-background contrast. The relative conspicuity of restricted dif-fusion in gray matter is expected to be greater at higher b values, whereas lesion conspicuity in white matter may be greater at lower b values. The optimal b value for evaluation of specific disease states with diffusion-weighted imaging must be de-termined. The use of multiple sequences with dif-fering b values may yield complementary results (Fig 4).
[image:4.612.61.541.305.464.2] [image:4.612.61.289.555.712.2]FIG3. ADC maps at varying b values. Improved gray-white dif-ferentiation is noted with increased b value.A, b51000;B, b5
2000;C, b52500; andD, b53500. FIG4. Clinical case of multiple sclerosis.
A, Fast spin-echo axial T2-weighted image (4000/102/2 [TR/ TE/excitations]) shows a dominant subcortical right cingulate gy-rus lesion with marked hyperintensity.
B, Fast-FLAIR image (10000/145/2200/1 [TR/TE/excitations]) highlights additional subcortical and periventricular plaques, in-cluding a large lesion in the right side of the splenium.
C, Diffusion-weighted image (10000/72/1) obtained with b5 1000 s/mm2 reveals slight hyperintensity in the right cingulate
lesion, similar to the contralateral mesial frontal region, and hy-perintensity in the right splenium lesion.
D, Diffusion-weighted image (10000/96/1) obtained with b5 3500 s/mm2reveals marked hypointensity in the right cingulate
lesion, likely reflecting reduced T2 weighting and less T2 shine-through. Persistent hyperintensity in the right splenium lesion is likely due to the normal anisotropy of the splenium and incon-spicuity of hypointense lesions adjacent to the CSF spaces. This emphasizes the complementary relationship of the diffusion-weighted acquisitions obtained at standard and high b values.
FIG5. Reversal of gray-white matter contrast with increasing b
values. Relative signal intensity values obtained from equation 2 in the text.
diffusion trace images. Higher b-value images have relatively less intrinsic T2 weighting and may be useful in differentiating restricted diffusion from T2 shine-through (Fig 4).
The changes in the relative diffusion-weighted imaging signal intensity of gray and white matter with b-value modulation are predicted by the signal intensity equation for a spin-echo diffusion-weight-ed image, which is given by:
S 5N(h) 3(12exp(2TR/T1))
3exp(2TE/T2)3exp(2bD) (2)
assuming monoexponential diffusion, where N(h) is the proton density, TR is the pulse repetition time, T1 is the spin-lattice relaxation time, TE is the spin-echo time, T2 is the spin-spin relaxation time, b is the strength of the diffusion gradient, and D is the diffusion coefficient. Using this equation, we plotted the theoretical signal intensities for gray and white matter by using average imaging param-eters and tissue relaxation values (6, 7). From these data, it is possible to derive hypothetical signal in-tensity curves for a range of b values (Fig 5). The progressive increase in white matter intensity and decrease in gray matter intensity on diffusion-weighted images with increasing b values shown empirically by our data (Fig 1 and Table 1) are predicted by this model.
[image:5.612.47.276.62.315.2] [image:5.612.300.529.62.334.2] [image:5.612.299.527.547.711.2]intensity in the trace images transitions from a Dfast to a Dslow weighting. There are also important dif-ferences between intracellular (Din) and extracel-lular (Dex) diffusion coefficients corresponding to the slow and fast diffusion components, respective-ly. Niendorf et al (9) showed that the Dfast and Dslow do not equal but are proportional to Dinand Dex, respectively. Kraemer et al (10) showed that the extracellular component dominates at b values less than 1000s/mm2 and that the ADC measure-ments obtained at these values primarily reflect ex-tracellular diffusion, especially when the data are fitted to a single exponential.
A multi-component diffusion model has substan-tial implications for the postprocessing of diffusion trace (ADC) images. Obviously, the two-point cal-culation is inadequate to characterize the signal in-tensity as the b value is modulated. The least-squares multi-point approach, although possibly reducing the SD of the measurements, will yield incorrect results. A more sophisticated postprocess-ing approach is required for these data that uses the biexponential nature of the signal attenuation. One processing avenue to pursue is the non-negative least-squares algorithm that theoretically would ex-tract all diffusion components. However, it is likely that this would require increased b-value sampling density as well as higher b values to improve the resolution of the diffusion measurements. At the very least, this technique would significantly in-crease the acquisition time necessary to generate the data sets for these calculations.
Burdette et al (11) compared ADC measure-ments using two-point and six-point techniques in the b-value range of 0 to 1000 s/mm2 and noted that the mean percentage difference between the two methods was 0.84%. Their results support the concept that the ADC calculation for a two-point calculation is practical, reproducible, and accept-able for clinical diffusion examinations. We ob-served significant variation in the ADC value for b values of 1000 to 3000 s/mm2, well beyond the range that was investigated by Burdette et al. For practical purposes, our results suggest that it is not valid to extrapolate ADC values obtained at a par-ticular b value to other b values.
Ulug et al (12) addressed the problem of ADC reproducibility within and between neuroanatomic sites. The relatively large SDs of ADC measure-ments observed in this study again emphasize this issue. The results presented by Ulug et al showed minimal interparticipant variation when comparing ipsilateral to contralateral ratios of ADC as a means to quantitate changes in ADC measurements.
The usefulness of ADC maps has been ques-tioned by other investigators who cite a greater sen-sitivity and accuracy and a very high specificity in the detection of early cerebral infarctions (98.1, 97.7, and 97.1%, respectively) for orthogonal axis diffusion-weighted images compared with ADC maps (13, 14). The validation of their conclusions in the evaluation of stroke at higher b values is necessary. The need for postprocessing, specifically ADC map generation, may be less at higher b val-ues as the intrinsic diffusion sensitivity is increased and the T2 effects are reduced.
The variation in the echo time and the number of signal averages between and within the various subgroups of participants in this study could be considered a limitation of this investigation. The inclusion of participant data obtained with these variations has both positive and negative effects. The qualitative observations regarding signal inten-sity features were correct for all patients indepen-dent of these variations, thus increasing the likeli-hood of reproducibility by other centers. Conversely, the variations in protocol limited the number of examinations available for quantitative assessment of ADC variation independent of echo time and number of excitations. Measurements were obtained from six participants with a fixed echo time. Averaging of a larger number of partic-ipants’ data may provide a more reliable standard of reference for normal ADC values.
Conclusion
ac-curately reflecting the relative ADC values of gray and white matter, with hyperintensity correspond-ing to lower ADC values. Restricted diffusion and lower ADC values in white matter results in hy-perintensity relative to gray matter on the more heavily diffusion-weighted images. ADC depen-dence on b value must be considered in the inter-pretation of these quantitative measurements. Our data indicate that diffusion in human brain is not monoexponential. Although ADC algorithms using the monoexponential assumption are practical, a more complex approach is required to extract the fast and slow diffusion components present in brain tissue. Attention to these findings, especially the reversal of gray-white contrast and ADC depen-dence on b value, is important in avoiding erro-neous assignment of pathologic abnormalities to normal regions. Future studies are necessary to de-fine the role of high b-value diffusion imaging fur-ther in the evaluation of acute stroke and ofur-ther pathologic abnormalities.
Acknowledgments
This work was supported in part by General Electric Med-ical Systems, Milwaukee, WI.
References
1. Le Bihan D, Breton E, Lallemand D, Grenier P, Cabanis E, Laval-Jeantet M. MR imaging of intravoxel incoherent motions:
ap-plication to diffusion and perfusion in neurologic disorders.
Radiology 1986;161:401–407
2. Warach S, Chien D, Li W, Ronthal M, Edelman RR. Fast
mag-netic resonance diffusion-weighted imaging of acute human stroke. Neurology 1992;42:1717–1723
3. Chien D, Kwong KK, Gress DR, Buonanno FS, Buxton RB, Ro-sen BR. MR diffusion imaging of cerebral infarction in
hu-mans. AJNR Am J Neuroradiol 1992;13:1097–1102
4. Yuh WT, Crain MR, Loes DJ, Greene GM, Ryals TJ, Sato Y. MR
imaging of cerebral ischemia: findings in the first 24 hours.
AJNR Am J Neuroradiol 1991;12:621–629
5. Lovblad KO, Baird AE, Schlaug G, et al. Ischemic lesion
vol-umes in acute stroke by diffusion-weighted magnetic reso-nance imaging correlate with clinical outcome. Ann Neurol
1997;42:164–170
6. Le Bihan D, Turner R, Patronas N. Imaging in brain and tumors. In: Lebihan D, ed. Diffusion and Perfusion Magnetic Resonance Imaging: Applications to Functional MRI. New York: Raven Press;1995;:134–139
7. Hendrick RE. Image contrast and noise. In: Stark DD, Bradley WG, eds. Magnetic Resonance Imaging. 3 ed. St. Louis: Mosby; 1999;:43–67
8. Kwong KK, Chesler DA, Baker JR, et al. Functional magnetic
resonance imaging: MR movie of human brain activity.
Pre-sented at the Functional MRI of the Brain Workshop of the So-ciety of Magnetic Resonance in Medicine and the SoSo-ciety for Magnetic Resonance Imaging, Arlington, June 1993
9. Niendorf T, Dijkhuizen RM, Norris DG, van Lookeren Campagne M, Nicolay K. Biexponential diffusion attenuation in various
states of brain tissue: implications for diffusion-weighted im-aging. MRM 1996;36:847–857
10. Kraemer F, Darquie A, Clark CA, LeBihan D. Separation of two
diffusion compartments in the human brain. Presented at the
Meeting of the International Society for Magnetic Resonance in Medicine, Philadelphia, May 1999
11. Burdette JH, Elster AD, Ricci PE. Calculation of apparent
dif-fusion coefficients (ADCs) in brain using two-point and six-point methods. J Comput Assist Tomogr 1998;22:792–794
12. Ulug AM, Beauchamp N Jr, Bryan RN, van Zijl PC. Absolute
quantitation of diffusion constants in human stroke. Stroke
1997;28:483–490
13. Chong J, Lu D, Aragao F, et al. Diffusion-weighted MR of acute
cerebral infarction: comparison of data processing methods.