n
Gastrointestinal
ima
Gin
G
1 From the Cancer Research UK Cancer Imaging Centre,
Division of Radiotherapy and Imaging (J.M.W., N.T., M.R., K.M., N.P.J., M.G., M.D.B., D.J.C., N.M.d.S., S.J.D., D.M.K., M.O.L., C.M., M.R.O.) and Division of Clinical Studies (J.S.d.B., T.A.Y.), the Institute of Cancer Research and Royal Marsden Hospital, London, England; MRI Unit (J.M.W., N.T., M.R., K.M., N.P.J., M.G., M.D.B., D.J.C., N.M.d.S., S.J.D., D.M.K., M.O.L., C.M., M.R.O.) and Drug Development Unit (J.S.d.B., T.A.Y.), the Royal Marsden NHS Foundation Trust, Downs Road, Sutton, Surrey SM2 5PT, England. Received August 19, 2016; revision requested October 12 and received December 1; accepted December 14; final version accepted December 20. Address correspondence to
M.O.L. (e-mail: [email protected]).
Supported by Cancer Research UK and Engineering and Physical Sciences Research Council support to the Cancer Imaging Centre at the Institute of Cancer Research and Royal Marsden Hospital in association with the Medical Re-search Council and Department of Health C1060/A10334, C1060/A16464 and National Health Service funding to the National Institute for Health Research (NIHR) Biomedical Research Centre and the Clinical Research Facility in Imag-ing. M.O.L. is an Emeritus NIHR Senior Investigator.
Current address:
2 Cardiff University Brain Research Imaging Centre, School
of Psychology, Cardiff University, Cardiff, Wales. Published under a CC BY 4.0 license.
Purpose: To assess the repeatability of apparent diffusion coeffi-cient (ADC) estimates in extracranial soft-tissue diffusion-weighted magnetic resonance imaging across a wide range of imaging protocols and patient populations.
Materials and
Methods: Nine prospective patient studies and one prospective vol-unteer study, performed between 2006 and 2016 with re-search ethics committee approval and written informed consent from each subject, were included in this single-institution study. A total of 141 tumors and healthy organs were imaged twice (interval between repeated examina-tions, 45 minutes to 10 days, depending the on study) to assess the repeatability of median and mean ADC esti-mates. The Levene test was used to determine whether ADC repeatability differed between studies. The Pearson linear correlation coefficient was used to assess correla-tion between coefficient of variacorrela-tion (CoV) and the year the study started, study size, and volumes of tumors and healthy organs. The repeatability of ADC estimates from small, medium, and large tumors and healthy organs was assessed irrespective of study, and the Levene test was used to determine whether ADC repeatability differed be-tween these groups.
Results: CoV aggregated across all studies was 4.1% (range for each study, 1.7%–6.5%). No correlation was observed between CoV and the year the study started or study size. CoV was weakly correlated with volume (r = 20.5, P = .1). Repeatability was significantly different between small, medium, and large tumors (P , .05), with the low-est CoV (2.6%) for large tumors. There was a significant difference in repeatability between studies—a difference that did not persist after the study with the largest tumors was excluded.
Conclusion: ADC is a robust imaging metric with excellent repeat-ability in extracranial soft tissues across a wide range of tumor sites, sizes, patient populations, and imaging pro-tocol variations.
Published under a CC BY 4.0 license.
Online supplemental material is available for this article.
Jessica M. Winfield, PhD Nina Tunariu, MD Mihaela Rata, PhD Keiko Miyazaki, PhD Neil P. Jerome, PhD Michael Germuska, PhD2
Matthew D. Blackledge, PhD David J. Collins, BA Johann S. de Bono, MD, PhD Timothy A. Yap, MD, PhD Nandita M. deSouza, MD Simon J. Doran, PhD Dow-Mu Koh, MD Martin O. Leach, PhD Christina Messiou, MD Matthew R. Orton, PhD
Repeatability of Apparent Diffusion
Coefficient Estimates from
quantitative imaging biomarkers has been proposed by the Radiological So-ciety of North America Quantitative Imaging Biomarkers Alliance (QIBA) (12,13). The QIBA framework recom-mends reporting repeatability by using the within-subject standard deviation, limits of agreement (LoAs), repeatabil-ity coefficient (RC), intraclass correla-tion coefficient (ICC), and within-subject coefficient of variance; the QIBA also emphasizes the importance of reporting measurement conditions. A detailed in-vestigation of ADC repeatability across a wide range of studies using the QIBA framework is therefore desirable.
The aim of this study was to assess ADC repeatability using the framework proposed by the QIBA in extracranial soft-tissue DW MR imaging studies to investigate whether ADC repeatability differs between studies performed by using different imaging protocols and patient populations over a period of 10 years at a single institution.
observers, and repetition after a short interval (typically 1 hour to 7 days). In DW MR imaging–based studies that re-port ADC estimates, the “measurand” is usually the mean or median of ADC estimates from voxels in a tumor. On the other hand, reproducibility may be defined as “closeness of the agreement between the results of measurements of the same measurand carried out under changed conditions of measurement” (10)—for example, by using a different MR imaging unit. The inter–imaging unit reproducibility of ADC estimates is particularly important in multicenter studies, where it has been shown that good-quality DW images with reproduc-ible ADC estimates across platforms can be obtained following careful optimiza-tion of imaging protocols (11).
Exploratory DW MR imaging stud-ies in clinical trials often incorporate ADC repeatability estimates, usually by obtaining two baseline examinations with the second examination during the same visit (the so-called coffee-break repeatability study) or at a second visit 1 or more days later. The requirement for two baseline examinations increases the burden on patients, which may re-duce recruitment or retention rates, and requires additional imaging unit time and resources, which may be difficult to accommodate in busy radiology depart-ments. It would be advantageous to es-timate ADC repeatability from previous studies, but this would be feasible only if repeatability was broadly the same across studies, despite variations in im-aging protocol, tumor type, or patient cohort; large differences in repeatability would argue strongly for study-specific repeatability estimates. The variety of repeatability metrics reported in the literature hinders comparison between studies, and a framework for assess-ment of the technical performance of
Published online before print
10.1148/radiol.2017161965 Content codes:
Radiology 2017;000:1–12
Abbreviations:
ADC = apparent diffusion coefficient CI = confidence interval CoV = coefficient of variation DW = diffusion weighted
ICC = intraclass correlation coefficient LoA = limit of agreement
QIBA = Quantitative Imaging Biomarkers Alliance RC = repeatability coefficient
ROI = region of interest VOI = volume of interest
Author contributions:
Guarantors of integrity of entire study, M.O.L., M.R.O.; study concepts/study design or data acquisition or data analysis/interpretation, all authors; manuscript drafting or manuscript revision for important intellectual content, all authors; manuscript final version approval, all authors; agrees to ensure any questions related to the work are ap-propriately resolved, all authors; literature research, J.M.W., N.T., D.J.C., M.R.O.; clinical studies, J.M.W., N.T., M.R., K.M., N.P.J., M.G., M.D.B., D.J.C., J.S.d.B., T.A.Y., N.M.d.S., D.M.K., C.M., M.R.O.; experimental studies, J.M.W., M.R., N.P.J., M.G., T.A.Y., M.R.O.; statistical analysis, J.M.W., M.R., K.M., N.P.J., D.J.C., M.R.O.; and manuscript editing, J.M.W., N.T., M.R., K.M., N.P.J., M.D.B., D.J.C., J.S.d.B., T.A.Y., N.M.d.S., S.J.D., D.M.K., M.O.L., C.M., M.R.O.
Conflicts of interest are listed at the end of this article.
Advances in Knowledge
n Repeated apparent diffusion coef-ficient (ADC) estimates can be obtained from extracranial soft-tissue diffusion-weighted (DW) MR imaging with coefficients of variation (CoVs) of between 2% and 7%.
n ADC repeatability does not differ markedly (CoV, 2%–7%)
between DW MR imaging studies across a wide range of patient cohorts and imaging protocol variations.
n Better ADC repeatability is observed in large tumors than in smaller tumors.
Implication for Patient Care
n DW MR imaging can be used to
estimate ADC with good repeat-ability in extracranial soft tissues, allowing a posttreatment increase of 12% or more in ADC to be distinguished.
B
ody diffusion-weighted (DW)mag-netic resonance (MR) imaging is well established as a qualitative and quantitative technique in oncology (1). The most simple quantitative metric derived from DW MR imaging is the ap-parent diffusion coefficient (ADC), which is estimated by fitting a monoexponen-tial curve to the measured signal at two or more diffusion weightings (b values). Baseline ADC estimates or posttreatment changes in ADC have been shown to be indicative of response to chemotherapy and/or chemotherapy and radiation ther-apy in many tumor types, including rectal adenocarcinoma (2), hepatic metastases of colorectal (3) and gastric (4) cancers, cervical cancer (5), breast cancer (6), head-and-neck squamous cell carcinoma (7), ovarian cancer (8), and non–small cell lung cancer (9).
. (5)
sB was estimated as
(
)
B BMS WMS /
s = − K, where
BMS ( ) /2
1
K Y Y N N
i i
= −
=
∑
is the between-subject mean squares,
WMS ( ) /2 ( 1)
1 1
Y Y N K N K
ik i i k
= − −
= =
∑∑
is thewithin-subject mean squares, K is the number of replications (K = 2 for all studies in this analysis), Yik is the observed value of log(ADCmedian) or log(ADCmean) for the ith VOI at the
kth replication, Yi is the average over replications for the ith VOI, and Y is
the grand mean of log(ADCmedian) or log(ADCmean) over all observations (24).
The 95% confidence inter-vals (CIs) for sW were estimated as
, where
- is the pth centile of the x2
distribution with N degrees of freedom (24).
95% CIs for ICCs were
esti-mated as 1, 1
1 1
L U
L U
F F
F F
− −
+ +
, where
- and
- , with
0 BMS / WMS
F = , and - is
the pth centile of the F distribution with d1 and d2 degrees of freedom (25).
In addition to each study being an-alyzed individually, VOIs were grouped into small, medium, and large, regard-less of study (ie, smallest third, middle third, and largest third of VOIs), and repeatability was assessed for the three groups (47 VOIs per group). Finally, VOIs were aggregated from all studies, and repeatability was assessed for 141 VOIs together.
The Levene test for homoscedastic-ity (Matlab, LeveneAbsolute, vartestn, 2016a; Mathworks) was used to assess whether repeatability differed between studies (24). Baseline differences were calculated for each VOI for log(ADCmean)
2 B
2 2
B W
ICC s
s s
= + between studies reflect changes in
tech-nology and personnel (Table 1). For each tumor or healthy organ, all fitted pixels in the ROIs were combined to create a VOI. Median and mean
ADC (ADCmedian and ADCmean) were
estimated for each VOI. Bland-Altman plots of untransformed data showed a tendency for differences between pairs of baseline measurements to scale with their ADC (see Figure E1 [online]), in which case it is recommended (13,20) that repeatability (and changes due to treatment) be quantified by using a pro-portional (ie, ratio-based) measure so that the same measure applies across the range of ADCs encountered. This can most easily be achieved by using the natural logarithm of the data (12,13,20– 22), and this was done for all statistical analyses in this study. A paired t test was used to assess whether there was a significant difference between the first and second baseline measurements in each study. P , .05 was considered to indicate a significant difference.
Repeatability was assessed by using the methods recommended by QIBA (13). The within-subject standard devi-ation (sW) of the log-transformed ADC estimates was estimated according to Equation (1), where di is the difference between two baseline estimates of log(ADCmedian) or log(ADCmean) for the ith VOI, and N is the number of VOIs:
(1)
The within-subject CoV (23), 95% LoA, and RC, which depend only on sW, were
estimated according to Equations (2), (3), and (4), respectively.
(2)
(3)
and
(4)
The ICC was estimated according to Equation (5), where sB is the between-subject standard deviation:
Materials and Methods
Study Population
Nine patient studies and one healthy volunteer study were included in this analysis. All studies were approved by relevant National Research Ethics Com-mittees. All patients and volunteers gave their written consent to partici-pate in the studies. Only repeatability data from double-baseline examina-tions are reported here; posttreatment changes were outside the scope of this study but have been reported in the lit-erature for some studies (14–18).
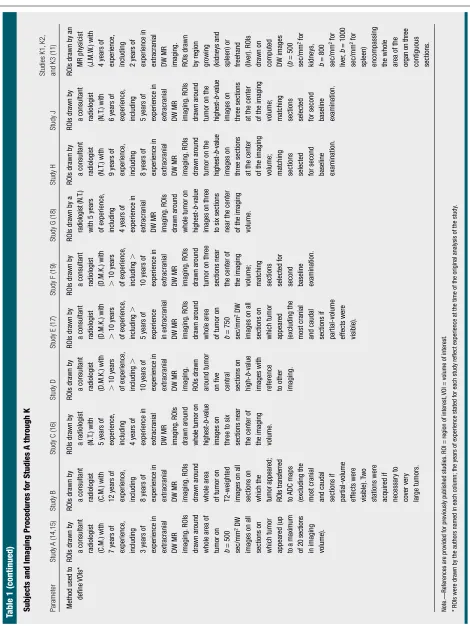
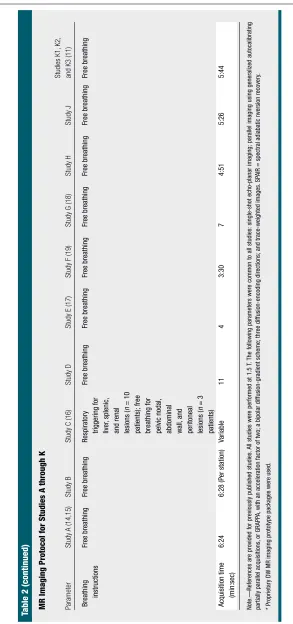
Tables 1 and 2 describe the sub-jects and the DW MR imaging proto-cols for each study (labeled A through K); further information is available in the references given. All studies were performed at 1.5 T by using MAGNE-TOM Avanto or Aera MR imaging units (Siemens) (Table 2). In studies where the imaging study or ADC repeatabil-ity study formed a subset of the total cohort (studies C and G), only data in patients that contributed to the ADC repeatability results are reported. In multicenter studies, only data from our center are reported (studies D, E, and K). In studies including intra-cranial and extraintra-cranial tumors, only extracranial data are reported (studies A and F). One result (the coefficient of variation [CoV] of ADCmedian in study K) has been reported previously (11), but other results from study K have not been reported previously. No other results presented here have been re-ported previously, as publications from the original studies included data from intracranial tumors (14,15,19) or data from other centers (17), which are ex-cluded from this analysis.
Image and Data Analysis
Table 1 Subjects and Imaging Pr
ocedur
es for Studies A thr
ough K
Parameter
Study A
(14,15)
Study B
Study C (16)
Study D
Study E (17)
Study F (19)
Study G (18)
Study H
Study J
Studies K1,
K2,
and K3 (11)
Pa
tient or volunteer cohort?
Pa
tients (phase 1 trial popula
tion;
adults)
Pa
tients (adults)
Pa
tients (phase 1 trial popula
tion;
adults)
Pa
tients (adults)
Pa
tients (phase 1 trial popula
tion;
adults)
Pa
tients (pedia
tric)
Pa
tients (phase 1 trial popula
tion;
adults)
Pa
tients (phase 1 trial popula
tion;
adults)
Pa
tients (phase 1 trial popula
tion;
adults)
Healthy volunteers (adults,
women)
Tumor site
or healthy organ examined
Mixed (17
abdominal,
nine pelvic lesions)
Retroperitoneal
soft-tissue masses Mixed (eight liver lesions,
one
splenic lesion,
one renal lesion,
one
peritoneal lesion,
one
abdominal wall lesion,
one pelvic lymph node)
Renal cell
carcinoma
Mixed (five liver lesions,
four
pelvic lesions)
Mixed
(extracranial solid tumors)
Mixed (four liver
lesions,
two
pelvic lesions,
two pelvic lymph nodes)
Mixed (five liver
lesions,
one
lung lesion,
one abdominal lymph node)
Liver lesions
Healthy organs (K1:
kidneys;
K2:
liver; K3:
spleen)
No.
of pa
tients
or healthy volunteers
26
23
13
11
9
8
8
7
6
10
Start and end
da
tes of
stud
y
2008–2010
2013–2016
2009–2010
2010–2016
2006–2007
2010–2014
2008–2009
2014–2016
2011–2012
2012
Inter
val between two
examina
tions
7 Days
Approxima
tely
45 minutes (“coffee-break”
repea
tability)
4–7 Days
24 Hours
2–10 Days
24 Hours
4–10 Days
2–3 Days
5 Days
1–7 Days Table 1
Parameter
Study A
(14,15)
Study B
Study C (16)
Study D
Study E (17)
Study F (19)
Study G (18)
Study H
Study J
Studies K1,
K2,
and K3 (11)
Method used to
define VOIs*
ROIs dra
wn by
a consultant radiologist (C.M.) with 7 years of experience,
inc
luding
3 years of experience in extracranial DW MR ima
ging.
ROIs
dra
wn around
whole area of tumor on b = 500 sec/mm
2 DW
ima
ges on all
sections on which tumor appeared (up to a maximum
of 20 sections
in ima ging volume). ROIs dra wn by
a consultant radiologist (C.M.) with 12 years of experience,
inc
luding
8 years of experience in extracranial DW MR ima
ging.
ROIs
dra
wn around
whole area of tumor on T2-weighted ima
ges on all
sections on which the tumor a
ppeared; ROIs transferred to ADC ma ps (exc luding the
most cranial and caudal sections if partial-volume effects were visible).
T
wo
sta
tions were
acquired if necessar
y to cover ver y large tumors. ROIs dra wn by
a radiologist (N.T
.) with
5 years of experience,
inc
luding
4 years of experience in extracranial DW MR ima
ging.
ROIs
dra
wn around
whole tumor on
highest-b -value ima ges on
three to six sections near the center of the ima
ging
volume.
ROIs dra
wn by
a consultant radiologist (D.M.K.) with . 10 years of experience,
inc
luding
.
10 years of experience in extracranial DW MR ima
ging.
ROIs dra
wn
around tumor on five central sections on
high-b
-value
ima
ges with
reference to other ima
ging.
ROIs dra
wn by
a consultant radiologist (D.M.K.) with . 10 years of experience,
inc
luding
.
5 years of experience in extracranial DW MR ima
ging.
ROIs
dra
wn around
whole area of tumor on b = 750 sec/mm
2 DW
ima
ges on all
sections on which tumor appeared (exc
luding the
most cranial and caudal sections if partial-volume effects were visible).
ROIs dra
wn by
a consultant radiologist (D.M.K.) with . 10 years of experience,
inc
luding
.
10 years of experience in extracranial DW MR ima
ging.
ROIs
dra
wn around
tumor on three sections near the center of the ima
ging
volume; matching sections selected for second baseline examina
tion.
ROIs dra
wn by a
radiologist (N.T
.)
with 5 years of experience,
inc
luding
4 years of experience in extracranial DW MR ima
ging.
ROIs
dra
wn around
whole tumor on
highest-b
-value
ima
ges on three
to six sections near the center of the ima
ging
volume.
ROIs dra
wn by
a consultant radiologist (N.T
.) with
9 years of experience,
inc
luding
8 years of experience in extracranial DW MR ima
ging.
ROIs
dra
wn around
tumor on the
highest-b
-value
ima
ges on
three sections at the center of the ima
ging
volume; matching sections selected for second baseline examina
tion.
ROIs dra
wn by
a consultant radiologist (N.T
.) with
6 years of experience,
inc
luding
5 years of experience in extracranial DW MR ima
ging.
ROIs
dra
wn around
tumor on the
highest-b
-value
ima
ges on
three sections at the center of the ima
ging
volume; ma
tching
sections selected for second baseline examina
tion.
ROIs dra
wn by an
MR physicist (J.M.W
.) with
4 years of experience,
inc
luding
2 years of experience in extracranial DW MR ima
ging.
ROIs dra
wn
by region gro
wing
(kidneys and spleen) or freehand (liver).
ROIs
dra
wn on
computed DW ima
ges
(
b
= 500
sec/mm
2 for
kidneys,
b
= 800 sec/mm
2 for
liver , b = 1000 sec/mm
2 for
spleen) encompassing the whole area of the organ on three
contiguous sections.
Note.—References are provided for previously published studies.
ROI = region of interest,
VOI = volume of interest.
* ROIs were dra
wn by the authors named in each column; the years of experience sta
ted for each stud
y reflect experience a
t the time of the original analysis of the stud
y.
Table 1 (continued) Subjects and Imaging Pr
ocedur
es for Studies A thr
Table 2 MR Imaging Pr
otocol for Studies A thr
ough K
Parameter
Study A
(14,15)
Study B
Study C (16)
Study D
Study E (17)
Study F (19)
Study G (18)
Study H
Study J
Studies K1,
K2,
and K3 (11)
MR ima
ging
unit
MAGNETOM Avanto (Siemens, Erlangen, German
y)
MAGNETOM
Aera (Siemens) MAGNETOM Avanto (Siemens)
MAGNETOM
Avanto (Siemens) MAGNETOM Avanto (Siemens)
MAGNETOM
Avanto (Siemens)
MAGNETOM
Avanto (Siemens)
MAGNETOM
Avanto (Siemens) MAGNETOM Avanto (Siemens)
MAGNETOM
Avanto (Siemens)
Orienta tion of ima ging plane Axial Axial Coronal oblique Coronal Axial Coronal Axial Coronal Coronal Axial Section thickness (mm) 5 5 5 5 5 5 5 5 5 6
Field of view (read 3
phase) (mm) 380 3 380 380 3 256 380 3 380 380 3 380 340 3 298 300 3 300 380 3 308 380 3 380 380 3 380 380 3 332 Acquired ma trix (read 3 phase) 128 3 128 160 3 108 128 3 128 128 3 128 128 3 112 128 3 128 128 3 104 128 3 128 128 3 128 128 3 112 Reconstructed ma trix (read 3 phase) 256 3 256 320 3 216 256 3 256 256 3 256 256 3 256 256 3 256 256 3 208 256 3 256 256 3 256 256 3 224
Echo time (msec)
69 65 70 64 72 75 69 75 68 75 Repetition time (msec) 3500 9200
2500 to 7000
4000 3500 3500 3500 3500 3500 8000 Fa t suppression SP AIR SP AIR SP AIR SP AIR Chemical fa t suppression SP AIR SP AIR SP AIR SP AIR SP AIR b V
alues used for ADC estima
tes (sec/mm 2) 0, 50, 100, 250, 500, 750 50, 600, 900 50, 100, 300, 600, 900 0, 20, 40, 60, 80, 100, 250, 500, 750, 1000* 0, 50, 100, 250, 500, 750 0, 50, 100, 300, 600, 1000 0, 50, 100, 300, 600, 900, 1050 0, 50, 100, 300, 600, 1000 150, 600, 900 100, 500, 900 ( b
= 0 acquired
but not used in ADC estima
tion)
Diffusion-encoding
scheme
Three-scan trace
Three-scan
trace
Three-scan trace
Three-scan trace Orthogonal Three-scan trace Three-scan trace Three-scan trace
Three-scan trace
Three-scan
trace
Receiver
bandwidth (Hz/pixel)
1775 1954 1565 1628 1445 1860 1775 1954 1776 1776 Phase partial Fourier 6/8 6/8 6/8 6/8 6/8 6/8 6/8 7/8 6/8 Not used No.
of signals acquired
6
Four for
b
= 50
and 600 sec/ mm
2; five for
b
= 900 sec/mm
2 4 4 5 3 6 5 10
4 Table 2
Parameter
Study A
(14,15)
Study B
Study C (16)
Study D
Study E (17)
Study F (19)
Study G (18)
Study H
Study J
Studies K1,
K2,
and K3 (11)
Brea
thing instructions
Free brea
thing
Free brea
thing
Respira
tor
y
triggering for liver
, splenic,
and renal lesions (
n
= 10
pa
tients); free
brea
thing for
pelvic nodal,
abdominal wall,
and
peritoneal lesions (
n
= 3
pa
tients)
Free brea
thing
Free brea
thing
Free brea
thing
Free brea
thing
Free brea
thing
Free brea
thing
Free brea
thing
Acquisition time
(min:sec)
6:24
6:28 (P
er sta
tion)
Variable
11
4
3:30
7
4:51
5:26
5:44
Note.—References
are
provided
for
previously
published
studies.
All
studies
were
performed
at
1.5
T.
The
follo
wing
parameters
were
common
to
all
studies:
single-shot
echo-planar
ima
ging;
parallel
ima
ging
using
generalized
autocalibra
ting
partially parallel acquisitions,
or GRAPP
A,
with an accelera
tion factor of two; a bipolar diffusion-gradient scheme; three diffusion-encoding directions; and trace-weighted ima
ges.
SP
AIR = spectral adiaba
tic nversion recover
y.
* Proprietar
y DW MR ima
ging prototype packa
ges were used.
Table 2 (continued) MR Imaging Pr
otocol for Studies A thr
ough K
and log(ADCmedian), and the Levene test
was used to assess whether the variance of the differences was the same for all studies; the Levene test was also used to assess whether repeatability differed between small, medium, and large VOIs.
The Pearson linear correlation co-efficient (Matlab, 2016a; Mathworks) was used to assess correlation be-tween CoV and the year the study started, the number of VOIs in the study, and the median volume of VOIs in the study.
Results
The repeatability of ADCmean was
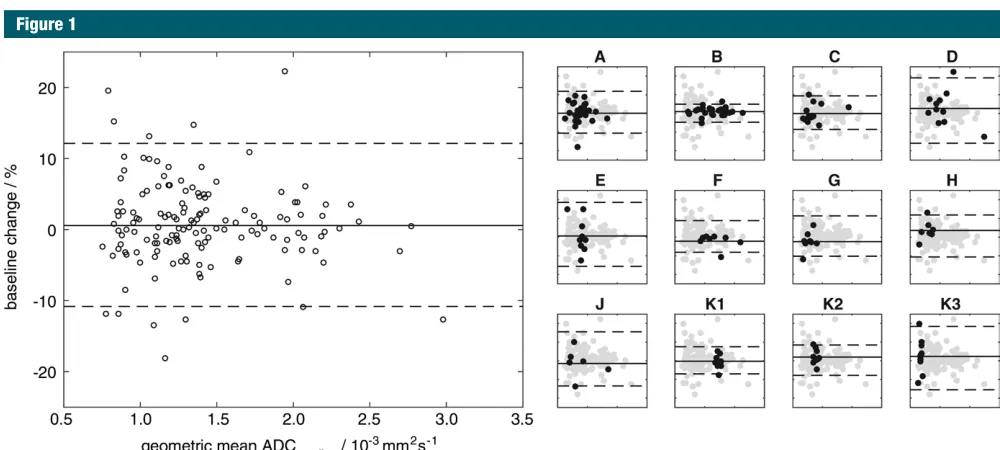
sim-ilar to the repeatability of ADCmedian in all studies (Table 3 and Table E1 [online]); for clarity, only ADCmedian is shown in Figures 1–4. Bland-Altman plots showed no relationships between differences between pairs of base-line measurements and their means (Fig 1). None of the studies showed a significant difference between pairs
of baseline measurements (P . .05,
paired t test). The repeatability of AD-Cmedian (Table 3) and ADCmean (Table
E1 [online]) was good, with CoVs
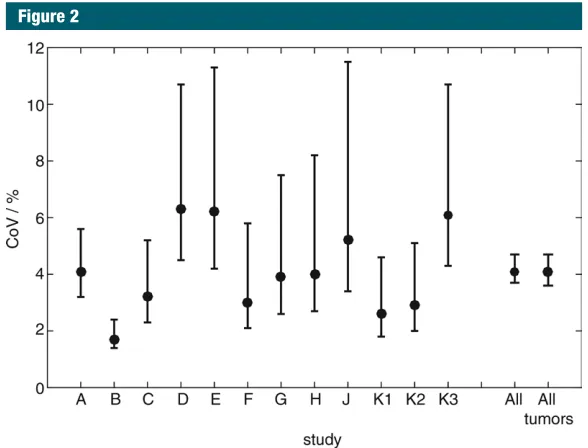
be-tween 1.7% and 6.3% for ADCmedian
and between 1.7% and 6.5% for AD-Cmean for all studies (Fig 2). When we
aggregated VOIs from all studies, we
found that CoV was 4.1% for ADC
me-dian and 3.9% for ADCmean, with upper
and lower 95% LoAs of 12.1% and
210.8%, respectively, for ADCmedian
and 11.5% and –10.3% for ADCmean.
The Levene test showed a significant difference between studies (P = .01 for ADCmedian and ADCmean) that did not persist after the study with the lowest CoV (study B, which included some of the largest VOIs) was excluded.
There was no correlation between the CoV and the year the studies started (Fig 3, A; r = 20.4, P = .2 for ADCmedian and r = 20.3, P = .3 for ADCmean) nor
between the CoV and the number of VOIs in each study (Fig 3; B, r = 20.3, P = .3 for ADCmedian and r = 20.4, P = .2 for ADCmean). Only weak correlation was
Discussion
The excellent repeatability of ADC me-dian and ADCmean (CoV, between 1.7%
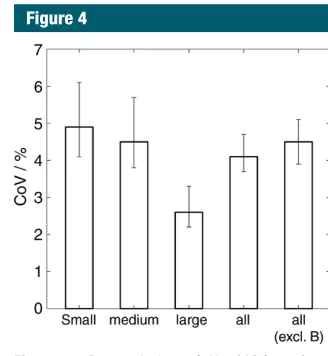
and 6.5% in all studies) demonstrates that ADC is a robust metric in clinical sizes (Levene test; P = .02 for ADCmedian
and P = .04 for ADCmean), with the low-est CoV for large VOIs (Fig 4). Although 19 VOIs in the large group were from study B, the majority (28 VOIs) were from other studies.
ADCmean), although the CoV was
notice-ably lower in one study with very large tumors (study B) compared with other studies. Grouping VOIs into small, me-dium, and large revealed a significant difference in ADC repeatability between
Figure 1
Figure 1: Bland-Altman plot shows percentage change between two baseline estimates of ADCmedian versus their geometric mean for all VOIs in all studies. Subplots
A through K3 show Bland-Altman plots for each study (black dots) with VOIs from all other studies shown as gray dots; the x- and y-axis limits are the same as in the
overall plot. On each plot, solid lines = the mean difference between two baseline examinations for the specified data, dashed lines = 95% LoAs.
Table 3
Repeatability of ADCmedian
Study CoV (%)
95% LoA (%)
RC (log scale) sW (log scale) sB (log scale) ICC
Upper Lower
A 4.1 (3.2, 5.6) 11.9 (9.2, 16.6) 210.6 (214.3, 28.5) 0.112 (0.088, 0.154) 0.040 (0.032, 0.055) 0.218 0.967 (0.928, 0.985) B 1.7 (1.4, 2.4) 4.9 (3.8, 7.0) 24.7 (26.5, 23.7) 0.048 (0.037, 0.068) 0.017 (0.014, 0.024) 0.279 0.996 (0.991, 0.998) C 3.2 (2.3, 5.2) 9.4 (6.7, 15.5) 28.6 (213.4, 26.3) 0.090 (0.065, 0.144) 0.032 (0.023, 0.052) 0.256 0.984 (0.951, 0.995) D 6.3 (4.5, 10.7) 19.0 (13.1, 34.4) 216.0 (225.6, 211.6) 0.174 (0.123, 0.296) 0.063 (0.045, 0.107) 0.251 0.941 (0.806, 0.984) E 6.2 (4.2, 11.3) 18.6 (12.5, 36.6) 215.7 (226.8, 211.1) 0.171 (0.118, 0.312) 0.062 (0.042, 0.113) 0.147 0.851 (0.504, 0.964) F 3.0 (2.1, 5.8) 8.8 (5.9, 17.5) 28.1 (214.9, 25.5) 0.084 (0.057, 0.162) 0.030 (0.021, 0.058) 0.217 0.981 (0.915, 0.996) G 3.9 (2.6, 7.5) 11.4 (7.6, 23.1) 210.3 (218.8, 27.1) 0.108 (0.073, 0.208) 0.039 (0.026, 0.075) 0.140 0.928 (0.709, 0.985) H 4.0 (2.7, 8.2) 11.8 (7.7, 25.6) 210.6 (220.4, 27.1) 0.112 (0.074, 0.228) 0.040 (0.027, 0.082) 0.150 0.932 (0.696, 0.988) J 5.2 (3.4, 11.5) 15.5 (9.7, 37.4) 213.4 (227.2, 28.9) 0.144 (0.093, 0.317) 0.052 (0.034, 0.115) 0.302 0.971 (0.839, 0.996) K1 2.6* (1.8, 4.6) 7.5 (5.2, 13.6) 27.0 (212.0, 24.9) 0.073 (0.051, 0.127) 0.026 (0.018, 0.046) 0.023 0.427 (20.205, 0.816) K2 2.9* (2.0, 5.1) 8.4 (5.8, 15.2) 27.8 (213.2, 25.5) 0.081 (0.056, 0.142) 0.029 (0.020, 0.051) 0.042 0.677 (0.158. 0.907) K3 6.1* (4.3, 10.7) 18.4 (12.5, 34.5) 215.6 (225.7, 211.1) 0.169 (0.118, 0.297) 0.061 (0.043, 0.107) 0.023 0.126 (20.491, 0.673) All† 4.1 (3.7, 4.7) 12.1 (10.8, 13.8) 210.8 (212.2, 29.7) 0.115 (0.103, 0.130) 0.041 (0.037, 0.047) 0.309 0.982 (0.976, 0.987)
Note.—Data in parentheses are lower and upper 95% CIs. sB = between-subject standard deviation, sW = within-subject standard deviation. Estimates of ADCmedian for two baseline examinations for
all tumors/organs are tabulated in Table E2 (online).
* CoVs from K1, K2, and K3 reproduced from Winfield et al (11) for completeness.
can be assessed by using a t test or similar); knowledge of measurement repeatability is also essential in power calculations to estimate the sample size necessary to detect a treatment effect in prospective cohort studies. Con-sidering changes in ADC after treat-ment, an increase of 12% or more in ADCmedian or ADCmean would be outside
the 95% LoA for all VOIs analyzed together; even considering the stud-ies with the poorest repeatability (ie, “worst-case” studies), an increase of 20% would have been outside the 95% LoA in all studies. A tumor exhibiting such a change in ADC after treatment would therefore be assessed as exhibit-ing a posttreatment effect outside the expected variation of repeated mea-surements, with 95% confidence, when measured with the same imaging unit by using the same imaging protocol, operator, and reader (ie, in repeatabil-ity conditions). This can be compared with posttreatment changes reported elsewhere: 23% and 24% increases in ADCmean in responding patients with
hepatic metastases from colorectal (3) and gastric (4) cancers, respectively;
and increases of 20% (ADCmean) and
22% (ADCmedian) in responding patients
with ovarian cancer treated with plati-num-based chemotherapy (8). In stud-ies reporting ADC changes in individual patients, as opposed to cohort changes, posttreatment increases in ADCmean of up to 100% were reported in patients with cervical cancer after chemoradio-therapy (5), and increases in ADCmean
of up to 50% were reported in patients with non–small cell lung cancer (9). Hence, the excellent repeatability dem-onstrated in the present analysis shows that ADC is sensitive to changes that are observed in clinical studies.
The significant difference between small, medium, and large VOIs shows that volume is an important factor in ADC repeatability. The weak correla-tion between the CoV and the median VOI volume in each study may reflect the range of tumor sizes within each study. The low CoV of 1.7% in study B may relate to the large tumors in that study. For future studies, the as-sumption of a CoV of 6.5% would be a for their respective metrics.
Addition-ally, most studies do not report CIs, which further hinders comparison.
The CoV and LoA, expressed as percentages, may be more intuitive for investigators to understand, compared with sW or RC expressed on a log scale. Although the ICC is listed in the QIBA framework for reporting repeatability, ICC may not be an appropriate metric for comparison between studies because results are scaled to the intersubject var-iability of the study cohort by sB; a low ICC may therefore reflect a homoge-neous cohort rather than poor repeat-ability (13). This is exemplified in study K, where ICCs were low (0.126–0.677 in studies K1, K2, and K3) despite the CoVs being comparable with those in other studies. Values of sB were an
or-der of magnitude lower than in studies A through J, reflecting the narrow range of ADC estimates in healthy organs in the tightly controlled volunteer cohort. These results strongly suggest that the ICC should not be used to compare ADC repeatability between studies.
Knowledge of ADC repeatability is essential for assessment of posttreat-ment changes in an individual patient (as opposed to cohort changes, which practice in oncology. The results
re-ported in this analysis are comparable with results from similar test-retest re-peatability studies, although compari-son with the literature is hindered by the variety of metrics that have been reported. From the published litera-ture, a study of malignant hepatic tu-mors (26) reported ICCs in the range of 0.898 to 0.933 and LoAs in the range of 18.8%–24.0% for ADCmean. A study in head-and-neck squamous cell carci-noma (27) reported an RC of 15% for ADCmean. A study of hepatocellular
car-cinoma (28) reported a CoV of 8.3% and a lower and upper LoA of 241.1% and 18.6%, respectively, for ADCmean. A study in abdominal organs in healthy volunteers (29) reported RCs between 6.4% and 9.6% for ADCmean. A study
of normal thyroid glands in healthy vol-unteers that used reduced-field-of-view DW MR imaging (30) and that also fol-lowed the QIBA framework reported an sw2 of 0.0147 3 1023mm2 sec21, an RC
of 0.3355 3 1023mm2 sec21, an ICC of 0.9273, and a CoV of 9.88%. Compar-ison between published studies is not straightforward because they report different repeatability metrics, but each result is similar to the present analysis
Figure 2
Figure 2: Graph shows CoVs of ADCmedian for each study (A through K3); all VOIs analyzed
together (All); and all tumor VOIs analyzed together (All tumors). Whiskers = 95% CIs for CoV
study commenced may suggest that ADC repeatability has not changed markedly over 10 years despite advances in MR imaging unit technology and imaging protocol methods during that time. This suggests that ADC repeatability assessments from older studies may in-form future studies, although this may not apply across substantial changes in hardware and/or methods, such as a change in field strength. Although this analysis considered only ADC repeat-ability, imaging protocol variations may also affect overall image quality, qualita-tive interpretation, and absolute values of ADC estimates, but these effects are outside the scope of this analysis. Reasons for variations in imaging pro-tocols include changes in hardware and software capabilities; advances in knowledge; requirements for imaging particular patient cohorts, such as the size of the field of view or the orienta-tion of the imaging plane; requirements of study sponsors; and requirements to match protocols in multicenter studies.
The apparent absence of a relation-ship between the CoV and the number of VOIs in the study (over the range of six to 26 VOIs) may suggest that an informative estimate of repeatability may be obtained from as few as six pa-tients, indicating that double-baseline examinations in relatively small subsets of patients may be used to efficiently Furthermore, larger tumors may be less
affected by motion or partial-volume effects, which may lead to better ADC repeatability. ADC repeatability in pe-diatric patients (study F) was not worse than that in other studies, despite the additional challenges associated with patient compliance in this group.
The apparent absence of a relation-ship between the CoV and the year the conservative choice. It is worthwhile to
note that the VOIs did not always en-compass the whole tumor: ROIs were drawn around the whole area of the tu-mor or healthy organ on at least three sections in all studies, but studies A, B, and E included considerably more sec-tions. Larger VOIs may provide more robust estimates of ADCmedian and
AD-Cmean because of larger sample sizes.
Figure 4
Figure 4: Bar graph shows CoVs of ADCmedian for small, medium, and large VOIs, all VOIs together, and all VOIs excluding study B. Error bars = 95% CIs of CoV estimates.
Figure 3
Figure 3: Plots of CoVs of ADCmedian versus, A, the year the study started, B, the number of VOIs (subjects
or lesions) in the study, and, C, the natural logarithm of the median volume of the VOIs in the study. Error
bars = 95% CIs of CoV estimates. In A and B, studies with identical start dates or numbers of VOIs have
References
1. Taouli B, Beer AJ, Chenevert T, et al. Dif-fusion-weighted imaging outside the brain: consensus statement from an ISMRM-spon-sored workshop. J Magn Reson Imaging 2016;44(3):521–540.
2. Dzik-Jurasz A, Domenig C, George M, et al. Diffusion MRI for prediction of response of rectal cancer to chemoradiation. Lancet 2002;360(9329):307–308.
3. Koh DM, Scurr E, Collins D, et al. Pre-dicting response of colorectal hepatic me-tastasis: value of pretreatment apparent diffusion coefficients. AJR Am J Roentgenol 2007;188(4):1001–1008.
4. Cui Y, Zhang XP, Sun YS, Tang L, Shen L. Ap-parent diffusion coefficient: potential imaging biomarker for prediction and early detection of response to chemotherapy in hepatic me-tastases. Radiology 2008;248(3):894–900.
5. Harry VN, Semple SI, Gilbert FJ, Parkin DE. Diffusion-weighted magnetic resonance imaging in the early detection of response to chemoradiation in cervical cancer. Gynecol Oncol 2008;111(2):213–220.
6. Sharma U, Danishad KK, Seenu V, Jagan-nathan NR. Longitudinal study of the as-sessment by MRI and diffusion-weighted imaging of tumor response in patients with locally advanced breast cancer undergoing neoadjuvant chemotherapy. NMR Biomed 2009;22(1):104–113.
7. Kim S, Loevner L, Quon H, et al. Diffusion-weighted magnetic resonance imaging for predicting and detecting early response to chemoradiation therapy of squamous cell carcinomas of the head and neck. Clin Can-cer Res 2009;15(3):986–994.
8. Kyriazi S, Collins DJ, Messiou C, et al. Met-astatic ovarian and primary peritoneal can-cer: assessing chemotherapy response with diffusion-weighted MR imaging—value of histogram analysis of apparent diffusion co-efficients. Radiology 2011;261(1):182–192.
9. Yabuuchi H, Hatakenaka M, Takayama K, et al. Non-small cell lung cancer: detection of early response to chemotherapy by using con-trast-enhanced dynamic and diffusion-weight-ed MR imaging. Radiology 2011;261(2):598– 604.
10. National Institute of Standards and Technol-ogy. Guidelines for Evaluating and Express-ing the Uncertainty of NIST Measurement Results. NIST technical note 1297. http:// www.nist.gov/pml/pubs/tn1297/index.cfm. Published 1994. Accessed June 15, 2016.
11. Winfield JM, Collins DJ, Priest AN, et al. A framework for optimization of
diffusion-repeatability in extracranial soft-tissue DW MR imaging studies across a wide range of tumor sites, sizes, patient populations, and imaging protocol variations. Estimates of ADC repeat-ability obtained from similar data can inform studies where double-baseline measurements are not possible, but a double-baseline format remains critical for future studies.
Acknowledgments: We thank Thor-sten Feiweier, PhD, and Berthold Kief-er, PhD, at Siemens Healthcare for pro-viding DW imaging prototype packages. For specific studies included in this work, we acknowledge funding from Cancer Research UK Biomarkers and Imaging Discovery and Develop-ment grants C7273/A12064 and C1353/A12762; Cancer Research UK and Engineering and Phys-ical Sciences Research Council (EPSRC) Cancer Imaging Programme at the Children’s Cancer and Leukaemia Group in association with the Medical Research Council and Department of Health (England) (C7809/A10342); an Experi-mental Cancer Medicine Centre Network award (joint initiative, Cancer Research UK and UK Department of Health) grants C51/A7401 and C12540/A15573; EPSRC Platform Grant EP/ H046526/1; Experimental Cancer Medicine Centre Network funding for support to early clinical trials; and the support of the National Institute for Health Research through the Can-cer Research Network. Some of the studies in this report were supported by AstraZeneca (spe-cifically including support for M.R.O.), Merck, Basilea, ArQule, and Genentech.
Disclosures of Conflicts of Interest: J.M.W. disclosed no relevant relationships. N.T. dis-closed no relevant relationships. M.R. disdis-closed no relevant relationships. K.M. disclosed no relevant relationships. N.P.J. disclosed no rel-evant relationships. M.G. disclosed no relrel-evant relationships. M.D.B. disclosed no relevant relationships. D.J.C. disclosed no relevant re-lationships. J.S.d.B. disclosed no relevant re-lationships. T.A.Y. Activities related to the pre-sent article: disclosed no relevant relationships. Activities not related to the present article: is a consultant for Clovis, Ignyta, and Pfizer; institution has grants or grants pending with AstraZeneca and Vertex; institution has re-ceived money for travel, accommodations, and/ or meeting expenses from AstraZeneca, GSK, and Vertex. Other relationships: disclosed no relevant relationships. N.M.d.S. disclosed no relevant relationships. S.J.D. disclosed no rel-evant relationships. D.M.K. disclosed no rele-vant relationships. M.O.L. Activities related to the present article: disclosed no relevant rela-tionships. Activities not related to the present article: has research agreements with Siemens Medical, Philips Medical, General Electric, and Elekta. Other relationships: disclosed no rele-vant relationships. C.M. disclosed no relerele-vant relationships. M.R.O. disclosed no relevant relationships.
estimate repeatability for larger stud-ies. Repeatability studies may thus be easily conducted if a center wishes to assess its DW MR imaging protocols. Inclusion of larger numbers of subjects, however, allows narrower CIs to be placed on estimated quantities and is advocated in clinical trials.
Repeatability estimates for
ADC-median and ADCmean do not apply to all
summary statistics; for example, other ADC histogram centiles may exhibit poorer repeatability (31). Alternative acquisition techniques (eg, motion compensation) would also require new repeatability studies. Furthermore, it is common practice to use data from pre-vious imaging studies to develop novel analysis methods, which require assess-ment of the repeatability of resulting metrics to evaluate their potential value in clinical practice. Double-baseline studies therefore provide an invaluable resource for future developments of analysis methods.
There were limitations to our analysis. First, all studies were per-formed at a single expert center, and senior members of staff with extensive experience of extracranial DW MR im-aging were involved in the development of imaging protocols for all studies. Sec-ond, all but one of the studies were per-formed with the same MR imaging unit, with the remaining study performed on a unit from the same manufacturer; the generality of our conclusions for test-retest measurements across MR imaging unit from other manufacturers remains to be tested. Third, only one study in healthy volunteers was in-cluded. Fourth, many of the studies were substudies that formed part of a larger clinical trial, and there may have been selection bias because of inclusion and exclusion criteria for these trials (eg, including patients with lesions .
2 cm or excluding patients who had difficulty lying still). Generalization to routine clinical practice remains to be tested, but the repeatability of ADC estimates in less-controlled situations might be expected to be worse than the repeatability reported here.
weighted MRI protocols for large field-of-view abdominal-pelvic imaging in multicen-ter studies. Med Phys 2016;43(1):95–110.
12. Raunig DL, McShane LM, Pennello G, et al. Quantitative imaging biomarkers: a review of statistical methods for technical perfor-mance assessment. Stat Methods Med Res 2015;24(1):27–67.
13. Sullivan DC, Obuchowski NA, Kessler LG, et al. Metrology standards for quantita-tive imaging biomarkers. Radiology 2015; 277(3):813–825.
14. Messiou C, Orton M, Ang JE, et al. Ad-vanced solid tumors treated with cediranib: comparison of dynamic contrast-enhanced MR imaging and CT as markers of vascular activity. Radiology 2012;265(2):426–436.
15. Orton MR, Messiou C, Collins D, et al. Dif-fusion-weighted MR imaging of metastatic abdominal and pelvic tumours is sensitive to early changes induced by a VEGF inhib-itor using alternative diffusion attenuation models. Eur Radiol 2016;26(5):1412–1419.
16. Yap TA, Yan L, Patnaik A, et al. Interrogat-ing two schedules of the AKT inhibitor MK-2206 in patients with advanced solid tumors incorporating novel pharmacodynamic and functional imaging biomarkers. Clin Cancer Res 2014;20(22):5672–5685.
17. Koh DM, Blackledge M, Collins DJ, et al. Reproducibility and changes in the apparent diffusion coefficients of solid tumours treat-ed with combretastatin A4 phosphate and bevacizumab in a two-centre phase I clinical trial. Eur Radiol 2009;19(11):2728–2738.
18. Yap TA, Olmos D, Brunetto AT, et al. Phase I trial of a selective c-MET inhibitor ARQ 197 incorporating proof of mechanism pharmacodynamic studies. J Clin Oncol 2011;29(10):1271–1279.
19. Miyazaki K, Jerome NP, Collins DJ, et al. Demonstration of the reproducibility of free-breathing diffusion-weighted MRI and dynamic contrast enhanced MRI in children with solid tumours: a pilot study. Eur Radiol 2015;25(9):2641–2650.
20. Bland JM, Altman DG. Statistical methods for assessing agreement between two methods of clinical measurement. Lancet 1986;1(8476):307–310.
21. Keene ON. The log transformation is spe-cial. Stat Med 1995;14(8):811–819.
22. Limpert E, Stahel WA, Abbt M. Log-normal distributions across the sciences: keys and clues. Bioscience 2001;51(5):341–352.
23. He X, Oyadiji SO. Application of coefficient of variation in reliability-based mechanical design and manufacture. J Mater Process Technol 2001;119(1 3):374–378.
24. Barnhart HX, Barboriak DP. Applications of the repeatability of quantitative im-aging biomarkers: a review of statistical analysis of repeat data sets. Transl Oncol 2009;2(4):231–235.
25. Shrout PE, Fleiss JL. Intraclass correlations: uses in assessing rater reliability. Psychol Bull 1979;86(2):420–428.
26. Kim SY, Lee SS, Park B, et al. Reproducibil-ity of measurement of apparent diffusion
co-efficients of malignant hepatic tumors: effect of DWI techniques and calculation methods. J Magn Reson Imaging 2012;36(5):1131– 1138.
27. Hoang JK, Choudhury KR, Chang J, Craci-unescu OI, Yoo DS, Brizel DM. Diffusion-weighted imaging for head and neck squamous cell carcinoma: quantifying re-peatability to understand early treatment-induced change. AJR Am J Roentgenol 2014;203(5):1104–1108.
28. Hectors SJ, Wagner M, Besa C, et al. Intra-voxel incoherent motion diffusion-weighted imaging of hepatocellular carcinoma: is there a correlation with flow and perfusion metrics obtained with dynamic contrast-enhanced MRI? J Magn Reson Imaging 2016;44(3):521–540.
29. Miquel ME, Scott AD, Macdougall ND, Boubertakh R, Bharwani N, Rockall AG. In vitro and in vivo repeatability of abdom-inal diffusion-weighted MRI. Br J Radiol 2012;85(1019):1507–1512.
30. Lu Y, Hatzoglou V, Banerjee S, et al. Re-peatability investigation of reduced field-of-view diffusion-weighted magnetic resonance imaging on thyroid glands. J Comput Assist Tomogr 2015;39(3):334–339.