ORIGINAL RESEARCH
Not All Age-Related White Matter
Hyperintensities Are the Same: A Magnetization
Transfer Imaging Study
A. Spilt R. Goekoop R.G.J. Westendorp G.J. Blauw A.J.M. de Craen M.A. van Buchem
PURPOSE:Our aim was to assess whether presumed histologic heterogeneity of age-related white matter hyperintensities (WMH) is reflected in quantitative magnetization transfer imaging measures.
MATERIALS AND METHODS: From a group of patients participating in a double-blind placebo-controlled multicenter study on the effect of pravastatin (PROSPER), we selected 56 subjects with WMH. WMH were classified as periventricular WMH (PVWMH) and deep WMH (DWMH). PVWMH were subclas-sified as irregular or smooth, depending on the aspect of their border. Signal intensity of WMH on T1-weighted images was scored as iso- or hypointense. The mean magnetization transfer ratio (MTR) value of different types of WMH was assessed and compared. As a control group, we selected 19 subjects with no or limited WMH.
RESULTS: Mean (SE) MTR of PVWMH (frontal, 31.2% [0.2%]; occipital, 32.2% [0.2%]) was lower than that of DWMH (33.7% [0.5%]). The mean MTR of frontal PVWMH (31.2% [0.2%]) was lower than that of occipital PVWMH (32.2% [0.2%]). Compared with occipital PVWMH, frontal PVWMH more often had a smooth lining (72% frontal versus 8% occipital) and an area with low signal intensity on T1-weighted images (76% frontal versus 35% occipital). MTR did not differ between smooth (31.1% [0.3%]) and irregular (31.6% [0.5%]) PVWMH.
CONCLUSION:Age-related WMH are heterogeneous, despite their similar appearance on T2-weighted images. By taking into account heterogeneity of age-related WMH, both in terms of etiology and in terms of severity of tissue destruction, one may obtain better understanding on the causes and consequences of these lesions.
W
hite matter hyperintensities (WMH) are striking abnor-malities that are often found on T2-weighted and fluid-attenuated inversion recovery (FLAIR) images in the elderly. WMH occur in about 30% of healthy subjects over 60 years of age, and their prevalence shows a steady rise with increasing age.1WMH can be divided in 2 subtypes according to their location: periventricular WMH (PVWMH) lining the lateral ventricles and the deep WMH (DWMH) in the remaining white matter. The most important and consistent risk factor for WMH is age; other established risk factors are female gen-der,2aortic atherosclerosis,3and elevated systolic blood pres-sure.4The correlation between WMH and cognitive function-ing is not yet clear. In some studies, correlations were found,5 whereas in other studies no such relationships were observed.6 In studies in which WMH are subclassified, different func-tional correlates have been found for PVWMH and DWMH. PVWMH are correlated with cognitive decline,7and DWMH are correlated with late-onset depression.8In correlative radiologic-pathologic studies, it has been demonstrated that WMH, though having a uniform appear-ance on MR imaging, are histologically heterogeneous. Braff-man et al9found WMH in the elderly to represent white mat-ter infarctions, white matmat-ter gliosis, or plaques of demyelination. On the basis of their radiologic appearance, Fazekas et al10distinguished PVWMH with a smooth
delinea-tion from those with an irregular border with the surrounding normal-appearing white matter. At autopsy, samples were taken from the periventricular white matter, and histologic findings were compared between PVMWH with irregular and those with smooth borders. Histologically, smoothly delin-eated periventricular lesions were characterized by sub-ependymal gliosis, demyelination, and discontinuation of the subependymal lining. These abnormalities were thought to be of nonischemic origin. On the other hand, irregular lesions showed microcystic infarcts and patchy rarefaction of myelin and were considered to be of ischemic origin.10
Despite histologic differences, all WMH look similar on con-ventional T2- and proton-attenuation weighted images as well as on FLAIR images. Magnetization transfer imaging (MTI) has been proved to reflect histologic differences better than conven-tional MR imaging techniques. Using MTI, one can assess the amount of magnetization transfer in tissues and quantitatively reflect it by a magnetization transfer ratio (MTR). Various histo-logic changes are not reflected similarly in MTR values. Edema and demyelination give rise to different MTR values,11and in the multiple sclerosis (MS) literature, good correlation has been found between the degree of demyelination and axonal loss on one hand and MTR measures on the other.12Age-related WMH were studied with MTI by Wong et al,13who found lower MTR values in PVWMH compared with normal white matter.13 Hanyu et al14found a correlation between the MTR values of age-related PVWMH and cognitive functioning.
In our experience, PVWMH are sometimes hypointense on T1-weighted images compared with the surrounding brain pa-renchyma. This is further radiologic evidence for the hypothesis that age-related WMH have different histologic substrates.
Our understanding of the origin and consequences of age-Received November 16, 2005; accepted after revision January 24, 2006.
From the Departments of Radiology (A.S., M.A.V.B.) and General Internal Medicine, Section of Gerontology and Geriatrics (R.G.J.W., G.J.B., A.J.M.D.C.), Leiden University Medical Center, Leiden, the Netherlands; and the Department of Neurology (R.G.), Alzheimer Center, VU University Medical Center, Amsterdam, the Netherlands.
related WMH is rather limited, partly because in imaging studies, all WMH have often been considered as similar le-sions. The aim of this study was to assess whether the psumed histologic heterogeneity of age-related WMH is re-flected in quantitative MTI measures. For that purpose, we compared MTR values in PVWMH and DWMH and com-pared MTR values between smooth and irregular PVWMH, between frontal and occipital PVWMH, and between PVWMH with normal or hypointense signal intensity on T1-weighted images.
Materials and Methods
Subjects
Subjects included in this study were selected from the first 184 partici-pants of the nested MR imaging substudy of the PROspective Study of Pravastatin in the Elderly at Risk (PROSPER), a double-blind placebo-controlled multicenter study on the effect of pravastatin on the occur-rence of cerebrovascular events in elderly people with cardiovascular risk factors.15Participants in the PROSPER study were recruited from the general population in either primary care settings or in trial centers in close proximity to each of the coordinating centers. Men and women were selected on the basis of age (70 – 82 years) and the presence of either pre-existing vascular disease or elevated risk of such disease because of smoking, hypertension, or diabetes. One exclusion criterion was poor cognitive function (Mini-Mental State Examination score,⬍24).
For further details of inclusion and exclusion criteria of the PROS-PER study, we refer to the article by Shepherd et al.15In these subjects, T2-weighted images were screened for the presence of WMH, defined as areas with increased signal intensity in the white matter compared with surrounding white matter. These areas were classified as WMH when they showed no mass effect and could not be related to types of pathology other than aspecific white matter hyperintensities. On the basis of this information, we created a study group with DWMH and/or PVWMH. Subjects with periventricular lesions⬍0.5 mm (measured with a caliper on hard copies of the T2-weighted images) were excluded from the analysis to limit including CSF in the regions of interest. DWMH needed to be larger than 5⫻5 pixels to be in-cluded, again to permit reliable quantitative region of interest analy-sis. Subjects with evidence of cerebral pathology besides aspecific WMH (such as infarction or tumors) on MR imaging were also ex-cluded. This exclusion resulted in a study group of 56 subjects with WMH. As a control group, 19 individuals were chosen from the same group of 184 participants of the PROSPER trial showing no WMH or a very limited load (Scheltens score of 1 or less; corresponding to ⬍5-mm thickness of PVWMH) of WMH16.
Image Acquisition
All imaging was performed on a 1.5T ACS-NT15 MR imaging system equipped with a Powertrak 6000 gradient system (Philips Medical Systems, Best, the Netherlands). All subjects were scanned on the same scanner in the same institution with the same software release by using the same pulse sequences.
We used the following T1-weighted spin-echo sequence: TR/ TE, 600/20 ms; matrix, 256; field of view (FOV), 220; scan percentage, 80%; and a rectangular FOV, 75%. Section thickness was 6 mm with an inter-section gap of 0.6 mm. A dual turbo spin-echo sequence (TR/TE1/TE2, 3000/27/120 ms; echo-train length, 10; 3-mm section thickness and no intersection gap; matrix size, 256; FOV, 220 mm; scan percentage, 80%) was used for WMH assessment. MTI was performed by using a 3D
gra-dient-echo pulse sequence (TR/TE, 106/6; flip angle, 12°; section thick-ness, 5 mm; matrix size, 256; FOV 220 mm; scan percentage, 50%). Two consecutive sets of axial images were acquired: The first was obtained without a radio-frequency saturation pulse, and the second, in combina-tion with a radio-frequency saturacombina-tion pulse (sinc-shaped, 1100 Hz downfield of the H2O resonance).11
Lesion Classification and Segmentation
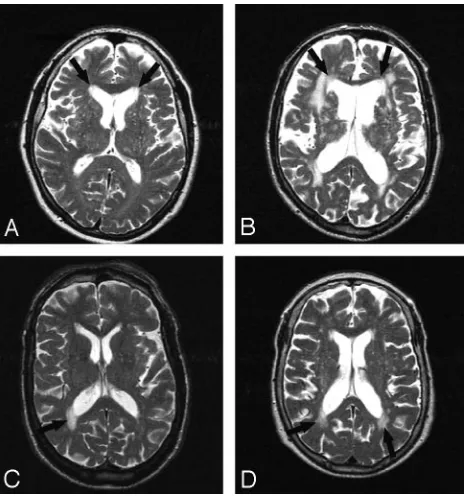
Periventricular lesions were detected and classified in irregular or smooth lesions (Fig 1), according to Fazekas et al.10“Smooth delin-eation” was defined as having a smooth outline with normal-appear-ing white matter in all sections shownormal-appear-ing the PVWMH. Left and right PVWMH were considered separately. The classification of PVWMH was assessed in a consensus meeting by 3 of the authors (M.A.V.B., R.G., and A.S.). This was done for occipital and frontal periventricular lesions separately by using T2-weighted, proton density (PD), and FLAIR images. On T1-weighted images, the presence of periventricu-lar hypointense lesions was assessed (Fig 2). They were defined as lesions with signal intensities on T1-weighted images lower than those of the surrounding white matter but higher than those of CSF. After categorizing, one rater identified on MTI, acquired with the saturation pulse (having a PD contrast), the lesions that were detected on the T2-weighted, PD, and FLAIR images (Fig 3). The rater subse-quently outlined manually the PVWMH and DWMH on these MTIs, in the study group, by using 3DVIEWNIX image processing software (Department of Radiology, Hospital of the University of Pennsylva-nia, Philadelphia, Pa). In the study and control group, normal-ap-pearing periventricular white matter and deep white matter were manually outlined. Deep normal-appearing white matter was out-lined in the semioval center by placing four 5⫻5 pixels in large re-gions of interest. The same rere-gions of interest were used for sampling periventricular normal-appearing white matter. No samples were taken from periventricular normal-appearing white matter if periventricular lesions were present. For all outlined regions, volume
Fig 1.Different types of PVWMH. Examples of frontal PVWMH with a smooth lining (A,
right and left) and frontal PVWMH with an irregular lining (B, right and left) and examples of occipital PVWMH with smooth (C, right) and irregular (D, right and left) linings.
BRAIN
ORIGINAL
[image:2.585.302.535.41.290.2]and mean MTR were calculated. MTR was defined as the percentage of change in signal intensity between the scans with and without the saturation pulse, as shown in the following equation11:
MTR⫽M0⫺Ms M0 共100%兲.
Analysis
Data are presented as means (SE). Means were compared withttests. Pvalues less than .05 were considered statistically significant.
Results
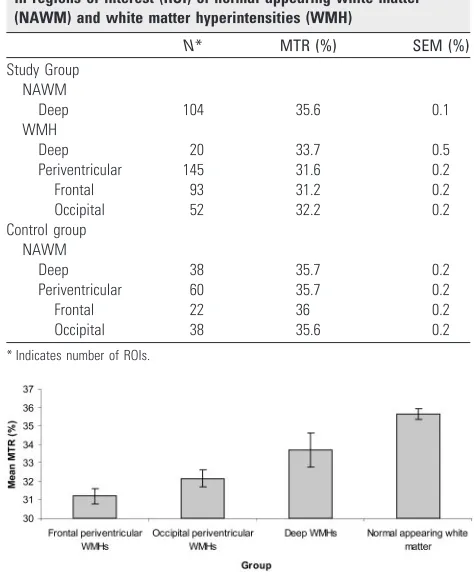
MTR values were calculated in WMH of 56 people. The aver-age aver-age of this group was 76 years (SD, 3 years) with 25 men and 31 women. In total, 93 frontal PVWMH, 52 occipital PVWMH, 20 DWMH, and 104 regions with normal-appear-ing white matter were outlined in the population with WMH. The control group included 19 subjects with an average age of 73 years (SD, 3 years) with 16 men and 3 women. In this group, 38 regions with normal-appearing deep white matter, 22 re-gions with normal-appearing frontal periventricular white matter, and 38 regions with occipital normal-appearing periventricular white matter were outlined. The MTR values of all regions are given in Table 1.
There was no difference between the normal-appearing white matter in the study group versus the control group (P⫽ .47). Within the control group, no differences in MTR were observed between deep and periventricular normal-appearing white matter (P⫽.35). In the control group, there was no difference between frontal and occipital periventricular nor-mal-appearing white matter (P⫽.46).
In the study group, a significant difference in mean (SE) MTR was found between DWMH and PVWMH (Fig 4). The MTR of DWMH (33.7% [0.5%]) was higher than that of PVWMH (frontal, 31.2% [0.2%];P⬍.001; occipital, 32.2% [0.2%]);P⬍.005). The mean MTR of frontal PVWMH was lower than that of occipital PVWMH (31.2% [0.2%] versus 32.2% [0.2%];P⬍.005).
A different proportion of frontal and occipital PVWMH was
found to be smooth. Sixty-seven of the 93 (72%) frontal PVWMH were smooth, whereas only 4 of the 52 (8%) occipital PVWMH were smooth. Mean (SE) MTR values of irregular and smooth PVWMH were not different. Irregular frontal PVWMH had an MTR of 31.6% (0.5%), whereas smooth frontal PVWMH had an MTR of 31.1% (0.3%, P ⫽ .21). Irregular occipital PVWMH had an MTR of 32.2% (0.2%), whereas smooth occip-ital PVWMH had an MTR of 32.1% (0.6%,P⫽.48).
The periventricular hypointensities on the T1-weighted
Fig 2.Example of a PVWMH with the characteristic high signal intensity on a T2-weighted image (A) with a low signal intensity on a T1-weighted image (B) (arrow).
Fig 3.Example of an image from the MTI protocol, obtained with saturation pulse (Ms) and having a proton-attenuation weighted contrast. It clearly shows occipital periventricular white
matter hyperintensities as well as deep white matter hyperintensities.
Fig 4.Mean MTRs with 95% confidence intervals for the 4 different regions in the subjects
[image:3.585.56.535.43.235.2]with white matter hyperintensities.
Table 1: Mean magnetization transfer ratio (MTR) values assessed in regions of interest (ROI) of normal-appearing white matter (NAWM) and white matter hyperintensities (WMH)
N* MTR (%) SEM (%)
Study Group NAWM
Deep 104 35.6 0.1
WMH
Deep 20 33.7 0.5
Periventricular 145 31.6 0.2
Frontal 93 31.2 0.2
Occipital 52 32.2 0.2
Control group NAWM
Deep 38 35.7 0.2
Periventricular 60 35.7 0.2
Frontal 22 36 0.2
Occipital 38 35.6 0.2
[image:3.585.298.535.301.589.2] [image:3.585.300.533.318.476.2]images all had smooth linings, regardless of the lining of the WMH on T2-weighted images. In Table 2, the proportions of PVWMH with a hypointense appearance on T1-weighted im-ages are shown. Most of the frontal PVWMH had a low signal intensity on T1-weighted images (76%), whereas only 35% of occipital PVWMH were hypointense on T1-weighted images. No correlation was observed between the presence of hypoin-tense signal intensity on T1-weighted and irregularity of the PVWMH on T2-weighted images. In PVWMH with a low signal intensity on T1-weighted images, the area with a hy-pointense signal intensity was invariably smaller than the area with a high signal intensity on T2-weighted images.
Discussion
Our study confirmed the finding by others,12-14,17-19 that the MTR of WMH is lower than the MTR of normal-appearing white matter in the elderly. In addition we found that the MTR of PVWMH is lower than the MTR of DWMH. Of interest are also the differences that we observed between the frontal PVWMH and occipital PVWMH: Frontal PVWMH showed a lower MTR than the occipital PVWMH, and they showed more often a smooth lining and an area with low signal intensity on T1-weighted images. However, we did not find a difference in MTR between smooth and irregular periventricular lesions.
In this study, MTR analysis demonstrated significant dif-ferences between PVWMH and DWMH: Lower MTR values were observed in PVWMH than in DWMH. This finding cor-roborates an observation by Tanabe et al,17who reported sim-ilar differences in MTR values between PVWMH and DWMH in subcortical ischemic vascular dementia. It could be argued that these findings are merely based on an artifact because of the inclusion of periventricular pixels with partial volume ef-fects of CSF in the periventricular region of interest, which might give rise to artificially low MTR values of PVWMH. However, if this had been the case, we would have also ex-pected a difference between the deep and periventricular nor-mal-appearing white matter in the control subjects, which was not observed. We rather believe that these MTR changes re-flect histologic differences between PVWMH and DWMH.
Two explanations for histologic differences between DWMH and PVWMH can be put forward. First, assuming that lesions in both locations are due to ischemia, we believe that the pathophys-iologic mechanisms that lead to ischemia in these locations are different and the severity of the resulting ischemia could be dif-ferent. The periventricular white matter is an arterial border zone that is supplied by long perforating arteries and is supposed to be particularly vulnerable to decreases in cerebral blood flow.20The
observed stronger association between cardiovascular risk factors with PVWMH compared with DWMH also suggests a difference in etiology.21Perfusion may be jeopardized by more mechanisms (drops in blood pressure, diffuse small vessel disease, atheroscle-rosis, or emboli) in the periventricular than in the deep white matter (atherosclerosis or emboli), resulting in a higher accumu-lation of ischemic damage in the periventricular location.
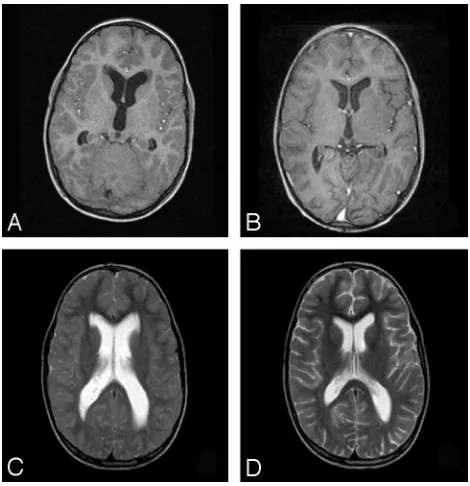
A second explanation for the observed differences in MTR between DWMH and PVWMH is not based on differences in vascularization between these brain areas but on differences in interstitial fluid dynamics. Because the brain is devoid of a lym-phatic system, interstitial fluid is transported through the extra-cellular space of the brain and through the ependymal lining to the ventricles.22,23Once the CSF is in the ventricles, the ependy-mal lining prevents the it from leaking into brain parenchyma. Because in elderly subjects with PVWMH, partial disappearance of the ependymal lining of the ventricles has been observed, it is conceivable that increased interstitial water resulting from ependymal discontinuation contributes to the high signal inten-sity on T2-weighted MR images.10The similarity between the distribution of age-related PVWMH and the reversible periven-tricular high signal intensity on T2-weighted images that can be observed in patients with obstructive hydrocephalus (Fig 5) sup-ports this hypothesis. The observed lower MTR values in PVWMH compared with DWMH could thus be based on the additional contribution of increased interstitial fluid concentra-tion on MTR values in the periventricular white matter, which is absent in the deep white matter.
Apart from differences in MTR values between DWMH and PVWMH, differences were also observed between frontal and occipital PVWMH, suggesting that there are also differences in histologic composition of PVWMH in these locations.
Differences between frontal and occipital PVWMH are also
Fig 5.Subject (8-year-old) with an obstructive hydrocephalus secondary to infratentorial mass
[image:4.585.300.535.41.284.2]before (A, T1-weighted image;C, T2-weighted image) and after placement of a ventriculoperi-toneal shunt (B, T1-weighted image;D, T2-weighted image). Notice the location and lining of the areas with increased signal intensity hypointensities on T1-weighted images in the periventricular white matter before drainage (A), disappearing after drainage (B).
Table 2: Magnetization transfer ratio (MTR) values of smooth and irregular lesions in frontal and occipital white matter
hyperintensities
Smooth Irregular
Frontal
N 76 17
MTR, % (SE) 31.1 (0.3) 31.6 (0.5)
No. hypointense on T1 (%) 57 (75%) 14 (82%)
Occipital
N 4 48
MTR, % (SE) 32.1 (0.6) 32.2 (0.2)
[image:4.585.54.285.78.174.2]suggested by the observation in our study that frontal PVWMH more often have a smooth lining than occipital PVWMH. This observation can be explained by what is known about the natural history of WMH. WMH in the periventricu-lar location occur early in life in almost every individual, often long before the appearance of DWMH. These periventricular lesions have a smooth lining and are most pronounced around the frontal horns and along the laterosuperior border of the bodies of the ventricles.24,25Later and in a more limited num-ber of individuals, the PVWMH in these locations may further grow, start showing an irregular border, and may confluence with concomitant DWMH; and PVWMH may also start being more pronounced in other locations, such as around the oc-cipital horns of the lateral ventricles.24,25These observations suggest that age-related PVWMH around the frontal and oc-cipital horns have different etiologies.
PVWMH in the frontal location more often showed low signal intensity on T1-weighted images than those located oc-cipitally, corroborating the suggestion of differences in tissue composition between these 2 locations based on our MTI analysis. These hypointense areas may partly be explained by more severe tissue destruction in this location, but the specific shape of the hypointense areas around the frontal horns and the relationship of the hypointense areas with the areas with high signal intensity on T2-weighted images rather suggest a different pathogenesis. The frontal hypointense areas invari-ably had the appearance of smoothly delineated frontal caps, irrespective of the delineation of the same lesions on T2-weighted images (Fig 2). Often the frontal hypointense areas were smaller than the hyperintense areas in the same location and in the same subjects (Fig 2). The morphologic similarity between the frontal periventricular hypointense lesions and the frontal hyperintense caps that are prevalent in most adults suggests that 1) these lesions are based on the same etiology and 2) this etiology differs from that of the occipital and larger irregular frontal PVWMH. On the basis of our observations, we hypothesize that frontal PVWMH are partly caused by in-creased interstitial fluid accumulation and partly by ischemia, whereas in the development of occipital and large irregular frontal PVWMH, there is less influence of interstitial fluid dynamics. This hypothesis is supported by observations from Fazekas et al,10who demonstrated that irregular PVWMH on MR imaging correlated with more severe ischemic changes on histology than smooth PVWMH did.
We found no difference in MTR values between smooth and irregular periventricular lesions. This seems contradictory to the observations from Fazekas et al,10who, on histology, found more ischemic tissue destruction in PVWMH with an irregular border on MR imaging than in smoothly delineated PVWMH. However, the larger contribution of increased in-terstitial fluid in smooth lesions may, in terms of MTR values, have compensated for the more severe tissue destruction in irregular lesions.
In conclusion, the findings in this study demonstrate that age-related WMH, despite their similar appearance on T2-weighted images, are heterogeneous. In most studies aimed at assessing the causes and the functional consequences of age-related WMH, all WMH are treated equally by assessing the total volume of WMH based on T2-weighted images. In
gen-eral, such studies show poor, if any, correlations between the load of WMH on one hand and measures of cognitive func-tioning or risk factors on the other. By taking into account the heterogeneity of age-related WMH, both in terms of etiology and in terms of severity of tissue destruction, one can obtain a better understanding of the causes and consequences of these lesions.
References
1. Meyer JS, Kawamura J, Terayama Y.White matter lesions in the elderly.J Neu-rol Sci1992;110:1–7
2. de Leeuw FE, de Groot JC, Achten E, et al.Prevalence of cerebral white matter lesions in elderly people: a population based magnetic resonance imaging study—The Rotterdam Scan Study.J Neurol Neurosurg Psychiatry2001;70:9 –14 3. de Leeuw FE, de Groot JC, Oudkerk M, et al.Aortic atherosclerosis at middle
age predicts cerebral white matter lesions in the elderly.Stroke2000;31:425–29 4. Longstreth WT Jr, Manolio TA, Arnold A, et al. Clinical correlates of white matter findings on cranial magnetic resonance imaging of 3301 elderly people: The Cardiovascular Health Study.Stroke1996;27:1274 – 82. Comment in: Stroke 1996;27:1269 –73, Stroke 1996;27:2338
5. Breteler MM, van Amerongen NM, van Swieten JC, et al.Cognitive correlates of ventricular enlargement and cerebral white matter lesions on magnetic reso-nance imaging: The Rotterdam Study.Stroke1994;25:1109 –15
6. Wahlund LO, Basun H, Almkvist O, et al.White matter hyperintensities in dementia: does it matter?Magn Reson Imaging1994;12:387–94
7. de Groot JC, de Leeuw FE, Oudkerk M, et al.Cerebral white matter lesions and cognitive function: The Rotterdam Scan Study.Ann Neurol2000;47:145–51 8. O’Brien JT, Ames D.White matter lesions in depression and Alzheimer’s
dis-ease.Br J Psychiatry1996;169:671
9. Braffman BH, Zimmerman RA, Trojanowski JQ, et al.Brain MR: pathologic
correlation with gross and histopathology. 2. Hyperintense white-matter foci in the elderly.AJR Am J Roentgenol1988;151:559 – 66
10. Fazekas F, Kleinert R, Offenbacher H, et al.Pathologic correlates of incidental MRI white matter signal hyperintensities.Neurology1993;43:1683– 89 11. Dousset V, Grossman RI, Ramer KN, et al.Experimental allergic
encephalo-myelitis and multiple sclerosis: lesion characterization with magnetization transfer imaging.Radiology1992;182:483–91
12. Mehta RC, Pike GB, Enzmann DR.Measure of magnetization transfer in mul-tiple sclerosis demyelinating plaques, white matter ischemic lesions, and edema.AJNR Am J Neuroradiol1996;17:1051–55
13. Wong KT, Grossman RI, Boorstein JM, et al.Magnetization transfer imaging of periventricular hyperintense white matter in the elderly.AJNR Am J Neurora-diol1995;16:253–58
14. Hanyu H, Asano T, Sakurai H, et al.Magnetization transfer ratio in cerebral white matter lesions of Binswanger’s disease.J Neurol Sci1999;166:85–90 15. Shepherd J, Blauw GJ, Murphy MB, et al.The design of a prospective study of
Pravastatin in the Elderly at Risk (PROSPER): PROSPER Study Group— Study of Pravastatin in the Elderly at Risk.Am J Cardiol1999;84:1192–97 16. Scheltens P, Barkhof F, Leys D, et al.A semiquantitative rating scale for the
assessment of signal hyperintensities on magnetic resonance imaging.J Neu-rol Sci1993;114:7–12
17. Tanabe JL, Ezekiel F, Jagust WJ, et al.Magnetization transfer ratio of white matter hyperintensities in subcortical ischemic vascular dementia.AJNR Am J Neuroradiol1999;20:839 – 44
18. Tanabe JL, Ezekiel F, Jagust WJ, et al.Volumetric method for evaluating mag-netization transfer ratio of tissue categories: application to areas of white mat-ter signal hyperintensity in the elderly.Radiology1997;204:570 –75 19. Rovaris M, Iannucci G, Cercignani M, et al.Age-related changes in
conven-tional, magnetization transfer, and diffusion-tensor MR imaging findings: study with whole-brain tissue histogram analysis.Radiology2003;227:731–38. Epub 2003 Apr 17
20. Pantoni L, Garcia JH.Pathogenesis of leukoaraiosis: a review.Stroke1997;28: 652–59
21. Ylikoski A, Erkinjuntti T, Raininko R, et al.White matter hyperintensities on MRI in the neurologically nondiseased elderly: analysis of cohorts of consec-utive subjects aged 55 to 85 years living at home.Stroke1995;26:1171–77 22. Sze G, De Armond SJ, Brant ZM, et al.Foci of MRI signal (pseudo lesions)
anterior to the frontal horns: histologic correlations of a normal finding.AJR Am J Roentgenol1986;147:331–37
23. Pollay M, Curl F.Secretion of cerebrospinal fluid by the ventricular ependyma of the rabbit.Am J Physiol1967;213:1031–38
24. Wen W, Sachdev P.The topography of white matter hyperintensities on brain MRI in healthy 60- to 64-year-old individuals.Neuroimage2004;22:144 –54 25. Scheltens P, Barkhof F, Leys D, et al.Histopathologic correlates of white matter