Journal of Chemical and Pharmaceutical Research, 2017, 9(1):230-236
Research Article
CODEN(USA) : JCPRC5
ISSN : 0975-7384
230
Sensitive, Direct and Rapid Methods for Determination of Flurbiprofen
through Ion Associate Complexes and First Derivative Spectrophotometry
Islam MI Moustafa
1*, Enas A Amer
2and Hanaa S Hanafy
21 Chemistry Department, Benha University, Benha, Egypt
2
National Organization for Drug Control and Research ((NODCR,) Giza, Egypt _____________________________________________________________________________
ABSTRACT
Two simple, accurate and sensitive methods for determination of flurbiprofen (FLUR) in pure and dosage forms had been developed and validated. The first method is based on the formation of ion-associate complexes between the drug and arsenazo I (ARS I) or Bromophenol blue (BPB) to give colored products maximally absorbed at 556 and 635 nm with the two reagents, respectively. The optimum conditions that favor the formation of the ion pair complexes were extensively studied and optimized. Beer's law was obeyed up to 90.20 and 100.85 µgmL-1 while
Ringboom concentration ranges are 1.89 - 89.20 and 2.00 – 96.60 µgmL-1 for the two reagents, respectively. In the
second method, first derivative (1DD) spectrophotometry was used for the determination where it was found that
FLUR exhibits maximum amplitude at 259 nm. At this wavelength, linear relation between concentration and
absorbance was obtained with high correlation coefficients. The methods were validated, in terms of accuracy and precision and the results are satisfactory. The proposed methods were successfully applied for determination of FLUR in pure and pharmaceutical dosage form without interference from the common excipients. The results obtained by the proposed methods were comparable with those obtained by reference methods.
Keywords: Flurbiprofen; Spectrophotometric determination; Ion pair complexes; First derivative spectroscopy
_____________________________________________________________________________
INTRODUCTION
Flurbiprofenis a propionic acid derivative of non-steroidal anti-inflammatory drugs (NSAIDs). It is used in muscle skeletal and joint disorders such as ankylosing spondylitis, osteoarthritis and rheumatoid arthritis, in soft-tissue disorders such as sprains and strains. It is also used as lozenges in the symptomatic relief of sore throat. [1].Throughout the literature survey, a variety of techniques was found to be used for micro determination of flurbiprofen either in pure form or in pharmaceutical formulation. The most famous of these techniques are spectrophotometry [2-6], HPLC [7-14] and gas chromatography [15]. These techniques require sophisticated instruments and expensive reagents, besides being time consuming. On the other hand, the formation of ion-associate complexes between organic dyes and drugs is one of the techniques available for determination of pharmaceutical compounds [16-20]. Also derivative spectrophotometry offers greater selectivity than do normal spectrophotometry in the simultaneous determination of two or more compounds without previous chemical separation. The principles and advantages of this technique had been described by O'Haver and Green [21].
231
EXPERIMENTAL SECTION
Instrumentation
All absorption measurements were made by using Shimadzu UV1601 double beam UV-VIS spectrophotometer loaded with Shimadzu UV-Prob Version 1.10 software and interfaced to Pentium-4 computer and Canon-810 laser printer to record the spectra and perform subsequent calculations of their derivatives (NODCR). The spectrophotometric measurements were made at wavelength range 200-600 nm using 10 mm quartz matched cells. The first derivative spectra were derived in the wavelength range (220-350) nm using Δλ = 8 nm and scaling factor = 10. An Orion research model 601A/digital Ionalyzer pH meter was used to check the pH of the universal buffer solution.
Materials and reagents
All the chemicals used were of analytical reagent grade and the solvents were of spectroscopic grade.
Flurbiprofen was obtained from El-Kahira Company, Shoupra Elkhyma City, Egypt. The purity of the samples was found to be 99.8% on the dried bases according to the United States Pharmacopoeia (USP) method [22] and was used as received. Its IUPAC name is 2-Fluoro-α-methyl[1,1-biphenyl]-4-acetic acid ;2-(2-fluoro-4-bi- phenylyl) propionic acid;3-fluoro-4-phenylhydatropic acid; ) C15H13FO2, Molecular Weight: 244.261 g/mol). It has the
following structural formula:
The analytical reagents used in the present work are arsenazo I (ARZ I) and Bromophenol blue (BPB). They have the following structural formula:
Arsenazo I (ARZ I) Bromophenol blue (BPB)
Stock solutions of 1.0x10⁻³ M of the reagents were prepared by dissolving the accurate weight of each reagent initially in 25 mL ethanol followed by dilution in 100 mL measuring flask by ethanol to the mark. Universal buffer solutions of different pH values (2.04-12.06) were prepared as recommended earlier [23].
Pharmaceutical dosage forms
Froben gel (Kahira pharma – Egypt; under license of Abbott international lab –Pakistan) labeled to contain 5gm flurbiprofen in 100gm gel.
Drug standard solutions
A stock solutions containing (0.1 mg/mL) of flurbiprofen was prepared by dissolving 10 mg of the pure sample in the least amount of ethanol and completed to 100 mL with the same solvent. Working standard solutions (10.0 μg/mL) were prepared by subsequent dilution. For molar ratio and continuous variation methods 10-3 M solution of
the drug was prepared by dissolving 0.0244 g in least amount of ethanol then complete to 100 mL in measuring flask.
232
Construction of the calibration graphs Method (I)
In a 10 mL volumetric flask, a series of solutions containing 2.0 mL of 1x10⁻³ M reagent solution followed by 3.0 mL universal buffer solution at the optimum pH and different concentrations of the drug (in µg/mL) were mixed well. The mixture was diluted to volume with ethanol and the solution was allowed to stand for 5.0 min at room temperature (25±2oC). The absorbance was measured at the recommended wavelength using a reagent blank similarly prepared without drug. By plotting the concentration of the drug (in µg/mL) against the absorbance, straight line is obtained (up to certain limit) after which deviation from Beer's law was observed.
Method (II)
Different aliquots from FLUR standard stock solution (0.1- 5.0 mL) was transferred into series of 10 ml volumetric flasks to obtain solutions over concentration rang of (1-50 μg/mL). The first derivative spectra were recorded and the amplitude measured at 259 nm. The derivative amplitudes were then plotted against the final concentrations to get the calibration graphs. Alternatively, the corresponding regression equation was derived.
Preparation of pharmaceutical dosage form samples
An accurately weighed quantity of gel equivalent to 5 mg of FLUR was transferred into 100 mL calibrated flask, 60 mL of ethanol was added and shaken for 10 minutes. The volume was then made to the mark, mixed well and filtered using a Whatman No. 42 filter paper. The first 10 mL portion of the filtrate was discarded and the filtrate was diluted appropriately to get 50 µg/mL of FLUR for assay by the recommended method
Stoichiometric Ratio
The stoichiometry of the ion–associate complexes was studied using the mole ratio and continuous variation methods [24, 25].
RESULTS AND DISCUSSION
Method (I): Determination of flurbiprofen through ion associate complex
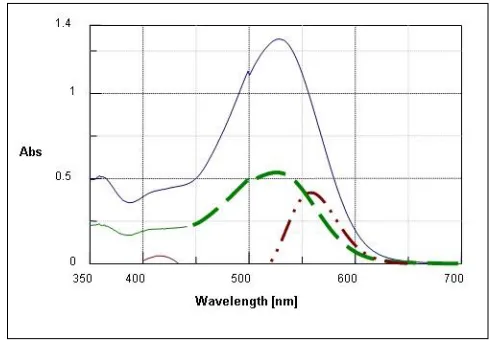
[image:3.612.182.427.452.622.2]Preliminary investigations revealed that flurbiprofen reacts directly with each of the reagents (ARS I) and (BPB) to produce soluble ion-associate complexes exhibiting absorption maxima at 556 and 635 nm, respectively. The presence of the ion-associate complexes was supported by the bathochromic shift observed from 545 and 605 nm for the reagents to 556 and 635 nm for the complexes, respectively. Representative example for FLUR-ARZ I ion pair is shown in Figure 1.
Figure 1: Difference curves of FLUR – ARZ I complex, A; (_): ARZ I vs buffer, B; (--) ARZ I + FLUR vs buffer and C; (_.._) Mixture B vs A
233
Effect of pH
Universal buffer solutions of pH range 2.04 -12.06 was found to give the best results rather than other types of buffer solutions (acetate or Theil buffer). The optimum pH values giving maximum absorbance for FLUR with ARZ I and BPB are 10.50 and 9.23, respectively. Moreover, the optimum volume of buffer solution was examined and found to be 3.0 ml in a total volume of 10 ml.
Effect of time and temperature
Sample solutions containing flurbiprofen and the blank were treated identically with the reagent and buffer for different times and at different temperatures. The results obtained indicated that the ion-associate complexes were formed instantaneously at room temperature (25 ± 2oC). The absorption spectra and color intensities were not altered by varying the temperature up to 40oC, above which the absorbance decreased by 10 % for every increase of 5.0oC. The absorbance remained stable for about 15 hrs then it began to decrease slowly.
Effect of reagent concentration
When various concentrations of (ARSI) and (BPB) were added to a fixed concentration of flurbiprofen at 10µg/mL, 2.0 mL of 10-3 M reagent solution was found to be enough to develop the color to full intensity.
Stoichiometric ratio
The stoichiometry of the ion-associate complexes was investigated at the optimum pH values by applying the mole ratio and continuous variation methods. The results indicated the formation of a 1:1 ion-associate complex. The logarithmic stability constants were calculated from the spectral data of both methods [26, 27] and are shown in Table (1).
Method (II): Determination of flurbiprofen using first derivative spectrophotometric method:
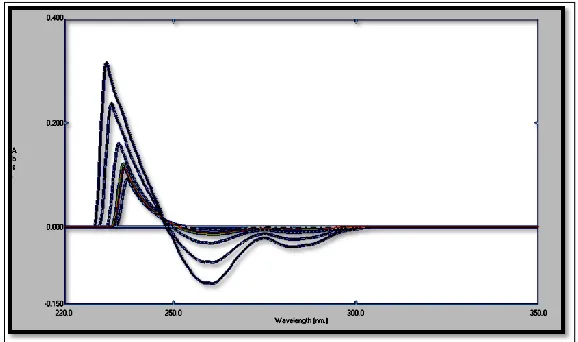
[image:4.612.161.450.371.542.2]The first derivative studies of FLUR showed that it can be determined by measuring the amplitude at 259 nm (Figure 2).
Figure 2: The first derivative absorption spectra ofFLUR at different concentrations (1DD 259).
METHOD VALIDATION
Linearity and Range
234
The calibration graphs for determination of (FLUR) by the first derivative spectrophotometric method was constructed by plotting the derivative amplitudes versus the concentrations as shown in Figures 2. The graphs were found to be rectilinear over the concentration ranges cited in Table 1.
The methods were validated by the high close to one correlation coefficient in each case for FLUR and the value of intercept on ordinate which is close to zero.
Accuracy
Different concentrations within the linearity range of (FLUR) were analyzed in bulk powder also by adding a previously analyzed test solution with additional drug standard solution to check the accuracy of the results. The recovered concentrations ± SD were calculated using the regression equation.
Precision
[image:5.612.155.457.266.503.2]The intraday (repeatability) and inter-day (intermediate) precisions were assessed using three concentrations and three replicates of each concentration. The relative standard deviations were found to be very small indicating reasonable repeatability and intermediate precision of the proposed methods. The data are cited in table (2).
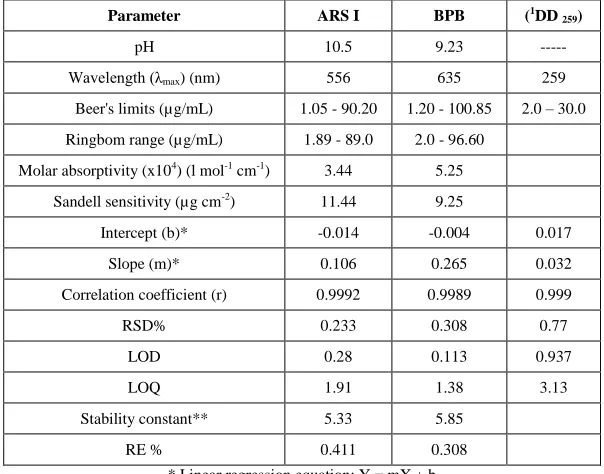
Table 1: Spectrophotometric cumulative data for (FLUR) using (ARS I), (BPB) and (1DD 259) methods
Parameter ARS I BPB (1DD 259)
pH 10.5 9.23 ---
Wavelength (λmax) (nm) 556 635 259
Beer's limits (µg/mL) 1.05 - 90.20 1.20 - 100.85 2.0 – 30.0
Ringbom range (µg/mL) 1.89 - 89.0 2.0 - 96.60
Molar absorptivity (x104) (l mol-1 cm-1) 3.44 5.25
Sandell sensitivity (µg cm-2) 11.44 9.25
Intercept (b)* -0.014 -0.004 0.017
Slope (m)* 0.106 0.265 0.032
Correlation coefficient (r) 0.9992 0.9989 0.999
RSD% 0.233 0.308 0.77
LOD 0.28 0.113 0.937
LOQ 1.91 1.38 3.13
Stability constant** 5.33 5.85
RE % 0.411 0.308
* Linear regression equation: Y = mX + b
** Mean value of Molar ratio and continuous variation methods.
Specificity
The specificity of each of the proposed method was investigated by observing any interference encountered from common dosage form excipients. It was shown that these compounds did not interfere with the results of the proposed methods.
LOD & LOQ
The minimum concentration level at which the analyte can be reliable detected (LOD) and quantified (LOQ) for the two proposed methods were calculated as 3σ/S and 10σ/S, respectively, where S is the slope of the calibration curves and σ is the standard deviation of the response and displayed in Table (1).
Application
235
Table 2: Intra- and inter-day validation for the determination of FLUR using the proposed methods
Parametes ARS I BPB (1DD259)
Intra-day %
Recovery 99.55 99.68 100.09
99.96 101.36 101.21
100.34 99.56 99.23
Mean 99.95 100.2 100.18
S.D. 0.39 1 0.99
%RSD 0.39 1 0.99
%Error 0.16 0.41 0.4
Inter-day 1st day 100.1 102.06 100.31
2nd day 100.9 101.59 98.99
3rd day 101.98 100.66 100.11
Mean 100.99 101.43 99.8
S.D. 0.94 0.71 0.71
%RSD 0.94 0.7 0.71
%Error 0.38 0.29 0.29
[image:6.612.187.428.107.345.2]The results of the proposed methods were compared with those obtained by the reference method [22] using point hypothesis test. The student t- and values (Table 4) at 95% confidence level did not exceed the tabulated t- and F-value, confirming no significant difference between the performance of the proposed methods and the reference methods.
Table 3: Determination of FLUR in Froben gel using the first derivative spectrophotometric method (1D259)
Recovery% Found; (ug/mL) 1D259 Taken; (μg/mL)
Added GEL Added GEL Total GEL Added GEL
98.41 100.69 4.92 10.07 0.499 0.341 5 10
101.58 101.93 10.16 10.19 0.671 0.345 10 10
100.46 101 20.09 10.1 0.987 0.342 20 10
101.56 99.81 15.23 4.99 0.667 0.178 15 5
99.1 100.81 4.96 20.16 0.824 0.665 5 20
100.22 100.85 Mean
1.4 0.76 S.D
Table 4: Statistical analysis for determination of FLUR using ARS I, BPBand (1D 259) methods compared with the reference method [22]
Formulation
Proposed methods Reference method
Recovery % RSD % t-value F-value Recovery % RSD %
Froben gel
ARS I 99.94 0.36 1.11 1.31
100.21 0.36
BPB 99.95 0.55 0.9 2.34
(1DD 259) 100.85 0.76 3.01 4.57
[image:6.612.165.453.424.567.2]236
CONCLUSIONS
Two spectrophotometric methods for the determination of flurbiprofen were proposed. The first method depends on the formation of highly colored ion pair complexes with two chromophoric reagents; arsinazo I and Bromophenol blue which absorb maximally at 556 and 635 nm, respectively. The second method utilizes the first derivative spectroscopy for the determination. The proposed methods are simple, less time consuming, and sensitive. They were advantageous over other reported visible spectrophotometric methods with respect to their higher sensitivity and selectivity. No interference from associated excipients, additives, and degradation products was observed. The proposed methods can be used for routine analysis and quality control laboratories for the determination of flurbiprofen in raw materials and in pharmaceutical formulation.
CONCLUSION
In the present research, synthesized som of tetrazole derivatives may be the derivatives have biological activity towards the bacteria (postive or nagtive).
ACKNOWLEDGEMENT
The authors are grateful to Prof. Dr. M. E. Moustafa, Chemistry Department, Faculty of Science, Benha University, Benha Egypt for his continuous support in completing this work.
REFERENCES
[1] J Reynolds, Martindale. The Complete Drug Reference, 38th Edition, volume A., The pharmaceutical press, London , UK , 2011; 65,66 and 83.
[2] C Sajeev; PR Jadhav; D RaviShankar; RN Saha, Analytica Chimica Acta, 2009, 463(2), 207–217.
[3] V Mandava; B Rao; B C K Reddy; T SrinivasaRao; K M Ch AppaRao, Rasayan J.Chem, 2009, 2(2), 418-420. [4] V Adepu; KE Vnagoji; V Girijasastry. Int. J. Pharm Pharm. Sci.,2014, 6(9), 31-38.
[5] PK Pradhan; PN Rajput; N Kumar; B Joshi; U M Upadhyay. Int. J. Pharm. Sci. Rev. Res., 2014, 27(2), 96-99. [6] G Patel; P Chauhan; S Shah. J. Chem. Pharm. Res., 2014, 6(7), 96-101.
[7] SC Chi; H Kim; SC Lee, Anal Lett, 1944, 27(2), 377-389.
[8] SA Korhammer; A Bernreuther; J Fresenius. Anal Chem, 1996, 354(2), 131-135.
[9] D Louden; A Handley; S Taylor; E Lenz; S Miller; ID Wilson; A Sage. Anal Chem, 2000, 72(16), 3922-3926. [10] B K Patel; J Valentova; A J Hutt. Chromatographia, 2002, 55(3), 135-142.
[11] Y Sun; K Takaba; H Kido; MN Nakashima; K Nakashima, J. Pharm Biomed Anal, 2003, 30(5),1611–1619. [12] HI Lee; CI Choi; JY Byeon; JE Lee; SY Park; YH Kim; SH Kim; YJ Lee; CG Jang; SY Lee. J. Chromatogr,
2014, 971(1), 58-63.
[13] MD Bubba; L Checchini; L Ciofi, S Furlanetto; L Lepri. Biomed Chromatogr, 2014, 28(1), 127-134. [14] B Yilmaz; AF Erdem. J Chromatogr Sci, 2015, 53 (9): 1443-1448.
[15] B Yilmaz, H Sahin; V Akba; AF Erdem. J AOAC Int, 2014, 97(4): 1061-1066.
[16] H Kanazawa; A Tsubayashi; Y Nagata; Y Matsushima; C Mori; J Kizu; M Higaki. J Chromatogr, 2002, 948(1-2), 303-308.
[17] HI Shin; BH Kim; HS Chang; CH Park; CI Kim, Korean J Urol, 2011, 52(4), 265-268. [18] L Wang; Y Tang; Y Liu. J. Pharm. Anal, 2011, 1(1):51–56.
[19] P Venkatesan; VS Janardhanan; C Muralidharan; K Valliappan. Acta Chim Slov, 2012, 59(2), 242-248.
[20] M Hirosawa; T Sambe; N Uchida Xiao; P Lee; K Sato; S Kobayashi. Jap J. Ophthalmol, 2015, 59 (5), 364-371. [21] TC O'Haver; GL Green. Anal Chem. 1976, 48, 312-318.
[22] "The United States Pharmacopoeia ", 38th Edition, the national formulary United States pharmacopoeia, 2015, 2, 3572, 3573.
[23] HTS Britton. Hydrogen ions 4th Edition, Chapman and Hal (london), 1952, 364. [24] JH Yoe, AL Jones. Ind. Eng. Chem. J. Anal., 16th Edition; 1944, 111.
[25] P Job; C Rend. Anal. Chem., 1935, 6, 97.
237 [28] A Ringbom. Anal. Chem., 1993, 115,332-339.
![Table 4: Statistical analysis for determination of FLUR using ARS I, BPB and (1D 259) methods compared with the reference method [22]](https://thumb-us.123doks.com/thumbv2/123dok_us/8737605.889115/6.612.187.428.107.345/table-statistical-analysis-determination-methods-compared-reference-method.webp)
