1879
A PRIORITY-QUEUE DOMINATED AND DELAY-ENERGY
GUARANTEED MAC SUPERFRAME STRUCTURE FOR
WBANS TO DEAL WITH VARIOUS EMERGENCY TRAFFIC
OF PILGRIMS DURING HAJJ: AN ANALYTICAL MODEL
1SHAH MURTAZA RASHID AL MASUD, 2ASMIDAR ABU BAKAR, 3SALMAN YUSSOF,
1College of Graduate Studies, Universiti Tenaga Nasional, Jalan IKRAM-UNITEN, 43000, Kajang,
Selangor, Malaysia
2College of Computer Science and Information Technology, Universiti Tenaga Nasional, Jalan
IKRAM-UNITEN, 43000, Kajang, Selangor, Malaysia
3 College of Computer Science and Information Technology, Universiti Tenaga Nasional, Jalan
IKRAM-UNITEN, 43000, Kajang, Selangor, Malaysia
E-mail: 1[email protected], 2[email protected], 3[email protected]
ABSTRACT
In recent times, IEEE 802.1.5.6 based wireless body sensor networks (WBANs) are being deployed in various medical and healthcare centres for providing quick and real-time health facilities among the patients. Every year during Hajj several millions of pilgrims gather together at overcrowded ritual site ‘Kaaba’ and its surrounding places in Makkah. Ensuring the best healthcare facilities and services among the pilgrims those who are suffering from a variety of critical conditions and illness including chronic diseases; sudden illness, trauma and accidents at the congested environment is a demanding research issue because lack of proper healthcare facilities may worsen the life of pilgrims. In our research, we define the emergency medical data into five different criticality levels which are aperiodic or random and require immediate transmission to the healthcare stations for further actions. Based on the data criticality level a priority-criticality index table and a modified superframe structure for medium access control (MAC) protocol are developed. Critical or emergency data is obligatory to be transmitted ahead of other non-critical traffic as delay in its transmission may impede human life. But, the problem may occur when more than one emergency data from different sensors aggregate to the coordinator for further transmission to the healthcare stations through exclusive access period-EAP slot of MAC. For smooth, low delay and energy efficient data transmission we propose an analytical method based on M/M/1 priority-queuing system to provide delay-energy guaranteed QoS at MAC level in our research. The Poisson distribution process has been used to analyse the packet arrival rate of each queue. In this research, M/M/1 queuing system is used to investigate five different priority-queues for five emergency traffics. Emergency traffic is defined and prioritised through the criticality level of pilgrims’ medical problems as being generated by body sensors. From the mathematical analysis, we have seen that the medical data with the highest priority should not stay at the queue for a long time which decreases the queuing delay at the system. Moreover, for energy efficient data transmission, we propose a sleep/idle-wakeup mechanism that reduces unnecessary energy consumption. An extensive analytical approach through mathematical model shows the better performance comparing to the default IEEE 802.15.6 standard which assumes the sensor nodes are awake all the time. Finally, in our future research, extensive experimental work will be conducted to corroborate and validate the analytical findings which are mentioned in the discussion and future work section.
Keywords: Hajj, Pilgrims, Emergency, WBANs MAC Superframe, Low Delay, Energy Efficiency, Queue
1. INTRODUCTION AND BACKGROUND
STUDY
Every year during Hajj millions of pilgrims aggregate at Makkah to perform Hajj where many of them suffer from various acute, chronic and infectious diseases along with sudden illness and trauma due to harsh and rough weather and crowdy
1880 respiratory problem is the main cause of pilgrims’ hospital admission followed by heat stroke, diabetes, heart disease, trauma and other health-related problems. In addition, during Hajj, heart disease is the main cause of pilgrims’ death followed by other health-related issues including respiratory problems, heat attack, trauma and accidents. Hence based on our research [3], the criticality level of an emergency condition of pilgrims is identified by the vital signs, threshold values and data rate of related health problem. The severity or criticality level of emergency medical issue during Hajj is then categorised and prioritised into five types which are as follows.
1) Heart rate (HR); 2) Respiratory rate (RR); 3) Body temperature (BT);
4) High or low blood pressure (BP); 5) Blood sugar (BS) respectively Criticality level is denoted by the certain emergency level of medical traffic. For the better understanding of emergency traffic, its criticality and priority level we further classified and prioritised the level of criticality of emergency traffic into the following five types [3].
1) Extremely high critical traffic 2) Very high critical traffic 3) High critical traffic 4) Moderately critical traffic 5) Low critical traffic
As we know from IEEE802.15.6 Standard for WBANs [4], physiological and biological parameters of the human body can be changed in general when human behaviour and surrounding environment changes which can lead to a different medical situation, for example, emergency, on-demand and normal. Thus, WBANs traffics are divided into three major classes which are emergency (EM) traffic, on-demand (OD) traffic, and normal (NR) traffic. According to our study, emergency traffic is aperiodic and non-emergency traffic is periodic in nature, moreover, emergency traffic should transmit ahead of any other normal or on-demand traffic because the delay in transmission of emergency traffic may trouble the health condition of the patient. It is observed that the different channel access phases of the superframe structure of MAC protocol are accountable to
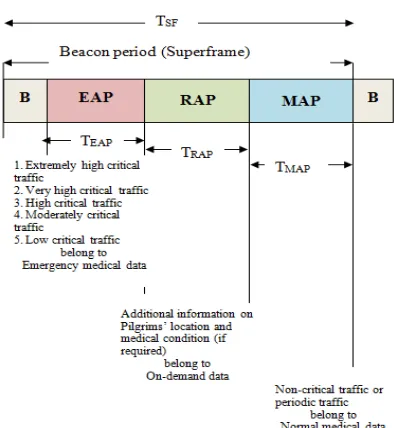
[image:2.612.324.521.266.480.2]transmit different traffic. According to IEEE802.15.6 standard exclusive access phase-EAP is responsible for transmission of emergency traffic. But, the problem like data transmission delay may occur when at the same time more than one emergency traffic aggregate at the hub for further processing. To overcome this emergency circumstance in our previous work [3] a modified superframe structure for MAC is proposed for simplicity of the system as illustrated in Figure 1, we also developed and proposed a priority-criticality index table as presented in Table 1. The proposed model is liable to transmit data considering low delay and low energy consumption.
Figure 1: The proposed superframe structure
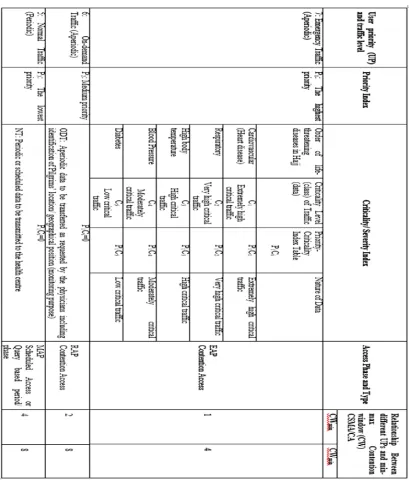
The life critical emergency data must get the highest priority to gain access to the data transmission channel. In our research, user priorities are differentiated and classified into three types, but criticality levels of emergency traffic are distinguished into five categories, and the priority-criticality index table is defined accordingly for quick data transmission and allocation of slots without collision and retransmission of packets as depicted in Table I. Proposed emergency handling mechanism is presented in Figure 2 below.
1881
Table I: Priority-criticality index table and allocation of access phases for the proposed MAC superframe
delay-energy guaranteed QoS at MAC level in our research. The Poisson distribution process has been used to analyse the packet arrival rate of each queue. In this research, M/M/1 queuing system is used to investigate five different priority-queues for five emergency traffics. Emergency traffic is defined and prioritised
1882
Figure 2: Traffic management mechanism of the proposed superframe structure
For smooth, low delay and energy efficient data transmission we recommend an analytical method based on M/M/1 priority-queuing system to provide delay-energy guaranteed QoS at MAC level in our research. The Poisson distribution process has been used to analyse the packet arrival rate of each queue. In this research, M/M/1 queuing system is used to investigate five different priority-queues for five emergency traffics. Emergency traffic is defined and prioritised through the criticality level of pilgrims’ medical problems as being generated by body sensors. From the mathematical analysis, we have seen that the medical data with the highest priority should not stay at the queue for a long time which decreases the queuing delay at the system. Moreover, for energy efficient data transmission, we propose a sleep/idle-wakeup mechanism that reduces unnecessary energy consumption.
The rest of the paper is organized as follows. Section II describes wireless body area networks (WBANs) operation. Section III presents traffic scheduling, and low delay-energy domain of emergency traffic at QoS dominated MAC superframe structure. Finally, in section IV, the paper is concluded with future work.
2. WIRELESS BODY AREA NETWORKS
(WBANS) OPERATION
In our proposed superframe structure coordinator of the network allocates data transmission slot based on user priority levels which rely on different data types, criticality level of emergency data, and priority-criticality index table as presented in previous Table I.
Priority levels of different data values are generated by the nodes, except the on-demand data which defined by the coordinator. Moreover, criticality levels of emergency data and non-critical normal medical data are specified by the coordinator. The priority-criticality index table is also determined by the coordinator, and then slots are assigned accordingly for transmitting data to the healthcare stations.
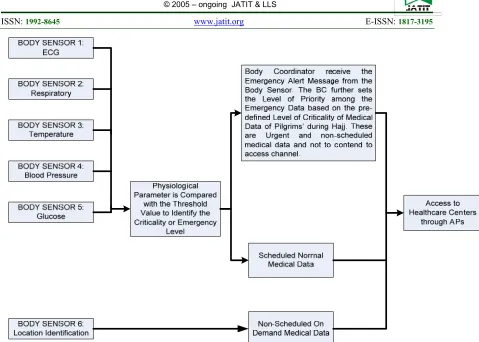
The overall working procedures consist of several steps:
[image:4.612.89.568.57.399.2]1883 per coordinator request) and normal. Finally, the sensors send data to the coordinator. Step 2: Coordinator decides pilgrims’ emergency status as five different categories: extremely high critical traffic or data, very high critical traffic, high critical traffic, moderately critical traffic, and low critical traffic. Traffic scheduling, path selection, data transmission, and slot/ phase of superframe selection processes are handled considering pilgrims real-time health condition.
Step 3: Data is transferred to the access point (AP)
Step 4: AP transfers the data to healthcare stations
Step 5: Pilgrims’ request is to be handled at healthcare stations and provide necessary services to them. Furthermore, medical stores the medical data for further use.
Step 6: Doctors/ nurses can request for extra medical or non-medical (location) data if needed.
Step 7: If required pilgrims will be able to access their health database to see their health status.
In general, a body coordinator transmits the sensed data to the healthcare stations. In WBANs, naturally, multiple emergency events may occur at a time; thus, specifying the roles of each node which is either sensor or hub is urgent to schedule according to the level of criticality and priority. To handle the emergency properly the function of each node is portrayed in detail.
2.1 The Function of the Sensor Node
The sensor node compares the sensed data with the pre-defined threshold value to define whether the event is an emergency or not. An emergency event occurs when data exceeds the pre-defined threshold value. Otherwise, data belong to either on-demand (aperiodic) or normal (periodic). The data transmission rate is higher in emergency condition than on-demand or normal state.
Once data types are defined, data are delivered to the coordinator where emergency data is further classified and send to healthcare stations through dedicated time slot based on the criticality level.
Figure 3 illustrates the algorithm that depicts the role of the sensor node to identify different types of data, e.g. emergency, on-demand or normal.
2.2 The Function of the Coordinator Node
The body coordinator keeps the priority-criticality index table as presented in Table 1 which is used to classify and categorise pilgrims’ physiological conditions in an emergency situation based on the received data from the sensor nodes. Emergency traffic is classified upon receiving from the sensors into different critical levels based on index table, and when necessary a copy of information containing criticality level of any packet is added to the priority-criticality index table.
Figure 3: The role of the sensor node to identify different types of data
1884 criticality index table to classify the emergency data and express the following resolutions or determinations.
A. If any data come from body sensor node which is categorized as emergency and if there is a corresponding level of criticality or emergency type already stored before in the criticality index table, then the status of that particular data traffic will be designated and counted as critical.
In our research we further define and assess the level of criticality of data as follows:
a) If the priority-criticality index value P1Ci=P1C1 (the highest criticality level
because higher the index value higher the criticality level of emergency data) then the traffic is nominated as extremely high critical traffic.
b) If the priority-criticality index value P1Ci=P1C2 then the traffic is nominated as
very high critical traffic.
c) If the priority-criticality index value P1Ci=P1C3 then the traffic is nominated as
high critical traffic.
d) If the priority-criticality index value P1Ci=P1C4 then the traffic is nominated as
moderately critical traffic.
e) And if the priority-criticality index value P1Ci=P1C5 then the traffic is nominated as
low critical traffic.
B. Moreover, if data come from the sensor node (let’s consider as on-demand traffic) categorised as on-demand traffic and no corresponding data or type is found in the priority-criticality index table, then the health status will be designated as non-critical but an emergency. In addition, since the corresponding traffic is designated as emergency, the coordinator, if required, may include a copy of the data related to the new findings to its criticality index table for improvement of the criticality index before transmitting it.
C. Finally, if data traffic comes from the sensor or source node which is categorised as normal, then the pilgrims’ health status will be nominated normal.
Figure 4 illustrates the algorithm that depicts the functions of the coordinator node to identify pilgrims’ health status considering both emergency and non-emergency situations.
Figure 4: The role of the coordinator node to identify different criticality level of emergency traffic and pilgrims’ health status in both emergency and
non-emergency situations
2.3 Slot Allocation for Different Traffic Levels in MAC Superframe Structure
A slot allocation mechanism for MAC superframe has been proposed by the type of data according to threshold values from body sensor nodes and order of criticality level of both emergency and non-emergency data traffic form body coordinator node at different pilgrims’ health conditions. For this, the emergency traffic is categorised into five types based on the criticality level of vital signs as presented in Table I.
If the coordinator at any moment receives emergency data from a sensor node, then the coordinator assigns the exclusive access phase-EAP slot to this particular traffic based on the CSMA/CA procedure. Here there is no need of finding the criticality level of that emergency traffic because it has been received from the single sensor node.
1885 emergency data shall proceed to slot EAP based on their level of criticality and queuing process.
Traffic queuing process at data transmission scheme of MAC level is illustrated in Figure 5. Emergency traffic is life-threatening, so excessive delay and data loss can worsen the health condition or life of the pilgrims. Hence it is vital to ensure no data loss and minimal delay in emergency traffic.
In our research, we assume, on-demand and normal traffic are not life-threatening. RAP phase is allocated for on-demand traffics which are contention based, since this traffic is considered as not life-threatening so low to
moderate contention for the slots are acceptable when there is multiple such traffics.
For normal traffic, a scheduled access phase MAP is assigned so that data traffic can access the channel at a specific period. Again, since this traffic is assumed as not life-threatening so low to moderate contention and delay for the slots are acceptable when there is multiple such traffics.
3. TRAFFIC SCHEDULING AND LOW
DELAY-ENERGY DOMAIN OF
EMERGENCY TRAFFIC AT QOS
DOMINATED MAC SUPERFRAME
[image:7.612.93.537.178.527.2]STRUCTURE
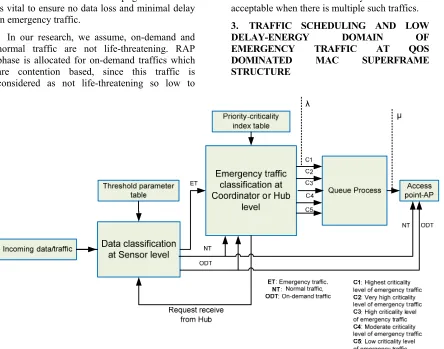
Figure 5: Queuing process of emergency data transmission at MAC superframe level
Sensor node interface goes through three states which are an active or busy state, sleep state or inactive state and wake-up state.
During data transmission, the sensor nodes stay in an active state, otherwise, go to sleep. Nodes wake-up if any emergency event occurs or any request arrives from the coordinator node. As explained earlier, the sensor node generates three types of data including emergency, normal and on-demand (if needed). Emergency and normal data are generated by the threshold value. As soon as the emergency event occurs, the data is generated, and the node forwards the data to the coordinator for further processing. If there is no emergency event occurs then the normal data will be generated at a specific
period and will send to the coordinator. In contrary, on-demand traffic will be generated when there is a request from the coordinator and send to back to coordinator immediately. It seems that any sensor node at any given time generates only one type of data; hence there is no possibility of transmission delay at sensor level when it transmits any data to the coordinator.
1886 level in the process. We assume coordinator holds bigger battery so there will be no energy issue at the coordinator level. Hence, we found at node level there is energy efficiency issue, but there is no delay issue; on the contrary at coordinator level, there is no energy efficiency issue, but there is a possibility of queuing delay.
3.1 Delay analysis
Let us consider data arrival rate of class ‘i' incoming traffic based on criticality level of data is
λi, and the number of departure packets per unit
time which is called service rate is denoted by μ. Upon arrival, data are distributed among the queues as presented in Figure 5.
We propose an analytical model which is based on M/M/1 queuing system to provide delay-energy guaranteed QoS at the MAC level in our research. We used a Poisson distribution process to analyze the packet arrival rate of each queue. In this research, we analyze and deploy M/M/1 queuing system for five different queues. Our proposed queue model is used to detect different classes of emergency traffic based on their criticality level of WBANs sensors being generated from different events.
To the best of our understanding and knowledge, here for the very first time, we present queue model for analysing the delay of multi criticality level of traffic using M/M/1 queuing system. Traffic criticality levels in our research belong to the set of the emergency data class, as input in WBANs. Some preliminary research [5-6] considered an emergency condition not considering multiple criticality levels in the traffic. It is to be noted that, the arrival process of critical data arrives at the process is generally the main stochastic driver to a queue system, and thus they have earned great academic interest during the last decade. Understanding the arrival process is crucial in communication systems, as arrival characteristics influence capacity requirements. Medical data arrivals require supporting real-time data delivery and thus the inter-arrival times are independent and randomly exponentially distributed in nature. For getting a basic understanding of the queuing process, we would like to refer the readers to [7-14].
Here, we describe the analytical model considering the delay of critical data at coordinator and low energy consumption of sensor nodes during communication. The
notations we are going to use are mentioned below regarding five critical traffic for our research.
λp1c1, λp1c2, λp1c3, λp1c4, and λp1c5 are the arrival
rates of extremely high critical traffic, very high critical traffic, high critical traffic, moderate critical traffic, and low critical traffic respectively.
μp1c1, μp1c2, μp1c3, μp1c4, and μp1c5are the service
rates of extremely high critical traffic, very high critical traffic, high critical traffic, moderate critical traffic, and low critical traffic respectively.
The number of incoming packets per unit time at the coordinator which is called as data arrival rate is denoted by 𝜆.
Therefore, 𝜆 ∑ 𝜆𝑝1𝑐𝑖 = λp1c1+ λp1c2
+λp1c3 +λp1c4 +λp1c5 …………. ……….………… (1)
μ is denoted as the number of packets that depart per unit of time.
Hence, μ = μp1c1 + μp1c2 + μp1c3 + μp1c4 + μp1c5 ………...…… (2)
Non-preemptive priority is considered for the proposed 𝑀/𝑀/1 queue model. The traffic intensity level at the coordinator is defined by 𝜌; where the traffic intensity is defined by the individual priority for any designated critical traffic which is defined as below.
𝜌 = 𝜌p1c1 +𝜌p1c2 𝜌p1c3 𝜌p1c4 𝜌p1c5
……….. (3)
The probability that extremely high critical traffic/packets find other traffics (including very high critical traffic, high critical traffic, moderate critical traffic, and low critical traffic) in service is equal to the ratio of the time spent at body coordinator on the very high critical traffic, high critical traffic, moderate critical traffic, and low critical traffics. These are calculated as mentioned below.
𝜌p1c2 =
𝜌p1c3 =
𝜌p1c4 =
1887 As we find, in a queuing system, Little’s law [9] gives a significant estimation or relationship about the queue behaviour. From the law, a basis for forecasting the performance of the individual queues is defined by
E(𝑛) = 𝜆*(𝑡) ……….….. (4)
Here, according to our research, E(𝑛) is the average number of critical data in the queue, 𝜆
is the critical data/traffic arrival rate, and (𝑡) is the average delay time per critical traffic in the queuing system. The Little’s law for the extremely critical data traffic is
E(𝑛p1c1) = 𝜆p1c1 *(𝑡p1c1)
………..…….….(5)
Extremely high critical data processing: Extremely high critical data has the highest priority with short queuing delay, and sometimes this is negligible. But, when extremely critical data arrive at the coordinator, and there is already some traffic with other levels of criticality in service then arrived extremely critical data 𝐸(𝑛p1c1 ) needs in quthe eue because they are already buffer in the queue along with the traffic those are already in service. The packets that are not delay guaranteed may face a longer queuing delay. The mean delay of such a packet depends on (𝑛) and the packets in service. In fact, E(𝑛p1c1 ) and 𝐸(𝑡p1c1) can also be
determined directly, i.e. without knowing the probabilities Pn, by combining Little's law and
the PASTA property. Based on PASTA we know that the average number of customers in the system seen by an arriving customer equals
E(𝑛p1c1 ) and each of them has a (residual)
service time with mean . The customer further has to wait for its own service time. Hence, the average or mean time for extremely critical data can be formulated as:
E(𝑡p1c1) = 𝜌 𝜌
𝜌
𝜌 ………..(
6)
E(𝑡p1c1) = 𝜌
𝜌 …….…..(7)
Very high critical data processing: The very high critical packet has to wait for the extremely high packet in service and very high critical
packets in the queue. The delay can be calculated as follows:
E(𝑡p1c2) = 𝜌 𝜌
𝜌 ... (8)
E(𝑡p1c2) = 𝜌
𝜌 …(9)
High critical data processing: The high critical packet has to wait for the extremely high packet and very high critical packets in service and high critical packets in the queue. The delay can be calculated as follows:
E(𝑡p1c3) = 𝜌
𝜌 ………...(10)
E(𝑡p1c3) =
𝜌 𝜌
𝜌 ……….(11)
Moderate critical data processing: The moderate critical data has to wait for the extremely high packet, very high critical packet and high critical packet in service and moderate critical packets in the queue. The delay can be calculated as follows:
E(𝑡p1c4) =
𝜌 ………...(12)
E(𝑡p1c4) =
𝜌 𝜌 𝜌 𝜌 …(13)
Low critical data processing: The low critical data has to wait for the extremely high packet, very high critical packet, high critical packet and moderate critical data in service and low critical packets in the queue. The delay can be calculated as follows:
E(𝑡p1c5) =
𝜌 𝜌 𝜌
𝜌 𝜌 ………... (14)
E(𝑡p1c5) =
1888 The average queuing delay of the arrived packet depends on the packets that are already buffered in the queue plus the packets in service. From our analytical interpretation as presented with equations 6-15 show the queuing delay for the five different criticality levels of traffic. It is observed that traffic with the extremely high criticality level preserves the highest priority and need not to stay at queue thus it requires less time to be transmitted. Thus the queuing delay for the highest criticality level of traffic will be much less than traffic with very high criticality level, high criticality level, moderately critical level and low critical level respectively.
3.2 Analysis of Energy Consumption
Energy efficiency is one of the key measurement parameters for a reliable and efficient MAC protocol design. The energy consumption is based on the activity of a node. To minimise energy consumption, the idle and wakeup states play a vital role [15-16].
To ensure less energy consumption in our research effort, we assume sensor node interface goes through two states which are active state and an inactive state, where total energy consumption, energy consumption at active state and energy consumption at inactive state are denoted by 𝐸 ,
𝐸 and 𝐸 respectively. The total energy consumption can be obtained from the following expression:
𝐸 𝐸 𝐸 ………..
(16)
Energy is a function of time and power. In an idle or sleep state, the nodes consume less energy compared to the wake-up state.
The active state is normally denoted as busy state, and the inactive state is normally denoted as idle state or sleep state. Hence, the inactive state can be presented as,
𝐸 𝐸 ………...
(17)
𝐸 𝑇 x 𝑃 ………..
(18)
𝑇 is an idle or sleep time duration, 𝑃
is the power consumed in a sleep state.
Energy consumption during active state is comprised of the wake-up state which is normally a transition state from inactive or sleep state to busy state along with the energy consumed by the node during data transmission and the energy consumption during data receiving or sensing by the node. Energy consumption due to the wake-up node, and during data transmission and receiving or sensing data are denoted by, 𝐸 , 𝐸 , and 𝐸
respectively. Hence, the energy consumption during active state can be formulated as:
𝐸 𝐸 𝐸 𝐸 …………
(19)
𝐸 𝑇 x 𝑃 ……….
(20)
𝑇 is wakeup time duration, 𝑃 is
the power consumed in a wakeup state.
𝐸 𝑇 x 𝑃 ………....
(21)
𝑇 is data transmission time duration, 𝑃 is
the power consumed in a data transmission state.
𝐸 𝑇 x 𝑃 ………...
(22)
𝑇 is receiving or sensing data time duration, 𝑃 is the power consumed in a data receiving or
sensing state.
Now, the value obtained from equations (17) and (19) we put into the equation (16) and find the total energy consumption by a node from the following expression.
𝐸 𝐸 𝐸 𝐸 𝐸 ….
(23)
Hence, the total energy consumed is further can be expressed by:
𝐸 𝑇 x 𝑃 𝑇 x 𝑃
𝑇 x 𝑃 𝑇 x 𝑃 ……….…
(24)
1889 nodes remain in an active state during data transmission to the coordinator. Otherwise they go to sleep. Wake-up if there is any emergency event happens or receive any request from coordinator to support. Data communication in WBANs nodes should perform in low power level to reduce energy consumption and to reduce the electromagnetic absorption rate in the body, which could result in health problems related to WBAN’s use. We also assume coordinator holds bigger battery so there will be no energy issue at the coordinator level. The total amount of energy being consumed by each sensor node during transmission of data from the sensor to coordinator should be low to ensure less energy consumption in WBAN.
4. CONCLUSION AND FUTURE WORK
Emergency traffic should transmit ahead of any other normal or on-demand traffic because the delay in transmission of emergency traffic may trouble the health condition of the patient. It is observed that the different channel access phases of the MAC superframe structure are accountable to transmit various types of traffic. According to IEEE802.15.6 standard exclusive access phase-EAP is responsible for transmission of emergency traffic. But, the problem may occur when at the same time more than one emergency traffic aggregate at the hub for further processing. To overcome this emergency circumstance in our research a modified superframe structure for MAC is proposed along with a priority-criticality index table.
In recent times, IEEE 802.1.5.6 based wireless body sensor networks (WBANs) are being deployed in various medical and healthcare centres for providing quick and real-time health facilities among the patients. For smooth, low delay and energy efficient data transmission we propose an analytical model based on M/M/1 queuing system to provide delay-energy guaranteed MAC in our research. We have used the Poisson distribution process to analyse the packet arrival rate of each queue. In this research, we investigate five different queues by M/M/1 queuing system for five different levels of emergency traffic based on their level of criticality. From the mathematical analysis, we have seen that the medical data with the highest priority should not stay at the queue for a long time which decreases the queuing delay at the system. Moreover, for energy efficient data transmission, we propose a sleep/idle-wakeup mechanism that reduces unnecessary energy
consumption. An extensive analytical approach through mathematical model shows the better performance comparing to the default IEEE 802.15.6 standard which assumes the sensor nodes are awake all the time.
Finally, in our future research, extensive experimental work will be conducted to corroborate and validate the analytical findings as presented in the previous section.
Conflict of Interest
The authors declare that they have no competing interests.
Ethical Approval
This article does not contain any studies with human participants performed by any of the authors.
REFRENCES
[1] Shah Murtaza Rashid Al Masud, Asmidar Abu Bakar, Salman Yussof, ‘Determining the Types of Diseases and Emergency Issues in Pilgrims During Hajj: A Literature Review’ International Journal of Advanced
Computer Science and
Applications(IJACSA), 7(10), 2016 [2] Shah Murtaza Rashid Al Masud, Asmidar
Abu Bakar, Salman Yussof, ‘A Systematic Review of Technological Issues In Monitoring Pilgrims’ Health During Hajj: Current State, Challenges And Future Directions’, JATIT, 96(7), 2018
[3] Shah Murtaza Rashid Al Masud, Asmidar Abu Bakar, Salman Yussof, ‘Developing a Priority-Criticality Index Table for Transmission of Various Emergency Traffic of Pilgrims through EAP of Modified IEEE802.15.6 MAC Superframe’ Indonesian Journal of Electrical Engineering and Computer Science (IJEECS), 14(2), 2019
[4] IEEE Standard for Local and metropolitan area networks Part 15.6: Wireless Body Area Networks," IEEE Standard 802.15.6-2012, vol., no., pp.1-271, Feb. 29 2012 [5] Kateretse, Cecile, Ga-Won Lee, and
1890
networks." Wireless personal communications 71.2 (2013): 909-927.
[6] Ambigavathi, M., and D. Sridharan. "Traffic Priority Based Channel Assignment Technique for Critical Data Transmission in Wireless Body Area Network." Journal of medical systems42.11 (2018): 206.
[7] S. Rashwand and J. Miˇsi´c, “Performance evaluation of IEEE 802.15.6 under non-saturation condition,” in Proceedings of the 54th Annual IEEE Global Telecommunications Conference: ”Energizing Global Communications (GLOBECOM ’11), pp. 1–6, Houston, Tex, USA, December 2011.
[8] A. Papoulis and S. U. Pillai, Probability, Random Variables and Stochastic Processes, McGraw-Hill, 4th edition, 2002.
[9] J. D. C. Little and S. C. Graves, “‘Little’s Law’ , Massachusetts Institute of Technology,” in Building Intuition: Insights From Basic Operations Management Models and Principles, D. Chhajed and T. J. Lowe, Eds., Springer Science, BusinessMedia, LLC, 2008.
[10] E. Glenbe, G. Pujolle and J. C. C. Nelson, “Introduction to Queuing Networks”, John Wiley and Sons 2 edition, 1998.
[11] B. Sunjay. “An Introduction to Queuing Systems”, 2002, Springer
[12] M. Šeda, P. Ošmera and J. Petrucha. “Systems with Queueing and their Simulation,” in Proc.World Academy of Science, Engineering and Technology, 2011, pp. 865-871
[13] D. Gross and C. M. Harris, "Fundamentals of Queueing theory," vol. Fourth Edition, pp. 211-213, 1998.
[14] Sheldon M. Ross, ‘’Introduction to Probability Models”, Eleventh Edition, Elsevier
[15] M. U. Hossain, M. Kalyan, M. R. Rana, and M. O. Rahman, “Multidimensional traffic adaptive energy-efficient MAC protocol for wireless body area networks,” in Proc. 9th IEEE Int. Forum Strategic Technol., Oct. 2014, pp. 161–165.