Generation of Dual-Beam Patterns using Particle Swarm
Optimization
S. Krishna Veni
Research Scholar,
Dept. of Electronics and Communication Engineering,
College of Engineering (A), Andhra University, Visakhapatnam,
Andhra Pradesh, India-530 003
G.S.N. Raju
Professor,
Dept. of Electronics and Communication Engineering,
College of Engineering (A), Andhra University, Visakhapatnam,
Andhra Pradesh, India-530 003
ABSTRACT
Certain antenna applications require Dual- beam radiation patterns. The main aim of this paper is to generate the dual- beam radiation patterns from an array of isotropic radiators with single pre- fixed amplitude distribution. The optimal phase excitations are obtained using Particle Swarm Optimization. Beam 1 is a highly directive pencil beam and beam 2 is a ramp pattern. It is well known that, ramp patterns are generated from waveform generators. Interestingly, an attempt has been made to produce these patterns from radiating elements in the form of far- field radiation pattern. Ramp shape radiation patterns do not exhibit symmetry about the bore sight direction. All the excitation phases are set to 0c to generate pencil beam and are varied in the range of -πto +π to generate ramp pattern. Results obtained for different scan angles are presented.
Keywords
Dual- beam, Pencil beam, Ramp pattern, Phase only synthesis, Particle Swarm Optimization.
1.
INTRODUCTION
In many applications such as cellular communication, radar and radio astronomy, antennas with multiple radiation patterns are required. Antenna arrays are capable of radiating multiple radiation patterns with a fixed amplitude distribution by reconfiguring the phase distribution. It is well known that, the design and implementation of feeding network becomes simpler if the element excitations corresponding to different patterns differ only in phase than if they also differ in amplitude. Generally multiple radiation patterns are obtained by switching between the excitation phases distributions of the elements while sharing common amplitude distribution. Sufficient literature is available to produce narrow beams from arrays. However, very few papers are available to obtain multiple beams. Classical synthesis methods like Woodward Lawson and Fourier transform methods generate shaped beams using amplitude only control [1-2]. But it is not suitable for fast scanning applications. The sector beams can be produced from arrays using either amplitude control or phase control. Continuously controllable phase only beam shaping with pre- fixed amplitude distribution was described by Ajay Chakraborty et al. [3] using energy relations concept. In [4], G.K. Mahanti et al. presented second degree polynomial approximated phase- only synthesis to determine the phase excitations. In this method, using real coded genetic algorithm two different types of symmetric sector beams are generated from equally spaced linear antenna array. The method uses an array of isotropic radiators with single pre-
fixed cosine on pedestal amplitude distribution. This gives a regular shape to the phase distribution of the radiators. Regular shape phase distributions result in simpler feed network design compared to irregular shape phase distributions.
Phase only synthesis of transmit beam with pre- fixed amplitude distribution was reported by Ares et al. [5]. In his approach modified Woodward- Lawson method is used. Bucci et al. [6] proposed a method of projection to synthesize reconfigurable array antennas that can produce asymmetrical pencil and flat- top beam patterns using common amplitude and varying phase distributions. Baskar et al. [7] developed a novel mixed- integer optimization for the optimal design of reconfigurable antenna with quantized phase excitations. The method uses 6-bit discrete phase shifters and continuous amplitude distribution to generate dual-beam pattern using genetic algorithm and better results were obtained. Design of phase differentiated multiple pattern antenna arrays has been reported by Diaz et al. [8] based on simulated annealing optimization technique.
Banana Basu et al. [9] proposed a method using modified PSO, for beam reconfiguration of linear array of mutually coupled parallel half wave length dipole antennas with real excitation voltage amplitude distribution. Two different beam pairs (pencil/pencil beam pair and pencil/flat-top beam pair) are generated with common amplitude distribution through switching. Azevedo [10] introduced new technique that synthesize shaped beam patterns through the control of non-uniform samples of the array factor, both in amplitude and phase. These sample phases increase the number of degrees of freedom to shape the pattern. The design of a phase differentiated reconfigurable array has been described by Gies and Rahmat Samii [11] using Particle Swarm Optimization. Pramod Kumar et al. [12] applied phase only pattern synthesis for antenna array using genetic algorithm to broaden and shape the beam in transmit mode of operation.
R.F. Hyneman et al. [13] reported a pattern synthesis technique for line source antennas. Patterns like sector, ramp, cosecant and stair- step shapes are produced. The obtained results are found to have considerable ripples in the trade in and trade off regions.
The paper is organized as follows. Section 2 provides a brief description of PSO algorithm. Section 3 clearly describes Problem formulation. In section 4, simulated results are presented along with tabular forms. Finally Conclusions are discussed in section 5.
2.
PARTICLE SWARM OPTIMIZATION
Particle Swarm Optimization (PSO) is a population based stochastic optimization tool inspired by social behavior of bird flock, fish school etc. as developed by Kennedy and Eberhart in1995 [15]. In PSO, a member in the swarm, called a particle, represents a potential solution, which is a point in the search space. The global optimum is regarded as the location of food. Each particle has a fitness value and a velocity to adjust its flying direction according to the best experiences of the swarm in search for the global optimum in the D-dimensional solution space. The steps involved in PSO are given below
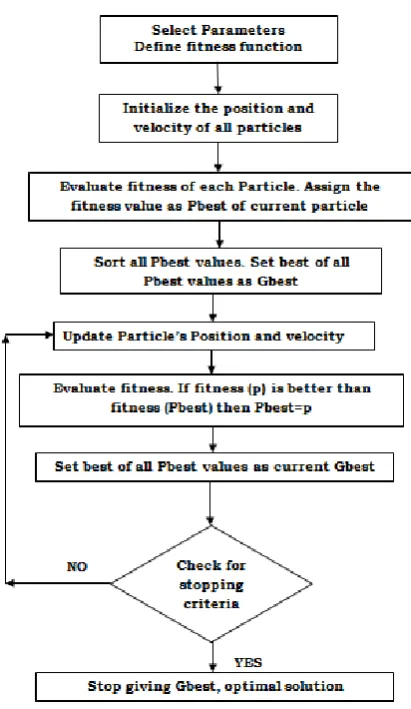
Step 1: Select parameters to be optimized and define fitness function.
Step 2: Initialization of positions and associate velocity to all particles.
Step 3: Evaluate the fitness value of all particles using the cost function. Each particle has its own personal best (Pbest) value.
Step 4: Sort all Pbest values. Best of all Pbest values becomes Gbest.
Step 5: Update velocity Vid and position Xid of the d-th dimension of the i-th particle using the following equations:
11
1
1
t1
...
id t id t
id t
id t
id
=
w
k
V
+
c
t
rand
pbest
X
V
1 1
1
1
2
idtt id t
id
gbest
X
rand
t
c
+
(1)
d min, t
id d
max t
id
>
V
or
V
<
V
IfV
thenV
id t=
U
(
V
min d, V
max d)
(2)
tid t id t
id t id t
id
=
rand
X
+
rand
V
X
2
11
2
(3)
The linearly decreasing inertia weight, w is given by
I
k
w
w
w
=
k
w
0
0
1
(4)
Here k=search number; I=maximum number of iterations; W0=0.9; W1=0.4
Step.6: Evaluate the fitness. If the fitness of a particle is better than Pbest, then replace Pbest with new fitness value. Step.7: Sort all Pbest values. Best of all Pbest values becomes current Gbest.
Step.8: Check for stopping criteria. If yes, stop giving optimal solution otherwise go to step 5.
[image:2.595.324.530.67.422.2]The flow chart diagram for Particle Swarm Optimization is shown in the figure 1 below.
Figure 1. Flowchart for PSO
A larger inertia weight (w) facilitates a global search while a small inertia weight facilitates a local search. c1(t) and c2(t) are local best and global best social parameters with c1(t) decreasing linearly from 2.5 to 0.5 and c2(t) increasing linearly from 0.5 to 2.5 over the full range of the search. rand1, rand2 are uniform random numbers between 0 and 1, having different values in different dimension, t is the current generation number.
3.
FORMULATION
[image:2.595.326.536.592.717.2]If the elements of the array are placed along a line then such a configuration is termed as linear antenna array. The geometry of linear for providing two beams as shown in fig.1.
Figure.2 Geometry of linear array for providing two beams: VPS=Variable Phase Shifter, PDN= Power Divider
In the synthesis of antenna arrays the elements are considered to be isotropic radiators. The array factor for far field radiation pattern is given by [1].
)] ( (
exp[
1 ( )
)
( N j kLuxn xn
n A xn u
E
(5)
Here
(
)
n
x
A
is the amplitude excitation of nth element;)
(
x
n
is the phase excitation of nth element; k = 2π/λ iswave number; L= length of the array; usin
.
Assume that the antenna array‟s main lobe point at
0, then the equation (5) can be written as following.) ( )]
0 ( ( exp[
1 ( )
)
( N j kLu u xn xn
n Axn u
E
(6)
Hereu sin;
0 sin
0
u ; xn= Element position in the
array.
Ishimaru [16] has suggested a spacing function, which is useful for odd and even number of elements in the array. It is given by
N N n nx 2 1 (7) If „N‟ is even number of elements and the amplitudes are symmetrical, then the equation (6) becomes
/2 exp[ ( ( 0) ( )]
1 ( )
2 )
( N j kLu u xn xn
n Axn u
E
(8)
In antenna array, the symmetric array is usually used to reduce the number of elements, reducing the computing time. The pre- fixed Amplitude distribution considered here is proposed by R. F.Hyneman [14].
1 0 1 ) exp( ' , , 2 ) ( u if u if u jx N N p n x A p F n x A (9) Here
N n n x N N n n n x x x x x F 1 2 2 ' sin ) ( (10)
N
n
n A n
x
;
1
,
2
,
3
....
2 2 1 2 '
(11)
2 5 . 0 2 1 N A N (12)
„A‟ is the sidelobe parameter which yields a ratio of
amplitudes of main beam and first sidelobe and is approximately equal to
cosh
A
Initialization and Cost function:
To generate the desired pattern, we limit the phase values in between –π and π. Cost function determines the direction of evaluation and it has great influence on obtained optimal solution.
The desired ramp pattern is represented by
elsewhere u u u u u F ; 0 0 0 ; 0 )( (13)
Here
u
0= main beam steering angle in u domainThis is sampled at fixed number of values of „u‟. At the same points the error between desired pattern and obtained pattern is evaluated.
The error in the main beam region is calculated as
elsewhere u u u F u E u E ; 0 0 0 ); ( ) ( ) (1 (14)
Least root mean square error of the main beam region is
2 1 1 2 ) ( 1 1
1
Q i i u E Qe (15)
Here „Q‟ represents the number of sampling points in the main beam region.
The error in the sidelobe region is calculated as
1 0 ); ( ) ( 0 1 ); ( ) ( ) (2 Eu F u u u
u u F u E u
E (16)
Least root mean square error in the side lobe region is
2 1 1 2 ) ( 2 1
2
S i i u E Se (17)
Here „S‟ represents the number of sampling points in the sidelobe region
Cost function =
2 2 1 1
minwe w e (18) Here w1 and w2 represents the weights of the e1 and e2
respectively.
1
2 1
n nw
(19)
4.
SIMULATION RESULTS
and to generate beam 2 all the phases are varied in between –π and +π. Results for beam 1 and beam 2 at different scan angles are presented in u- domain. Results are obtained for 60 and 80 elements.
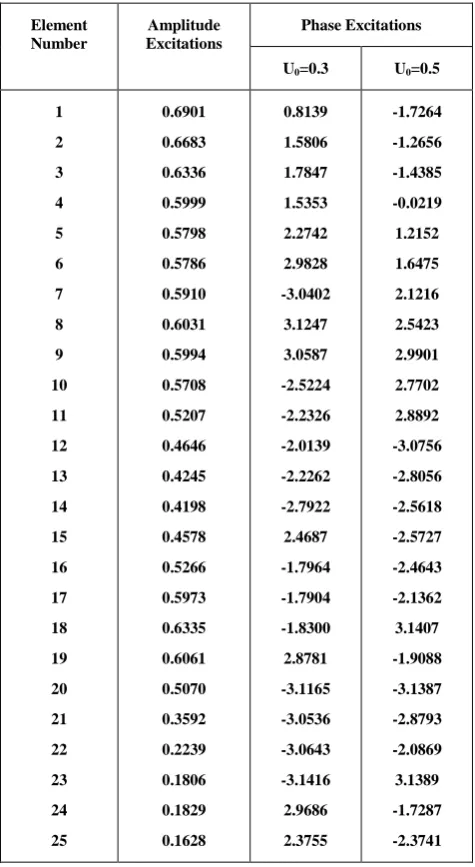
Table 1 shows the optimized phase excitations of 60 element symmetric linear array for widths of u0=0.3 and u0=0.5. Since
it symmetric linear array only right half excitations are presented. The pre fixed amplitude excitations are also shown in the table.
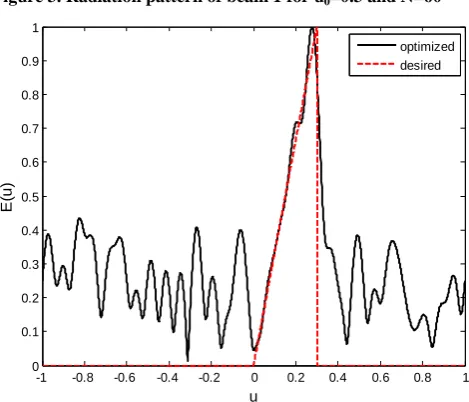
Figure 3 is a radiation pattern of beam 1, beam maximum pointed at 0.3 and figure 4 is a radiation pattern of beam 2.
-1 -0.8 -0.6 -0.4 -0.2 0 0.2 0.4 0.6 0.8 1 0
0.1 0.2 0.3 0.4 0.5 0.6 0.7 0.8 0.9 1
u
E
(u
[image:4.595.52.296.206.615.2])
Figure 3. Radiation pattern of beam 1 for u0=0.3 and N=60
-1 -0.8 -0.6 -0.4 -0.2 0 0.2 0.4 0.6 0.8 1 0
0.1 0.2 0.3 0.4 0.5 0.6 0.7 0.8 0.9 1
u
E
(u
)
[image:4.595.56.294.206.397.2]optimized desired
Figure 4. Radiation pattern of beam 2 for u0=0.3 and N=60
Figure(5) and figure(6) represents the radiation patterns of beam1 and beam 2 respectively for u0=0.5 and N=60. Results
clearly show that, there is good agreement between optimized and desired results.
-1 -0.8 -0.6 -0.4 -0.2 0 0.2 0.4 0.6 0.8 1 0
0.1 0.2 0.3 0.4 0.5 0.6 0.7 0.8 0.9 1
u
E
(u
)
Figure 5. Radiation pattern of beam 1 for u0=0.5 and N=60
-1 -0.8 -0.6 -0.4 -0.2 0 0.2 0.4 0.6 0.8 1 0
0.1 0.2 0.3 0.4 0.5 0.6 0.7 0.8 0.9 1
u
E
(u
)
[image:4.595.323.537.261.451.2]optimized desired
Figure 6. Radiation pattern of beam 2 for u0=0.5 and N=60
-1 -0.8 -0.6 -0.4 -0.2 0 0.2 0.4 0.6 0.8 1 0
0.1 0.2 0.3 0.4 0.5 0.6 0.7 0.8 0.9 1
u
E
(u
)
[image:4.595.58.293.414.615.2] [image:4.595.327.530.479.654.2]-1 -0.8 -0.6 -0.4 -0.2 0 0.2 0.4 0.6 0.8 1 0
0.1 0.2 0.3 0.4 0.5 0.6 0.7 0.8 0.9 1
u
E
(u
)
[image:5.595.318.538.71.253.2]optimized desired
Figure 8. Radiation pattern of beam 2 for u0=0.3, N=80
-1 -0.8 -0.6 -0.4 -0.2 0 0.2 0.4 0.6 0.8 1 0
0.1 0.2 0.3 0.4 0.5 0.6 0.7 0.8 0.9 1
u
E
(u
[image:5.595.58.272.71.256.2])
Figure 9. Radiation pattern of beam 1 for u0=0.5, N=80
-1 -0.8 -0.6 -0.4 -0.2 0 0.2 0.4 0.6 0.8 1 0
0.1 0.2 0.3 0.4 0.5 0.6 0.7 0.8 0.9 1
u
E
(u
)
optimized desired
Figure 10. Radiation pattern of beam 2 for u0=0.5, N=80
Similarly figures(7)-(8) represents the radiation patterns of beam 1 and 2 respectively for N=80 and u0=0.3 and figure (9)
and figure (10)corresponds to N=80 and u0=0.5.
0 100 200 300 400 500 600
0.06 0.08 0.1 0.12 0.14 0.16 0.18 0.2 0.22 0.24 0.26
Number of Iterations
R
M
S
e
rr
o
r
Figure 11. Convergence plot of PSO
[image:5.595.54.279.316.693.2]Figure 11 shows the gradual reduction of Root Mean Square error for achieving optimum pattern with different number of generations.
Table 1. Excitation levels of 60 element array
Element Number
Amplitude Excitations
Phase Excitations
U0=0.3 U0=0.5
1
2
3
4
5
6
7
8
9
10
11
12
13
14
15
16
17
18
19
20
21
22
23
24
25
0.6901
0.6683
0.6336
0.5999
0.5798
0.5786
0.5910
0.6031
0.5994
0.5708
0.5207
0.4646
0.4245
0.4198
0.4578
0.5266
0.5973
0.6335
0.6061
0.5070
0.3592
0.2239
0.1806
0.1829
0.1628
0.8139
1.5806
1.7847
1.5353
2.2742
2.9828
-3.0402
3.1247
3.0587
-2.5224
-2.2326
-2.0139
-2.2262
-2.7922
2.4687
-1.7964
-1.7904
-1.8300
2.8781
-3.1165
-3.0536
-3.0643
-3.1416
2.9686
2.3755
-1.7264
-1.2656
-1.4385
-0.0219
1.2152
1.6475
2.1216
2.5423
2.9901
2.7702
2.8892
-3.0756
-2.8056
-2.5618
-2.5727
-2.4643
-2.1362
3.1407
-1.9088
-3.1387
-2.8793
-2.0869
3.1389
-1.7287
[image:5.595.310.548.328.762.2]26
27
28
29
30
0.2507
0.4809
0.7360
0.9287
1.0000
1.3832
-1.6708
-3.0572
-0.3453
2.8266
-1.7614
-0.8455
-3.1321
-1.2230
2.6491
5.
CONCLUSIONS
This paper presents a technique based on Particle Swarm Optimization for reconfiguring the beam using linear array of isotropic elements. Two types of beams are generated with common pre- fixed amplitude distribution. Results are numerically computed using the formulation presented above. The realized ramp patterns are more close to the desired one and pencil beams are realized with low side lobe levels. Phase only synthesis makes the feeding network design simple. The obtained results were more useful in radar and communication systems. The work will be further extended by considering practical radiating elements.
6.
REFERENCES
[1] G.S.N.Raju, 2005. Antennas and Propagation, Pearson Education.
[2] C. A. Balanis, 1997. Antenna theory analysis and design, 2nd edition, John Willey and Son's Inc., New York. [3] A. Chakraborty, B.N. Das and G.S. Sanyal, 1982 „„Beam
shaping using nonlinear phase distribution in a uniformly spaced array‟‟, IEEE Trans. Anten. Propagat., 30, pp. 1031–1034.
[4] Mahanti, G. K., A. Chakraborty, and S. Das, 2007 “Phase-only and amplitude-phase only synthesis of dual-beam pattern linear antenna arrays using floating-point genetic algorithms,” Progress In Electromagnetics Research, Vol. 68, 247-259.
[5] F. Ares, M. Durr and A. Trastoy, 2000 „„Multiple-pattern linear antenna arrays with single prefixed amplitude distributions: modified Woodward-Lawson synthesis‟‟, Electron. Lett., 36,pp. 1345–1346.
[6] O.M. Bucci, G. Mazzarella, and G. Panariello, “Reconfigurable arrays by phase-only control”, IEEE Trans Antennas Propagation. Vol. 39,No.7, 919–925, 1991.
[7] S. Baskar, A. Alphones and P. N. Suganthan, 2005 “ Genetic Algorithm – based Design of a Reconfigurable Antenna array with Discrete Phase Shifters ”, Microwave and Opt. Tech. Lett., 45, pp. 461–465.
[8] X. Diaz, J.A. Rodriguez, F. Ares and E. Moreno, 2000 „„Design of Phase-differentiated multiple pattern antenna arrays‟‟, Microwave Opt. Tech. Lett., 26, pp. 52–53. [9] Banana basu, G. K. Mahanti, 2012 “Beam
reconfiguration of linear array of parallel dipole antennas through switching with real excitation voltage distribution” annals of telecommunications-annales des telecommunications 67 (5-6), pp. 285-293.
[10]J. A. R. Azevedo , 2008 “Shaped beam pattern synthesis with non- uniform sample phases”, Progress In Electromagnetics Research B, Vol. 5, 77-90.
[11]D. Gies and Y. Rahmat-samii, 2003 „„Particle swarm optimization for reconfigurable phase differentiated array design‟‟, Microwave and Opt. Tech. Lett., 38, pp. 168– 175.
[12]Pramod Kumar and A. K. Singh, 2013 “Phase only Pattern Synthesis for antenna array using genetic algorithm for radar application,” Indian Journal of Radio and Space Physics, Vol.42, pp. 259- 264, August. [13]R. F. Hyneman and R. M. Johnson ,1967 “A technique
for the synthesis of shaped beam radiation patterns with approximately equal percentage ripple,” IEEE Trans. Antennas and Propagation, vol. AP-15, pp. 736- 743. [14]R. F. Hyneman, 1968 “A technique for the synthesis of
line-source antenna patterns having specified sidelobe behavior,” IEEE Trans. Antennas and Propagation, Vol.Ap-16,No.4 pp. 430–435, July.
[15]J. Kennedy and R. C. Eberhart, 1995, “Particle swarm optimization,” IEEE Proc., Int. Conf. Neural Networks,Vol.4, pp. 1942–1948.
[16]A. Ishimaru, 1962 “Theory of unequally spaced arrays”, IRE Transactions on Antennas and Propagation, Vol, AP-10, pp.691-702.
7.
AUTHOR’S PROFILE
S. Krishna Veni received her A.M.I.E. in Electronics and
Communication Engineering from the Institution of Engineers (INDIA) in 2005 and the Master of Technology in 2008 from Andhra University College of Engineering (A). Currently, she is working towards her PhD degree in the department of Electronics and Communication Engineering, Andhra University College of Engineering (A). Her Research interests include Antenna Arrays, EMI/EMC and Soft Computing. She is a life member of SEMCE (India).