Environment
by
Haoxiang Wang
Submitted in accordance with the requirements for the degree of Doctor of Philosophy.
The University of Leeds School of Computing
September 2007
The candidate confirms that the work submitted is his own and that the appropriate credit has been given where reference has been made to the work of others.
I would like to thank all the people that have helped me get through the time spent on this PhD study.
Special thanks to Professor Ken Brodlie for encouraging, guiding me through all these years research. There are also other things besides research that I have learned from you. It is more than the word ‘indebted’.
Thanks also go to colleagues in the Visualization and Virtual Reality Research group, School of Computing. Especially, thank Dr. Jason Wood and Mr. John Hodrien for the help over the years and Dr. Mark Riding for the help in setting the Grid machine at Manchester.
Finally, a big thank you to my parents and my girlfriend, Feng, for all the love and support throughout all these years.
Scientific visualization today usually involves scientists from multiple disciplines try-ing to tackle complex simulation problems or dealtry-ing with large datasets. These scientists are likely geographically distributed, so there is a cost in both finance and time, when they are required to collaborate or meet face-to-face. The complex problems and larger datasets require high performance computing facilities which are not always available from these scientists’ desktops.
The objective of this research is to address these two issues. We aim to create a novel visualization framework which supports collaborative working amongst different users and utilizes high performance computational resources in a Grid environment.
The system is named as NoCoV, short for Notification-service-based Collaborative Visualization system. The system involves a number of visualization notification services which can be jointly provided by different developers and deployed on different Grid net-works. A visualization notification service can subscribe to other services and receive notification messages delivered from them. By using this subscription/notification com-munication pattern, users can link suitable visualization services together through a cen-tralized controller service to create customized visualization pipelines according to their different requirements. Collaborative working is supported in both creating and steering of visualization pipelines. Visualization information is recorded as XML-based descrip-tions and published as notification topics on a controller service. By subscribing to this controller service, collaboration can be achieved by sharing the visualization information amongst different participants. The NoCoV system accommodates users with different background knowledge and supports collaboration between them. Visualization services are jointly provided by different visualization service developers. Visualization experts can compose pipelines with the services created by service developers using their visual-ization expertise. Application scientists can use pipelines created by visualvisual-ization experts and can set steering parameters according to their specialized knowledge.
A NoCoV prototype is implemented as proof of concept. The prototype has four visu-alization services and one controller service which are implemented as WSRF notification services deployed on GT4 containers. The prototype also provides a pipeline editor client GUI for visualization experts to create visualization pipelines and a parameter control client for application scientists to steer these pipelines.
The performance of the NoCoV prototype is evaluated by a test involving a pipeline distributed across different Grid networks. The limitations of the NoCoV system and the future work are also discussed at the end of this thesis.
different Grid networks and supports collaboration amongst users on a global scale.
Some parts of the work presented in this thesis have been published in the following articles:
• Wang, H.; Brodlie, K.; Handley, J. and Wood, J., “Service-oriented approach to
collaborative visualization”, Proceedings of the UK e-Science All Hands Meeting 2006,(2006) 241-248. Now selected as one of the best papers from the conference and will be published in a special issue ofConcurrency and Computation: Practice and Experience, (2007)
• Wang, H.; Brodlie, K. and Wood, J., “Evolving visualization to service-oriented
architectures on the Grid”, Proceedings of 1st Workshop of the Service-Oriented Software Research Network (SOSoRNet), (2006) 25-31.
1 Introduction 1 1.1 Introduction . . . 2 1.2 Scenario . . . 3 1.3 Objectives . . . 3 1.4 Major Contributions . . . 4 1.5 Thesis Structure . . . 5 1.6 Summary . . . 5
2 Background and Literature Review 6 2.1 Introduction . . . 6
2.2 Visualization . . . 6
2.2.1 Origins of Visualization . . . 7
2.2.2 Widely Used Visualization Systems . . . 8
2.3 Distributed and Collaborative Visualization . . . 10
2.3.1 Distributed Visualization . . . 10
2.3.2 Collaborative Visualization . . . 11
2.3.3 Distributed and Collaborative Visualization Systems . . . 12
2.4 Grid Computing . . . 17
2.4.1 The Emergence of Grid . . . 17
2.4.2 Grid Middleware . . . 18
2.4.3 Web Service and Grid Service . . . 20
2.4.4 Workflow Management in the Grid . . . 22
2.5 Service-oriented and Grid-enabled Visualization . . . 23
2.5.1 Potential Benefits from SOA and the Grid . . . 24
2.5.2 Service-oriented and Grid-enabled Visualization Systems . . . 25
2.6 Formal Description of Visualization . . . 33
2.7 Summary . . . 34
3.1.1 Service-oriented Visualization Pipeline . . . 36
3.1.2 The Ability to Customize Visualization Pipeline . . . 37
3.1.3 Supporting Collaborative Visualization . . . 37
3.1.4 Accommodating Users with Different Backgrounds . . . 38
3.2 Motivations of the Research . . . 38
3.3 Requirements . . . 39
3.4 Vision of the Research . . . 40
3.5 Summary . . . 41
4 The Initial Experiments 42 4.1 The First Step: Visualization Web Services . . . 42
4.1.1 Objectives . . . 43
4.1.2 Design and Implementation . . . 43
4.1.3 Assessment and Experience . . . 44
4.2 To Step into the Grid: the gViz Portal . . . 47
4.2.1 Background . . . 47
4.2.2 Security in the Grid . . . 48
4.2.3 Design of gViz Portal . . . 50
4.2.4 The Heart Modelling Demonstration . . . 52
4.2.5 Conclusions . . . 55
4.3 To Cross the Continent: the CROWN gViz Portal . . . 58
4.3.1 Background and Aims . . . 58
4.3.2 The CROWN gViz Portal . . . 59
4.3.3 Conclusions . . . 63
4.4 Summary . . . 64
5 The Design of NoCoV Framework 66 5.1 Framework Overview . . . 66
5.2 Service Layer of NoCoV Framework . . . 68
5.2.1 Notification Web Services . . . 68
5.2.2 Notification Service in GT4 . . . 70
5.2.3 Reasons for Adopting Notification Services for Visualization . . . 71
5.2.4 Building Visualization Pipeline with Notification Services . . . . 73
5.3 Management Layer of NoCoV Framework . . . 74
5.3.1 Service Discovery . . . 75 v
5.3.4 Pipeline Control . . . 82
5.3.5 Synchronous Collaboration . . . 84
5.3.6 Asynchronous Collaboration . . . 85
5.3.7 Dynamic and Transparent Visualization Migration . . . 87
5.4 Client Layer of NoCoV Framework . . . 88
5.4.1 Visualization Pipeline Editor Client . . . 88
5.4.2 Parameter Control Client . . . 90
5.5 Summary . . . 91
5.5.1 Framework Design . . . 91
5.5.2 Framework Structure for Implementation . . . 92
6 The NoCoV Prototype Implementation 94 6.1 Aims of the Prototype . . . 94
6.2 NoCoV Prototype Overview . . . 95
6.3 Notification Services for Visualization . . . 96
6.3.1 Data Service . . . 97 6.3.2 Slice Service . . . 101 6.3.3 Isosurface Service . . . 105 6.3.4 Inline Service . . . 107 6.4 Controller Service . . . 108 6.4.1 Communication Support . . . 108 6.4.2 Collaboration Support . . . 111
6.4.3 Summary of the Controller Service . . . 112
6.5 NoCoV Clients . . . 112
6.5.1 Pipeline Editor Client . . . 113
6.5.2 Parameter control client . . . 117
6.6 A Simple Illustration of the NoCoV Prototype . . . 120
6.7 Summary . . . 124
7 Technical Evaluation 126 7.1 Performance of Visualization Services . . . 126
7.1.1 Design of the Test . . . 127
7.1.2 Passing Data Values in Notification Message . . . 127
7.1.3 Passing Data Reference in Notification Message . . . 130
7.1.4 Summary . . . 131 vi
7.2.2 Scenario . . . 134
7.2.3 Implementation and Performance . . . 135
7.3 Collaborative Visualization . . . 138
7.4 Comparison with Other Systems . . . 139
7.5 Summary . . . 141
8 Conclusions and Future Work 142 8.1 Conclusions . . . 142
8.2 Criteria for Success . . . 146
8.3 Future Work . . . 147
8.3.1 Further Implementation . . . 147
8.3.2 Further Collaboration Support . . . 148
8.3.3 Visualization Taxonomy and Data Format Standard . . . 149
8.3.4 Advanced Service and Grid Development . . . 150
8.3.5 Visualization Provenance . . . 150
8.4 Summary . . . 151
Bibliography 152
2.1 The map of Napoleon’s invasion of Russia. (Charles Joseph Minard ,
1861) (Resource from [36]) . . . 7
2.2 Visualization reference model [41] . . . 8
2.3 An example of distributed visualization . . . 11
2.4 Applegate’s reference model [4] . . . 12
2.5 Web-based visualization project [82] . . . 13
2.6 Using VNC to enable collaboration on Web-based visualization by shar-ing screen . . . 14
2.7 Collaborative visualization by using COVISA model . . . 15
2.8 Collaborative visualization pipelines in the SPIDER system . . . 17
2.9 The Community Grid Model [8] . . . 19
2.10 The basic architecture of GAPtk. . . 26
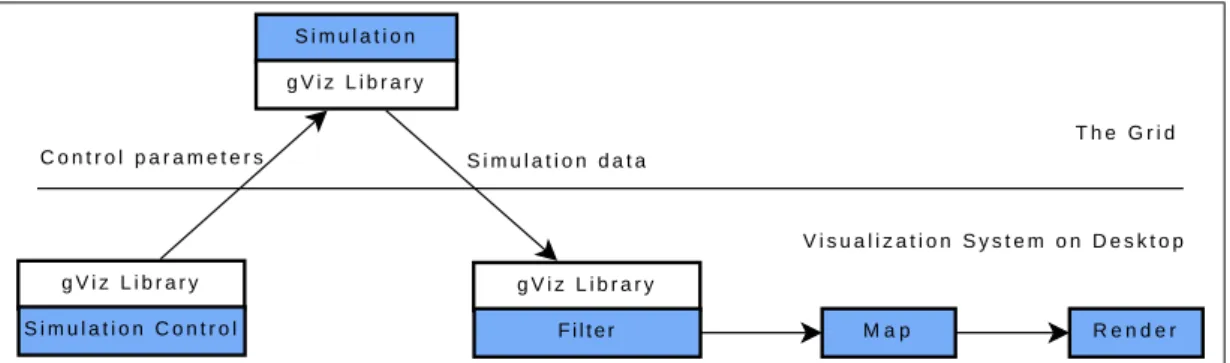
2.11 Run and steer simulation on the Grid by using gViz library. . . 27
2.12 Distribute the visualization pipeline across the Grid and the desktop. . . . 27
2.13 The architecture of e-Viz system. . . 29
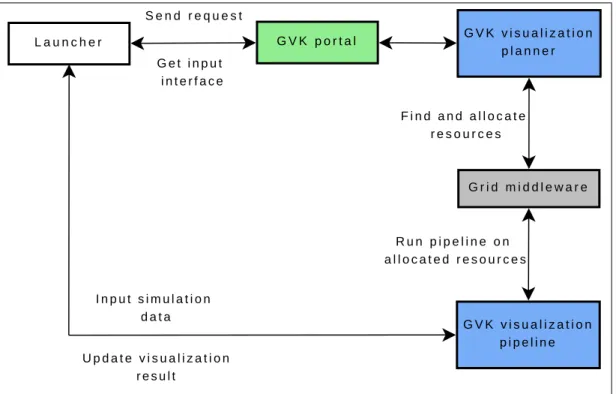
2.14 A simulation client sets up visualization pipeline through GVK system. . 30
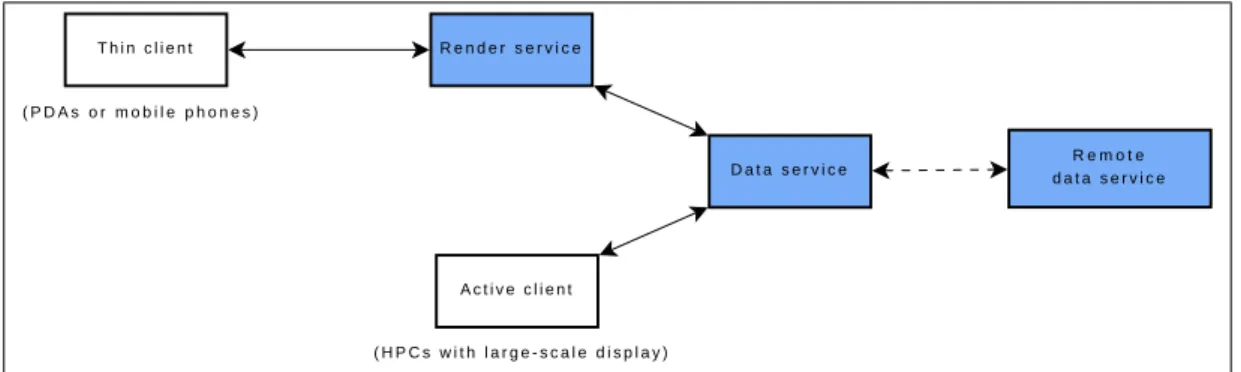
2.15 The diagram of the architecture of the RAVE system. . . 31
2.16 How jgViz application works. . . 32
2.17 Charter’s distributed visualization pipeline on the Grid [17] . . . 33
4.1 The design of visualization Web services experiment. . . 44
4.2 Screenshot of WebSerViz Portal. . . 45
4.3 Screenshot of visualization result consisting of slices and an isosurface. . 46
4.4 A mutual authentication between user A and user B. . . 49
4.5 Use a MyProxy server to store security credentials. . . 50
4.6 The three layers diagram of gViz portal system. . . 51
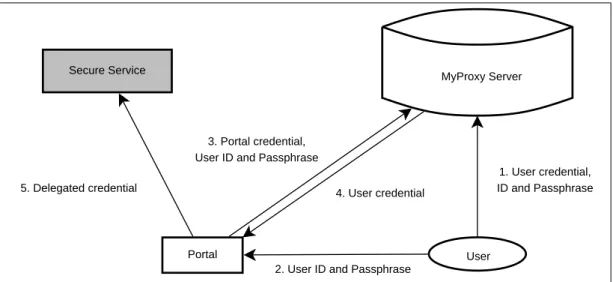
4.7 The communication between a service and a simulation. . . 52 4.8 Use a MyProxy server to access a secure Grid service from a Grid portal. 53
4.11 The components in the gViz portal. . . 56
4.12 The implementation of the Grid layer. . . 57
4.13 How the gViz portal works. . . 57
4.14 The visualization result returned from the gViz portal. . . 58
4.15 Distribution of the CROWN gViz portal. . . 62
4.16 The re-located CROWN gViz portal. . . 63
5.1 Three layers in the NoCoV framework. . . 67
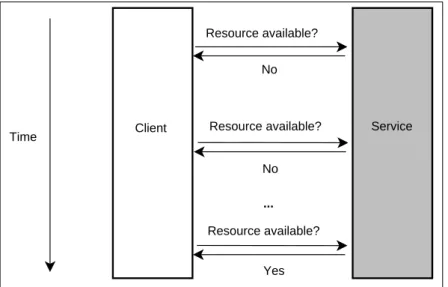
5.2 The polling approach to update changes happened in a service. . . 69
5.3 The notification approach to update changes happened in a service. . . 70
5.4 How a Resource Home works in a GT4 service. . . 71
5.5 The notification pattern in GT4. . . 72
5.6 Implement a visualization module as a notification service. . . 73
5.7 A simple pipeline composed of two notification services. . . 74
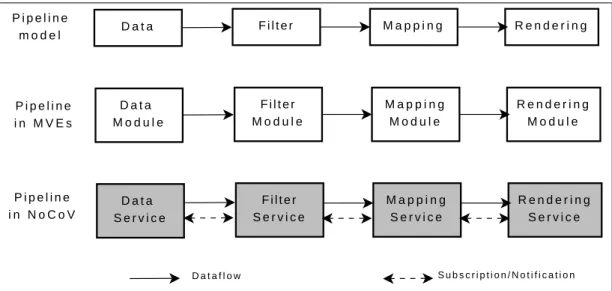
5.8 Implementations of pipeline model in MVEs and NoCoV framework. . . 75
5.9 Service registry and discovery through a UDDI server. . . 75
5.10 The usage of UDDI registry in NoCoV framework. . . 76
5.11 Access control at the system level in NoCoV framework. . . 80
5.12 The grid-map authorization with each session. . . 81
5.13 The pipeline control functionalities provided by the management layer. . . 83
5.14 Synchronous collaboration by subscribing to notification topics. . . 85
5.15 Asynchronous collaboration in the NoCoV framework. . . 86
5.16 The transparent migration of a visualization task from Service B to its substitute service. . . 88
5.17 The components inside the visualization pipeline editor client. . . 89
5.18 The components composing the parameter control client. . . 91
5.19 The structure of the NoCoV framework. . . 93
6.1 Using the inline service to produce multiple slices and isosurfaces. . . 107
6.2 The support provided by the controller service for clients and visualiza-tion services. . . 108
6.3 The overview of the controller service’s implementation. . . 113
6.4 The implementation of the PEC. . . 114
6.5 Screenshot of the PEC GUI. . . 115
6.6 The GUI to set input and output ports for connecting different services. . 115 ix
6.8 The overview of the implementation of the PCC. . . 118
6.9 The tabs generated on the PCC GUI corresponding to the visualization pipeline displayed in Figure 6.7. . . 119
6.10 The stand-alone VRML Viewer for PCC users. . . 119
6.11 The outline of the collaborative scenario for the NoCoV prototype. . . 120
6.12 The PEC GUI at the end of the stage 1 in the collaboration. . . 121
6.13 The two visualization experts’ PEC GUIs at the end of the stage 2 in the collaboration. . . 122
6.14 The two application scientists’ PCC GUIs and their stand-alone VRML viewers at the end of the stage 2 in the collaboration. . . 123
6.15 The setting of control parameters through PCC GUIs in stage 3. . . 123
6.16 The PEC GUI with the updated visualization result at the end of stage 3. . 124
6.17 The outline of the asynchronous collaborative scenario. . . 125
7.1 Pipeline for isosurface visualization with passing data in notification mes-sage. . . 127
7.2 Line chart of the time cost of notification message communication be-tween the data service and the isosurface service, when data delivered as notification messages. . . 128
7.3 Line chart of the time cost by the isosurface service, when data delivered as notification messages. . . 129
7.4 Pipeline for slice visualization with passing data in notification message. . 129
7.5 Line chart of the time cost for notification message communications be-tween the data service and the slice service, when data delivered as noti-fication messages. . . 130
7.6 Line chart of the time cost by the slice service, when data delivered as notification messages. . . 131
7.7 Pipeline for isosurface visualization with passing data reference in notifi-cation message. . . 131
7.8 Pipeline for slice visualization with passing data reference in notification message. . . 132
7.9 Comparison of the time cost by the isosurface service between two ver-sions of implementation. . . 133
7.11 The distribution of the NoCoV system across two Grid networks. . . 136 7.12 A visualization pipeline composed by the services deployed on two Grid
networks. . . 136 7.13 The distribution of the NoCoV services and clients . . . 138
2.1 A snippet of skML describing a “Render” module. . . 34
2.2 A snippet of skML describing a link between two modules. . . 34
4.1 An example of GWSDL snippet. . . 60
4.2 An example of WSDL snippet. . . 60
4.3 A JNDI configuration of a GT4 service resource home. . . 61
5.1 A snippet of the visualization description adopted in NoCoV. . . 78
5.2 Description of a link between two instances. . . 79
5.3 An example of a grid-map file. . . 80
5.4 An XML description of a request to set a parameter. . . 83
6.1 The snippet from file Data.wsdl. . . 98
6.2 The snippet from file Factory.wsdl. . . 99
6.3 The snippet from DataResource.java. . . 100
6.4 The description of ‘setSlice’ method in Slice.wsdl file. . . 103
6.5 The description of ‘link’ method in Slice.wsdl file. . . 104
6.6 The fields in the VRML node -‘IndexedFaceSet’. . . 104
6.7 The snippet of the usage of ‘inline’ in a VRML file. . . 107
6.8 The WSDL description of the ‘createInstance’ method. . . 110
6.9 The XML description for the action of creating an instance called ‘MyIso’ from the ‘IsoFactory’ factory. . . 110
6.10 The XML description of a ‘link’ request to connect the input port ‘val-uesIn’ on ‘MyIso’ service with the output port ‘valuesOut’ on ‘MyData’ service. . . 110
6.11 The XML description of a ‘setParam’ request to set the ‘Threshold’ values on ‘MyIso’ service as 0.75. . . 111
6.12 An example of the XML description of the action to set an endpoint of an existing pipeline. . . 111
7.1 The system information of the machine balrog.vipl.mcc.ac.uk. . . 126
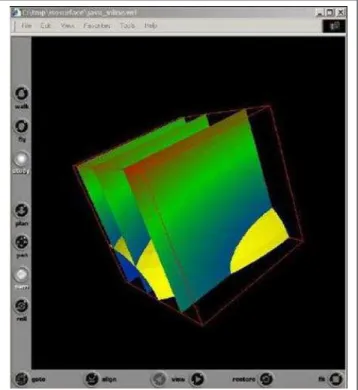
7.2 The ‘double glazing’ datasets used for the evaluation. . . 127
7.3 The performance of the isosurface service. . . 128
7.4 The performance of the slice service. . . 129
7.5 The performance of the isosurface service. . . 132
7.6 The performance of the slice service. . . 132
7.7 The system information of the two Grid machines used in the evaluation . 133 7.8 The camparison of the performance of the distributed version NoCoV and local version NoCoV. . . 137 7.9 Summary of the comparison between VNC, COVISA, SPIDER and NoCoV.140
Introduction
The symbolic, which includes the literal and the numeric, is one of the most important ways to represent and understand the world. However, limited by the cognitive capabili-ties of the human brain, the symbolic is not easily understood when it is used to describe complicated or large-scale problems. “An estimated 50 percent of the brain’s neurons are associated with vision” [63]. By using computer technologies to transform the symbolic into the geometric, visualization aims to help this neurological machinery to work, so that human can have a deeper insight of the world.
Starting from the historical hand-drawn diagrams, visualization is now more con-cerned with generating graphics from numerical data by using computers for data ex-ploration and data presentation. Visualization is widely used for addressing scientific problems and itself is also recognized as a crucial component in e-Science.
As the growth in the size and the complexity of scientific problems, the research is in a trend of involving scientists from multiple disciplines and requiring powerful compu-tational resources. The focus of this thesis is to present a novel visualization framework which supports different participants to collaboratively work on the same visualization and utilize heterogeneous computational resources in the Grid environment.
This chapter presents an overview of the research and an outline of the remaining chapters in this thesis.
1.1 Introduction
Richard Hamming observed in 1962 that “the purpose of computing is insight not num-bers” [42]. Scientific visualization aims to allow users to have insight into the data and gain deeper understanding of the data, especially the increasingly large datasets which can be generated from simulations or experiments. By transforming numeric data into graphics, visualization provides scientists an opportunity to discover the unseen hidden in the data. For the scientific community, visualization has became a very important method for scientific discovery and research. In 1998 McCormick et al. even claim that “in many fields it (visualization) is already revolutionizing the way scientists do science.” [55]
In the last decades, a number of widely used visualization tools have been developed, many of them following the dataflow paradigm. This dataflow paradigm is also known as the pipeline reference model which was proposed by Haber and McNabb [41] and Upson et al. [75]. In this model, a visualization pipeline consists of a set of processing steps where users can interact by setting steering parameters. These visualization systems are categorized as Modular Visualization Environments (MVEs). They provide users with a set of visualization modules and a visual pipeline editor tool allowing users to con-nect suitable modules. Some of these MVEs, such as Application Visualization System (AVS) [6], IRIS Explorer [45], IBM Data Explorer (DX) [27] and Amira [3], are intro-duced in detail in Chapter 2.
The nature of a visualization pipeline makes it straightforward to implement in a dis-tributed paradigm with different parts of the pipeline running on different machines. There has been another trend in visualization systems to support collaborative work, allowing geographically distributed users to work on the same visualization synchronously or asyn-chronously. Distributed visualization utilizes different computational resources, whereas collaborative visualization offers the opportunity to utilize different human expertise.
To address the increasingly complex scientific problems, more and more computa-tional resources are required for visualization to address these problems. The emergence of the Grid offers visualization systems the opportunity to utilize heterogeneous Grid resources. Some pilot projects of building Grid-based visualization systems are also pre-sented in Chapter 2 in detail.
Service-Oriented Archtecture (SOA) is adopted as the fundamental design principle for many Grid implementations. SOA is an evolution of distributed computing. It pro-vides computational prosesses and resources as loosely-coupled services.
This thesis introduces a SOA-based novel visualization framework in the Grid envi-ronment supporting collaborative work. The framework is named as NoCoV, standing for
Notification-service-based Collaborative Visualization and exploiting notification service as the basic concept in the design.
1.2 Scenario
The visualization framework proposed in this thesis aims to provide a worldwide collab-oration between different users and using the Grid computing resources at a global scale. Imagine we have the following situation:
A meteorologist in Leeds wants to study an environmental dataset in collaboration with another meteorologist in London. To avoid the time and expense of travel, they plan to synchronously collaborate by using some visualization system over the network. Both of the scientists know well the target to be discovered in the dataset, however they do not have the visualization skills to build visualization pipelines in the visualization system.
Fortunately, they know a visualization expert in US, who is willing to help them to build a suitable visualization pipeline for them. As they are in different time zones, it is difficult for all of them to work at the same time, but they can collaborate asynchronously. The visualization expert can firstly create the pipeline, and then leave it for the two scien-tists to set parameters and create the visualization results they want.
The environmental dataset is stored on a Grid network in Leeds, where there also exists a filter service which can dramatically reduce the size of the dataset by applying certain algorithms to refine the dataset according to the scientists’ interest. Meanwhile there is a research group in China. They have already had many successful experiences in visualizing this kind of environmental dataset. They implemented the visualization pro-cess as a service. As the propro-cess is quite computationally demanding, they have deployed the service on a China Grid network.
The visualization expert in US therefore decides to link the filter service in UK and the visualization service in China into his visualization pipeline. In this scenario, the visualization pipeline is distributed across different Grid networks at a global scale, and the participants involved are also from different locations in the world.
1.3 Objectives
Reflecting the scenario provided in Section 1.2, the objectives of the research described in this thesis are:
• Utilizing powerful computational resources for visualization. For dealing with increasing large datasets efficiently, we aim to evolve visualization into the Grid environment with the support of accessing these heterogeneous computational re-sources from users’ desktops.
• Allowing collaboration. Collaboration is one of the main objectives that this
re-search aims to provide. Synchronous collaboration can be prompt and efficient for participants to share thoughts and reach agreements. However, for participants from different time zones, an asynchronous collaboration mechanism allowing them to work at different times can be useful.
• Accommodating users with different background knowledge. Visualization in
the Grid environment requires skills of Grid computing, visualization skills and knowledge in particular scientific areas. This is a steep learning curve for users to master all this knowledge. Our research aims to provide different ways to access visualization for different kinds of users and avoid this steep learning curve for users.
• Enabling extensibility and distribution. The research explores the
implementa-tion of a visualizaimplementa-tion system using Service-Oriented Architecture. Visualizaimplementa-tion functions are delivered to users as loosely-coupled services, so that the system can be easily distributed and extended by adding new visualization services.
1.4 Major Contributions
The major contributions achieved by the research introduced in this thesis are:
• Design of a Service-oriented visualization framework;
• Use of notification services to implement visualization pipelines;
• Implementation of the framework in the Grid environment;
• Capability of distributing visualizations across different Grid networks;
• Support of both synchronous and asynchronous collaboration;
• Different interfaces for different users;
Based on this research and implementations which have been done, we identify the areas of future work in order to achieve our ideal visualization system.
1.5 Thesis Structure
In order to get a clear vision of where our research started from, we look back at how technologies were developed and evolved until the present stage. In Chapter 2, we re-view several visualization systems and projects which worked in the areas of distributed and collaborative visualization. With an overview of Grid computing technologies, some pioneering projects in Grid-based visualization are also discussed in this chapter.
In Chapter 3, critical appraisals of related projects are made in order to refine the requirements of our research and lay out an overall vision.
Some early experiments of our research are presented in Chapter 4. With this initial work, some requirements to our research have been proved as feasible. The limitations reflected from these experiments also inspire some design features in our visualization framework.
Chapter 5 presents the detailed design of the visualization framework (NoCoV) in a three-layer architecture. Chapter 6 describes how we implemented this framework as a proof-of-concept prototype. Technical details about how the visualization pipeline is implemented as a set of linked notification services and how users can collaboratively work with the NoCoV system are illustrated in this Chapter.
The evaluation of the NoCoV framework is carried out in Chapter 7, including the comparison between NoCoV and other collaborative systems.
Finally, in Chapter 8 we conclude the research presented in this thesis and identify the future work need to be completed in order to achieve our final vision of Service-oriented collaborative visualization.
1.6 Summary
This chapter has laid out an overview of this thesis. We also presented the objectives of our research and the major contributions which we have achieved through this research.
Background and Literature Review
2.1 Introduction
This chapter describes the background of this research. It is always important to look back at how the technologies were developed in order to inspire a vision of how to evolve them further. Meanwhile, by investigating relevant works and analyzing strengths and weaknesses of them, motivations and requirements can be produced for our research.
In Section 2.2 we explain the origins of visualization and a set of widely used visual-ization applications. Section 2.3 discusses why and how these applications were extended to enable distributed and collaborative visualization. Section 2.4 presents the develop-ment of the Grid and the technologies, especially the Service-oriented architecture, which can be used in the Grid environment. Some pioneering work concerning Grid-enabled and Service-oriented visualization is illustrated in Section 2.5, which enlightens the research introduced in this thesis. Section 2.6 mentions the formal description of visualization which becomes more important when we evolve visualization in the Grid environment and in a Service-oriented architecture.
2.2 Visualization
In this section, we begin with an introduction to the history of visualization and why it is important for scientific research. A number of popular visualization software systems
are described, some of which can be classified as examples of Modular Visualization Environments (MVEs).
2.2.1 Origins of Visualization
Visualization is not a new paradigm, having been widely used in maps, scientific draw-ings, and data plots for thousands of years. One of the famous historical visualization examples is the map of Napoleon’s invasion of Russia by Charles Joseph Minard (1781-1870), published in 1861 (Figure 2.1), in which the thickness of the line indicates the strength of the army, with numbers indicating strength at critical points. The line gives readers a straightforward impression of the reduction of the number in Napoleon’s army, and the numbers explain the change in a precisely quantitative view. Other historical vi-sualization examples can be found at Friendly’s online Gallery of Data Vivi-sualization [36].
Figure 2.1: The map of Napoleon’s invasion of Russia. (Charles Joseph Minard , 1861) (Resource from [36])
Today, visualization is recognized as the utilization of the computer graphics technolo-gies as a tool for data exploration and data presentation. The origins of visualization lie in scientific and engineering disciplines, such as chemistry, biology, geography, astronomy, etc. The increasingly large datasets and the rapid growth of computer technologies (i.e. high speed network for data access, powerful computational resource for data processing, etc.) has drawn visualization more into the computer science area.
Brown wrote an ACM report which encouraged research funding agencies to invest in vi-sualization [55]. While a number of vivi-sualization systems were developed following the inspiration of McCormick’s ACM report, visualization scientists were also looking for a generic conceptual model for these different visualization systems. Haber and McNabb proposed a visualization reference model [41] to abstract visualization as a pipeline of processes which transform raw data (captured from experiments or simulations) step by step into a visual representation (graphic or animation). Figure 2.2 demonstrates the dif-ferent types of process in this visualization pipeline: Data, Filter, Map and Render. The Data step feeds raw data into the pipeline, and the Filter process extracts the relevant data or refines the raw data by using some algorithm. The Map step generates a geometric representation using the filtered data, and then sends the geometric data to the Render step, which finally converts data into a visual image or animation.
D a t a F i l t e r M a p R e n d e r
Figure 2.2: Visualization reference model [41]
A similar reference model was also introduced by Upson, et al [75] in the paper de-scribing the initial work on the Application Visualization System (AVS) [6]. The refer-ence model can be regarded as a milestone in the evolution of visualization. Subsequently, many powerful visualization software systems were developed with the influence of the reference model, most of which are still commonly used nowadays. These visualization systems are introduced in detail in section 2.2.2.
2.2.2 Widely Used Visualization Systems
Modular Visualization Environments (MVEs) can be regarded as typical implementations of Haber and McNabb’s reference model. An MVE usually provides a set of encapsulated modules, each of which can be classified as a type of Data, Filter, Map or Render, corre-sponding to the steps in the reference model. Users can create visualizations by linking these modules to build up a visualization pipeline, according to their specialized require-ment. Wood summarized six basic features of MVEs in his PhD thesis [81], namely:
• A graphical user interface (GUI) for constructing visualization pipelines.
• A library of routines for general visualization requirements.
• A data/memory/control management mechanism.
• A command language for driving the system by means of predefined scripts.
• A mechanism for user extensibility.
Five visualization systems are introduced briefly in the following paragraphs to exem-plify MVEs.
TheApplication Visualization System(AVS) is designed for developing interactive
visualization applications quickly [6, 75]. The system is now named as AVS5. AVS was written in C++ following the Object-Oriented Programming paradigm and comes with a visual network editor, through which users can combine modules provided to create visualizations.
IRIS Explorer [45, 78] from NAG Ltd is another example of an MVE. It provides
a large suite of specialized modules included in its library. A map editor is provided by IRIS Explorer, through which users can build up complicated visualization pipelines by choosing modules from the library and interconnecting them with wires. Users can also encapsulate their own code as modules and import them into IRIS Explorer by using the Module Builder tool.
Data Explorer[1, 27] from IBM is also implemented as a modular visualization
sys-tem, based on the pipeline model. A Graphical User Interface is provided for users to build up their visualization pipeline easily and a wide variety of widgets are provided for users to manipulate images or control various aspects of visualization. It was renamed as OpenDX subsequently, when the software came to be open-source for the community.
Amira[3] andMeVisLab[56] are two MVEs both from Germany. They are both built
with C++ class libraries and provide modules for users to combine together to generate complex image processing and visualization networks. Extensibility is also supported in both pieces of software by allowing a user to add customized modules.
Here, we introduce the Visualization Toolkit (VTK) as a contrast to the above MVEs. VTK [68, 77] is an open source visualization toolkit, which also reflects Haber and McN-abb’s reference model, but not an MVE. VTK consists of a C++ class library and several interfaces for Tcl/Tk, Java, and Python. Users can produce customized visualizations by writing their own code to invoke appropriate APIs provided by VTK. Compared with MVEs, VTK requires users to use a computer programming language, whereas, as a re-ward to these users, they have the full freedom to build up their own visualization. VTK’s high customizability and open-source feature are largely responsible for its wide adoption in visualization.
These traditional visualization systems are very successful and have been widely adopted in both academia and industry, but drawn by the increasing requirements and the emergence of new technologies and hardware infrastructures, these visualization systems have kept evolving forward.
2.3 Distributed and Collaborative Visualization
Distributed visualization and collaborative visualization are two distinct, but interlinked concepts. Distributed visualization, as implied by the name, means that different parts of the visualization processes are executed on different host machines, while collabora-tive visualization focuses on the cooperation at the human level, with the visualization processes involving a number of participants. Some visualization systems involve both distributed and collaborative features.
2.3.1 Distributed Visualization
Distributed visualization allows different parts of the visualization pipeline to be run on different machines. Therefore, we can optimise the use of different hardware resources in order to achieve a good visualization result.
As classified by Haber and McNabb, usually a whole visualization process involves four types of steps with distinctive characteristics: Data, Filter, Map, and Render. We illustrate the distributed visualization by using an example visualization pipeline. In this pipeline, the Data step is a simulation which provides large-scale raw data every time step and also requires high computational capability on the machine where it is run. The Filter step can dramatically reduce the size of the data by applying some refining algorithm. Therefore, in the distributed visualization as the data needs to be transferred between dif-ferent locations, the Filter step can largely reduce the time cost on data transfer. Computa-tional capability is also essential in the Map step, which is the process of converting data into geometric representation. To gain high quality graphics at the Render step, powerful graphical processing hardware is needed. For end-users, a high resolution display screen will be important in order to have a clear view of the visualization result. However, with-out the distributed visualization, it is difficult and expensive to build up a machine which meets all the requirements for this example visualization pipeline.
The optimised distribution of the visualization pipeline is displayed in Figure 2.3. As both the Data and the Map require powerful computational resources, and there is large data transfer between the Data (simulation) and the Filter, they are allocated on the same
supercomputer, while Render is run on a Graphics workstation and display the result on a high resolution screen.
D a t a ( s i m u l a t i o n ) F i l t e r M a p R e n d e r D i s p l a y S u p e r c o m p u t e r G r a p h i c s w o r k s t a t i o n H i g h r e s o l u t i o n s c r e e n
Figure 2.3: An example of distributed visualization
Taking advantage from their modular feature, most MVEs (i.e. IRIS Explorer, AVS, etc) enable users to distribute different modules onto different machines. More details and examples about these systems will be presented later in Section 2.3.3
2.3.2 Collaborative Visualization
Large research projects usually involve scientists who are from different disciplines and geographically distributed. Distributed visualization can spread visualization pipeline across multi-sites, but when these dispersed scientists need to analyse the visualization result together, they have to travel to the same location. Collaborative visualization can address this problem and avoid the travel by allowing scientists to work together cross the network.
Applegate’s reference model [4] from the field of Computer Supported Co-operative Working (CSCW) is widely used to characterise different types of collaboration. As shown in Figure 2.4, the two coordinate dimensions stand for time and place. ‘Syn-chronous’ on the time axis means participants in the collaboration cooperate at the same time. Vice versa, ‘Asynchronous’ supports participants to collaboratively work at different times. It is notable that most CSCW projects and applications focus on the synchronous collaboration and asynchronous collaboration at different places. White board systems, Instant Messenger applications and video conference systems can be regarded as tools which support collaboration from different places at the same time. Asynchronous col-laboration is the characteristic reflected by systems such as e-mail, newsgroups, Bulletin board systems (BBS), etc.
P l a c e D i f f e r e n t S a m e S y n c h r o n o u s A s y n c h r o n o u s T i m e V i d e o C o n f e r e n c e E - m a i l M e e t i n g r o o m N o t i c e b o a r d
Figure 2.4: Applegate’s reference model [4]
Visualization systems have also been extended to support collaboration. Most of this work focuses on synchronous collaboration, while only a little is relevant to asynchronous collaboration. The GRASPARC project [11] proposed an approach for recording the progress of a visualization process, by storing information in a structure called History Tree. Asynchronous collaboration can be possible by extracting a History Tree and shar-ing it with other participants in the same collaborative session. A number of projects have been undertaken in the area of synchronous visualization which are introduced in section 2.3.3.
Distributed visualization utilizes the hardware and software resources at different indi-vidual machines, and collaborative visualization enables the utilization of scattered human expertise. Some visualization systems can be characterised as distributed and collabora-tive visualization systems, which enables the collaboration at both low level (hardware and software level) and high level (users’ expertise). Again, these systems will be re-viewed in the coming subsection.
2.3.3 Distributed and Collaborative Visualization Systems
Web based visualizationcan be recognized as an example of distributed visualization.
Part of the visualization pipeline can be executed on a Web server, and the remainder of the pipeline will be run locally. Wood [82] developed a WWW-based visualization system built on IRIS Explorer. A Web page interface is provided for users to feed parameters into
the visualization pipeline. The output from the Web server is a geometry representation (VRML description), which is then rendered by the user’s VRML browser locally. Figure 2.5 shows how the visualization pipeline is distributed using a Client/Service pattern. The system does not require end-users to install any visualization software or special hardware on their local machines. As long as they have access to the Internet and install a Web browser with VRML plug-in, they can use the system from anywhere. However, the structure of the system determines that users have to largely rely on the centralized server and lack the ability to reconfigure the visualization pipeline deployed on the server.
V R M L b r o w s e r R e n d e r M a p F i l t e r D a t a P a r a m e t e r s C o n t r o l I n t e r f a c e W e b - b a s e d f o r m s S e r v e r C l i e n t
Figure 2.5: Web-based visualization project [82]
The distributed Web-based visualization systems do not allow different users to col-laborate on the same visualization task at the same time. However, collaboration can be enabled by using some screen sharing software, such as Virtual Network Computing
(VNC) [65]. VNC consists of a server part and a client part. Multiple clients may connect to the same VNC server at the same time. The server specifies what area on the screen is going to be shared and what control permission is to be offered to the connecting clients. VNC does not only share pixels on the screen amongst users, but also shares the control of mouse or keyboard which means clients can also manipulate the items on the shared
screen. There are various flavours of VNC from different organisations, among which the widely used VNC systems are RealVNC [64] and TightVNC [73]. Figure 2.6 demon-strates the use of VNC to view Wood’s Web-based visualization interface remotely.
Figure 2.6: Using VNC to enable collaboration on Web-based visualization by sharing screen
It is also notable that VNC can be used for the remote rendering. By running a VNC tool on a remote machine, the render part of a visualization pipeline run there can be controlled by users from their local machines through VNC clients.
Supporting collaboration through screen sharing (using tools such as VNC) is a very generic method which can be applied to any non-collaborative visualization system with-out re-implementing the original system, but the conflict over control of items on the screen can be a problem. If multiple users want to move the cursor in different direc-tions at the same time, there is inevitable contention. Screen sharing amongst all the participants will lack the ability of keeping some individual work confidential during the collaboration, as they are only allowed to have one view. It can be that different users will want to view the visualization result from different view points, or one of the participants will want to keep the setting of parameters as confidential, and just share the other parts
of the visualization.
To support more flexible collaboration, some visualization systems have been ex-tended with collaborative features, by adding modules which support collaborative work into these systems. By adoption of this approach, AVS and NAG’s IRIS Explorer were extended to be collaborative visualization systems.
D a t a F i l t e r M a p R e n d e r S h a r e D a t a U s e r A M a p R e n d e r C O V I S A C O V I S A C O V I S A C O V I S A U s e r B S h a r e P a r a m e t e r s
Figure 2.7: Collaborative visualization by using COVISA model
Wood et al introduced a collaborative visualization reference model in the COV-ISA[84] project, as an extension of the Haber and McNabb reference model. Two types of ‘share’ modules are involved in the collaborative reference model. One is used to allow data to flow from one participant’s visualization pipeline to other users; and the other type of ‘share’ module is used to share the control of modules on each participant’s pipeline. Figure 2.7 shows an example of using the COVISA reference model to share the data which flows out from User A’s Filter module to User B’s Map module and to share the control parameters of the Map module on both User A and User B’s pipelines. By adding COVISA ‘share’ modules, data can be shared at any point on the pipeline and control parameters can be shared on any module in each participants’ pipeline.
The COVISA collaborative model was implemented based on NAG’s IRIS Explorer, allowing users the abilities of collaboration and distributing visualization pipelines. It has been integrated with IRIS Explorer’s multiple platform installations, which means that collaboration can be achieved across heterogeneous machines by installing corresponding versions of IRIS Explorer on these machines.
It provides a small number of additional modules that enable users to interactively share all major AVS data types, and the visualization parameter settings associated with other AVS modules. TheMANICORALproject [24] also provided share modules for AVS by adopting a similar approach.
Compared with collaboration through VNC, systems such as COVISA, cAVS and MANICORAL have high flexibility. Users can run visualization pipelines individually and have the ability to share data or control at any point. Moreover, each user can have own interface, rather than sharing a unique interface as in VNC. Firstly, different inter-faces allow users more confidentiality during the collaboration; secondly, it means differ-ent interfaces can be generated according to differdiffer-ent experience and expertise of users. However, the flexibility also causes complexity at the same time. As users build and main-tain their visualization pipeline individually, other users in the same collaborative session do not have the awareness of each other’s actions during the collaboration.
Besides the systems mentioned above, which are extended from MVEs, some vi-sualization systems are designed with collaboration in mind initially. The COVISE
(Collaborative Visualization and Simulation Environment) system [21], which was
initially developed by Wierse et al at the University of Stuttgart, allows users the abilities of distributing visualization processes on different hosts and collaborating on visualiza-tion. Like other MVEs, COVISE can link distributed processes on different hosts to produce a visualization. In COVISE, collaboration was achieved by replicating the user interface with a master/slave based floor control mechanism. The later releases of CO-VISE enhanced the performance by replicating the whole system on each cooperating host and synchronizing the interface by only passing the changed part in the interface.
Lovegrove [51] developed a collaborative visualization system calledSPIDERwhich works in a similar manner to COVISE. The Visualization pipeline is replicated on collabo-rators’ machines. Figure 2.8 displays how the system works. A session manager functions as the ‘share’ modules in COVISA or cAVS, and is responsible for the organisation and communication between different clients throughout the collaborative session.
Unlike collaborative systems such as COVISA, in the SPIDER system, conceptually there only exists one visualization pipeline across participants’ machines, although it is replicated and run at each site. Therefore, it does not have the problem of awareness, as each user sees the same pipeline. The biggest challenge in SPIDER turns out to be the synchronization, as the replicated pipelines are run on different machines with different computational power, processing data at different speeds.
D a t a F i l t e r M a p R e n d e r
U s e r A
U s e r B
S e s s i o n M a n a g e r
D a t a F i l t e r M a p R e n d e r
Figure 2.8: Collaborative visualization pipelines in the SPIDER system
2.4 Grid Computing
While visualization was increasing in importance in 1990s, a new research area emerged in computer science, called “Grid computing”. The Grid is recognized as the next gen-eration of the ‘Web’. The term ‘Grid’ does not only consist of computer and network infrastructure, but also the software systems running on the Grid, specifications of the frameworks and the protocols for communication, etc. The ‘Grid’ aims to break through the boundaries between different organisations and institutions to share the resources on the network.
The ultimate vision of the Grid is to provide users with the ability to dynamically uti-lize resources to support large-scale, resource-intensive, and distributed applications [33]. By achieving that, the Grid will “provide the electronic underpinning for a global society in business, government, research, science and entertainment” [8].
This subsection discusses the Grid in depth and analyses the possibility of the usage of Grid technologies in the area of visualization.
2.4.1 The Emergence of Grid
The Grid originated from parallel computing, which attracted lots of research interest in the 1980s. Through the development of algorithms, software and architectures which sup-port parallel computing, it became possible to build large-scale programs. However, even with parallel computing, the limited computational capability of a single machine was
typ-ically an obstacle for running very large programs. The Grid was initially born to create larger virtual supercomputers by spreading large-scale programs over well-coordinated distributed systems.
Meanwhile, research in many scientific areas needs large-scale computational infras-tructure as a fundamental tool to process increasingly large data. Moreover, most key scientific research has become cross-disciplinary and involves geographically distributed human expertise and computational resources. Therefore, coordination and distribution have emerged as the main problems in conducting multidisciplinary and geographically dispersed scientific research projects. These are also recognized as two fundamental con-cepts in Grid Computing since 1990s [8].
The Information Wide-Area Year (I-WAY) project [23] is generally considered as the first modern Grid. Seventeen supercomputer centres dispersed across US were aggregated as a testbed for I-WAY and aimed to create an experimental environment for building large distributed applications and for exploring the issues of distributed data management and scheduling management. The I-WAY project revealed that research in Grid computing requires more emphasis on the integration, coordination and management of software, whereas distributed computing generally focuses on addressing the problems of the uti-lization of geographically dispersed computational resources.
Many Grid projects were initiated in order to investigate the full range of components, services and systems which make up Grid computing, following the pioneering work of I-WAY. One of the notable projects amongst these is the Globus project, which has evolved through several versions of toolkits to explore the development of a system-level infrastructure as a basic foundation the Grid computing. The Globus toolkits will be introduced in detail in section 2.4.2.
A widely accepted definition of the Grid was made by Foster and Kesselman in 1998, as “a hardware and software infrastructure that provides dependable, consistent, perva-sive, and inexpensive access to high-end computational capabilities” [33]. In addition to the original definition, Foster listed three features of the Grid [34]: 1) coordinating resources that are not subject to centralized control; 2) using standard, open, general-purpose protocols and interfaces; 3) delivering nontrivial qualities of service.
2.4.2 Grid Middleware
As the Grid aims to provide an infrastructure to provide easy access to widely spread heterogeneous resources, which is how the Grid was defined, a multi-layer structure and a software implementation based on this structure come to be very crucial to bridge the
gap between the heterogeneous resources and easy access for end-users.
Figure 2.9: The Community Grid Model [8]
Berman et al abstracted a multi-layer model for the Grid, called the Community Grid Model [8]. As shown in Figure 2.9, the model consists of four horizontal layers and two vertical layers. The bottom horizontal layer represents heterogeneous resources across the Grid network which can be computers, network facilities, and even distributed data archives. As these resources are very disparate, a common infrastructure layer is added on top of the resources layer, consisting of a set of commonly agreed standards and speci-fications, such as the Open Grid Services Architecture (OGSA) [60] and the Web Service Resource Framework (WSRF) [88]. The next horizontal layer contains the Grid mid-dleware, tools and services which are implemented on top of the specifications from the common infrastructure layer. The top layer represents the applications which use the Grid as a platform. The two vertical columns are the issues which affect the future develop-ment of the Grid. The column on the left represents the new devices and technologies, and the right column consists of the policies of sharing resources, the development of the Grid economy and the globalization of the Grid network.
To develop applications on the Grid platform, such as building visualization applica-tions on the Grid, Grid middleware, that can provide relatively easy use of the heteroge-neous Grid resources, is the layer we are most concerned with.
The Globus Toolkit [32, 37] is one such Grid middleware tool, which has been widely deployed and has evolved through different versions. The first version of the Globus Toolkit evolved from the I-WAY project and contains a set of basic services including job scheduling, security, resource monitoring and discovery, etc. Globus Toolkit 2 (GT2)
con-tinued to evolve to be a more mature Grid middleware with integration of a set of standard services/tools such as allocation manager, high performance data transfer (GridFTP) [38]. GT2 middleware has been successfully used for building the UK National Grid Service (NGS) [57], White Rose Grid (WRG) [85], etc.
The two early Globus Toolkit versions work in a batch processing manner. Although users can submit jobs to clusters through the GT tools, it still requires the application software to be deployed on the different machines across the network environment. In or-der to provide more user-friendly tools to the scientific community, rather than the batch processing manner, the third version of the Globus Toolkit (GT3) was released with the adoption of a Service-oriented architecture. GT3 can be considered as an implementation of the Open Grid Services Infrastructure (OGSI) [7, 34] which provides an infrastruc-ture layer for the services defined by OGSA. The functionalities provided by GT2 were wrapped and exposed as Grid services in GT3.
GT3 is considered as an important development in Grid technologies, but it is incom-patible with Web service standards. OGSI is considered as too dense, as it covers the full aspects of Grid service in a single specification. The Web-Service Resource Framework (WSRF) [88] replaced OGSI. Compared with the dense OGSI specification, WSRF con-sists of six specifications, covering different aspects of services. Another significant dif-ference between WSRF and OGSI is that WSRF associates stateful resource with stateless Web service, rather than using stateful Grid service. Based upon WSRF, Globus Toolkit 4 (GT4) is built as a convergence of Grid service and Web service.
The UK Open Middleware Infrastructure Institute (OMII) [5, 62] also provides Grid middleware that aims to offer both academia and industry a sustained, well-engineered, interoperable, documented and supported Grid. OMII is compatible with Web services based on WSRF. Moreover, OMII provides a set of Grid-enabled tools such as OGSA-DAI for data access and integration on the Grid, GridSAM for job submission and monitoring, and Taverna for workflow management.
2.4.3 Web Service and Grid Service
Service-oriented architecture (SOA) defines a software system constructed from loosely coupled services. OASIS (the organisation for the Advancement of Structured Informa-tion Standards) [59] defines SOA as “a paradigm for organizing and utilizing distributed capabilities that may be under the control of different ownership domains”. Thus SOA can be regarded as a framework, and so it can be implemented with different kinds of technologies. In the early stages, most SOA systems were implemented with RPC
(Re-mote Procedure Call) or CORBA. Now, Web service or Grid service technologies are widely adopted to build SOA systems. Compared with previous technologies (i.e. RPC or CORBA), the utilization of Web service or Grid service makes the components in SOA systems more independent, which implies the component services can be run on differ-ent platforms and written in differdiffer-ent languages; and more standardized, in terms of the description of services and the communication between services.
The term ‘Web service’ refers to those services that use high level Internet communi-cation protocols (i.e. HTTP or SMTP) to pass Simple Object Access Protocol (SOAP) [70] communication messages and have their interfaces described by the XML-based Web Ser-vice Description Language (WSDL) [86]. Web serSer-vice is originally designed as a stateless technology. Each Web service only has one persistent instance which is invoked by all the clients. Clients are not allowed to keep stateful information on the service; otherwise it will affect other clients who use the same service.
While Web service keeps maturing through the effort from Web service communities, there is another strand of research from the Grid communities (i.e. Globus Alliance and Global Grid Forum) which can also be utilised to implement SOA systems. It is called Grid service which uses the concepts from Web service as a basis. OGSI defines how a Grid service can be implemented [7]. As a contrast to Web service, Grid service is stateful in nature. To use a Grid service, a service instance with lifetime needs to be created from the service factory. The service instance is integrated with Service Data Element (SDE) which is used to store stateful data for the client. An extension of WSDL (GWSDL) is used to describe Grid service interface.
Although the stateless problem of Web service is addressed by Grid service, there are still criticisms of Grid service and its OGSI specification [22], including the following aspects:
• OGSI does not separate the functions but puts them into one specification which can not support incremental adoption of extensions.
• It does not work well with the existing Web services and tools. For example, the OGSI introduced an extension of WSDL1.1, but some part of the extension is un-supported by existing services and tools.
• Grid service paradigm is too object-oriented. Grid service is based on Web ser-vice, but offers stateful features by encapsulating stateful resource with service. Some Web service purists insist that Web service should be stateless. In addition, some implementations do not accommodate dynamic service creation and destruc-tion very well.
As a convergence of Grid service and Web service,Web Services Resource Frame-work(WSRF) is proposed by refactoring OGSI with standard Web service technologies. The criticisms of Grid service are addressed by building Web services based on WSRF:
• WSRF consists of a set of sub-specifications: WS- ResourceProperties, WS- Re-sourceLifetime, WS- RenewableReferences, WS- ServiceGroup, WS- BaseFault and WS- Notification family. The division of sub-specifications enhances the ex-tensibility of WSRF.
• WSRF uses standard XML Schema mechanisms which are compatible with existing Web services and tools.
• Rather than integrating resource with service to build up stateful service, which is how Grid service is implemented, WSRF uses stateless Web service. However, stateful resource can be accessed through each Web service instance. Compared with Grid service, WSRF separates service and stateful resource, but still keeps the ability to store stateful information on service for each client who uses the service. After WSRF was firstly proposed in 2004, organisations such as Web service com-munities and Globus Alliance have continued to work on the evolving of Web service standards. Globus Alliance released the WSRF based GT4 in 2005, through which Web service can be developed and deployed on the Grid instead of Grid service. It also means all the previous work that industry and academia have put into the Web service develop-ment can be easily migrated into the Grid environdevelop-ment.
2.4.4 Workflow Management in the Grid
Defined by the Workflow Management Coalition (WFMC) [80], workflow is the automa-tion of a set of business processes according to a set of procedural rules. The emergence of SOA brought new characteristics to workflow management. When the SOA systems are implemented with Web services or Grid services, the business processes considered in workflow management become a number of services.
The Business Process Execution Language for Web Services (BPEL4WS) [10], re-leased jointly by IBM, Microsoft and BEA systems, is a workflow language that describes the number of Web services that need to be executed, the order in which they are executed and the type of data they share. It grew from WSFL (Web Services Flow Language) (from IBM) and XLANG (from Microsoft) which are two WSDL-based descriptions of the composition of Web services, and has become the standard Web services Workflow description language.
A number of research projects have been carried out on the implementations of work-flow management systems, especially in the scope of the Grid.
The Taverna project, as a component in the UK e-Science myGrid project, aims to provide tools to facilitate easy use of workflow and distributed computing technologies for scientific communities, especially for biology and bioinformatics [61, 71]. A Taverna workbench is provided as User GUI, which enables the construction and editing of work-flows and supports loading and saving these workwork-flows as an XML serialization (named as XScufl in the Taverna project). Taverna has been integrated as a standard tool in UK-OMII Grid middleware as a workflow management facility to easily compose distributed Web services and data resources to create a complex scientific research process.
The Triana project delivered an open source problem solving environment developed at Cardiff University. Triana combined an intuitive visual interface for users to construct complex workflows graphically and transparently [20, 53]. Therefore users can be re-lieved from the burden of the complexity of dealing with numerous and heterogeneous services. Users are allowed to save the workflows created using the Triana user interface in multiple formats, such as Directed Acyclic Graphs (DAG) and BPEL4WS. Users can replicate a previously created workflow by simply loading the saved description, or create a new workflow by altering previous work. Triana is similar to the Taverna system, but as a problem solving environment, it is more generic. Furthermore, the Taverna project fo-cuses more on the Web service-based bioinformatics workflows, whereas Triana provides mechanisms for coupling workflows more tightly with Grid middleware tools.
The Kepler project has more emphasis on ‘scientific workflow’. It considers less about control-oriented and task-oriented business workflow, but more about the dataflow passed between a set of processes for a particular large-scale and complex scientific task. It was also extended to support the composition of both Web services and Grid services. [52]
2.5 Service-oriented and Grid-enabled Visualization
Ever since the first emergence of Grid technologies and Service-oriented architectures, scientists have being working on evolving visualization by embedding these new tech-nologies. This is a Service-oriented approach, we can consider implementing visualiza-tion funcvisualiza-tions as services. These services can be invoked by the client applicavisualiza-tions or other services to accomplish more complicated visualization tasks.2.5.1 Potential Benefits from SOA and the Grid
By utilising SOA to develop visualization systems, we can gain a range of benefits:
• Ability to interoperate - Different individuals and companies can develop
visual-ization services using different technologies and on different platforms and connect them together to generate the visualization result they require.
• Ability to extend- There are two aspects here: first, as long as the service interface
remains the same, we can change the implementation or working environment of the service according to the requirements (e.g. for higher quality, higher performance, or the advantages of using a new algorithm), without affecting other parts of the system; second, when a new visualization function is required, we can simply build it as a new visualization service which will be easily linked into the visualization pipeline by using a SOAP message to invoke its interface.
• Ability to collaborate - Again there are two aspects to collaboration. Firstly,
vi-sualization specialists can collaborate to provide a global repository of visualiza-tion Web services, built and deployed by different specialists at geographically dis-tributed locations. Secondly, visualization users can collaborate in a session, by connecting to the same services and sharing dataflow and parameter settings, in a similar way in principle to the collaboration-enabled extensions of MVE, such as COVISA, cAVS, etc.
• Ability to easily migrate- by implementing the visualization modules provided by
MVEs as Web services or packaging several relevant modules as a Web service, the migration from MVEs to Service-Oriented visualization systems can be quite straightforward.
The Grid was born with the aim of providing easy access to heterogeneous and dis-tributed resources, greater than can be provided by a single supercomputer. For visual-ization, the increasingly large data sets demand greater computational power than users typically have access to on the desktops. Meanwhile, as large projects usually involve scientists from different disciplines and institutions, it requires visualization to be decom-posed into parts that can be distributed. For visualization the beneficial aspects from the Grid can be abstracted as:
• Heterogeneous computational resources - For visualization, particularly for large
scale scientific visualization and real-time simulation, we can achieve higher per-formance from powerful Grid computational resources.
• Standard, open, general-purpose protocols and interfaces- Visualization systems/ components from different organisations can be linked together, if they follow the same standard.
• Useful Grid middleware tools- Visualization can harness existing Grid middleware
tools. For example, GridFTP can be used for transferring distributed visualization data; the Access Grid can provide the capability for the interactions on the human level in collaborative visualization and for the sharing of geometric data stream between distributed visualization processes [48].
2.5.2 Service-oriented and Grid-enabled Visualization Systems
Building Service-oriented and Grid-enabled visualization systems is a very active research area in visualization. As there are many visualization systems which can be categorized in both the categories of Service-oriented and Grid-enabled visualization, we introduce them in the same subsection
GAPtkThe Grid aware Applications Portal toolkit (GAPtk) [67] is an important and
pioneering effort to utilize Web services in visualization. Compared with GAPtk, the pre-vious application toolkits, such as Cactus and the Problem Solving Environment applica-tion (PSE) SCIRun, require a steep learning curve and also introduce a new development and execution environment for applications. It is usually intensive in terms of workload to customize an existing application, which users are familiar with, into the new envi-ronments. The GAPtk toolkit aims to develop a generic system consisting of a set of integrated services from which legacy applications can exploit Grid computing.
Figure 2.10 is the architecture diagram of the GAPtk application. GAPtk consists of two main parts: the client part and the server part. The GAPtk client part receives requests or callbacks from the PSEs and converts them into XML messages. This layer makes Grid resource and GAPtk services transparent to end-users, so that they only need to stay with familiar applications with their present knowledge. The GAPtk Web services on the Grid receive the XML messages about clients’ requests and the implementation backend is responsible for actual processing of the requests. In the case that the process needs external resources (i.e. distributed data resources, computational power or third party services), the GAPtk server side forwards the request to other Grid resources.
The GAPtk implementation provides a generic toolkit that makes the Grid computing methodology available for existing visualization applications. A set of specific visualiza-tion services are provided, such as an isosurface service, but it lacks the ability for users to chain up these services and configure the visualization pipeline.
E x i s t i n g P r o b l e m S o l v i n g E n v i r o n m e n t s W e b s e r v i c e c l i e n t b a c k e n d W e b s e r v i c e s s e r v e r a n d i m p l e m e n t a t i o n b a c k e n d G r i d - b a s e d c o m p u t a t i o n a l a n d d a t a r e s o u r c e s C l i e n t G r i d G A P t k
Figure 2.10: The basic architecture of GAPtk.
gViz Project
As one of the most popular MVEs, NAG’s IRIS Explorer was extended to be Grid-enabled by the UK e-science gViz project [14, 40]. The gViz project incorporated Grid middleware within IRIS Explorer allowing it to be run securely in a distributed environ-ment. The first strand of the project was to enable users to launch a visualization module on a remote machine from the IRIS Explorer run on their local machine; the second strand was to develop a gViz library which enables steering external components running on the Grid from the front-end visualization systems.
By using the gViz library, IRIS Explorer can run visualization pipelines partially on the Grid, but allows control of parameters and steering of simulations through the graph-ical interface on the user’s desktop. Figure 2.11 and Figure 2.12 demonstrate two ap-proaches to spread visualization pipeline across the Grid and the desktop.