Sobel Edge Detection using Parallel Architecture based on
FPGA
Varun Sanduja
Department of Electronics and Communication Engineering,
Lovely Professional University, Jalandhar, India
Rajeev Patial
CoD VLSI Design, Department of Electronics and Communication Engineering, Lovely Professional University, Jalandhar, India
ABSTRACT
This paper proposes an FPGA based approach known as Sobel Edge Detection. RGB image is taken by the computer source and converted into binary image using MATLAB. The proposed Sobel Edge Detection is modeled using Parallel Architecture and implemented in Verilog HDL. The whole process is performed in the hardware level that utilizes the resources of Xilinx ISE 12.4. The result shows good performance of edge detection with maximum frequency of 200 MHz. The time from image read to final edge determined image would vary with the image size. Also, the device utilization summary shows good results.
Keywords
Gradient Operator, Sobel Edge Detection, Digital Image Processing, FPGA
1.
INTRODUCTION
In digital image processing, the term edge is a collection of the pixels it refers to the part where the brightness of the image local area changes significantly or we can also say that edge in an image might for instance be the boundary between the different colors. The basic edge detection method is to determine the level of variance between different pixels by executing edge-detection operators for each small matrix area [1] [2]. Digital Image Processing proposed the general methods of edge detection are First Order Derivative (gradient method), Second-Order Derivative and Optimal Edge Detection to detect the edge. There are various types of the Gradient Operators named Roberts operator, Prewitt operator [3] and Sobel operator. The types of edge detection comes under the Second Order Derivative are Laplacian, Laplacian of Gaussian and Difference of Gaussian. Canny Edge Detection is an example of the Optimal Edge Detection method. The second order derivative is very sensitive to noise present in the image and that is the reason second derivative operators are not usually used for edge detection operation [4] but the second derivative operators are used for extension of some secondary information, that is the sign of second derivative to determine whether the point is lying on the darker side of the image or a point is lying on the brighter side of the image. First derivation can be computed by using of the gradient operators [5][6].
The derivative operators are used for image enhancement or to enhance the details present in the image and these derivatives operations can be use for detection of edges present in the image [7].
2.
SOBEL
EDGE
DETECTION
OPERATOR
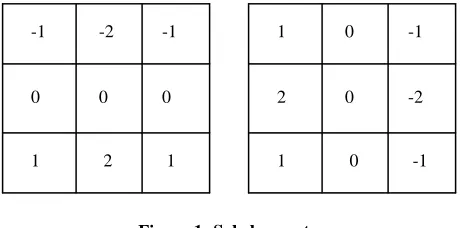
In case of Sobel Edge Detection there are two masks, one mask identifies the horizontal edges and the other mask identifies the vertical edges. The mask which finds the horizontal edges that is equivalent to having the gradient in vertical direction and the mask which computes the vertical edges is equivalent to taking in the gradient in horizontal direction. Sobel masks are given in the figure 1 [7].
Figure 1: Sobel operators
By passing these two masks over the intensity image the gradient along x direction (Gx) and gradient along the y direction
(Gy) can be computed at the different location in the image. Now
the strength and the direction of the edge at that particular location can be computed by using the gradients Gx and Gy. The
gradient of an image 𝑓(𝑥, 𝑦) at location(𝑥, 𝑦) is defined as the vector
∇𝑓 = 𝐺𝐺𝑥
𝑦 =
𝜕𝑓 𝜕𝑥 𝜕𝑓 𝜕𝑦
(1)
Where Gx is the partial derivative of 𝑓 along x direction and Gy
is the partial derivative of 𝑓 along the y direction.
Computation of the magnitude of the gradient involves squaring the two components Gx and Gy adding them and takes the square
root of this addition [8].
∇𝑓 = 𝑚𝑎𝑔 ∇𝑓 = [𝐺𝑥2+ 𝐺𝑦2]1/2 (2) -1
-2 -1
0 0 0
1 2 1
-1 0
1
-2 0
2
-1 0
The approximation of this is taken as magnitude of the gradient to be sum of magnitude of Gx gradient in the x direction plus
magnitude of Gy in the y direction
≈ 𝐺𝑥 + 𝐺𝑦 (3)
The magnitude tells the strength of the edge at location(𝑥, 𝑦), it does not tell anything about the direction of the edge [9][10]. To compute the direction of the gradient𝑓, let 𝛼(𝑥, 𝑦) represent the direction angle of the vector ∇𝑓 at (𝑥, 𝑦), then
𝛼 𝑥, 𝑦 = 𝑡𝑎𝑛−1 𝐺𝑦
𝐺𝑥 (4)
Sobel Edge Operator gives an averaging affect over the image, so effect due to the presence of spurious noise in the image is taken care of some extent by the Sobel operator. Sobel operator also gives a smoothing effect by which we can reduce the spurious edge that can be generated because of the noise present in the image.
2.1
Sobel Filter Analysis
Filtering is the process of applying masks to images and the application of a mask to an input image produces an output image of the same size as the input image. There are three steps of convolution are given which is necessary for filtering [11].
Step1. For each pixel in the input image, the mask is conceptually placed lying on that pixel.
Step2. The values of each input image pixel under the mask are multiplied by the value of the corresponding mask weights.
Step3. The result are summed together to yield a single output value that is placed in the output image at the location of pixel being processed on the input [12].
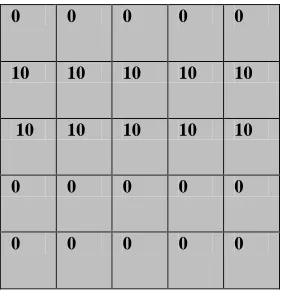
The pixel values of an original image is shown in the figure 2 and Sobel masks are also shown in figure 1 for horizontal and vertical scan. Now compute Gx and Gy, gradients of the image
performing the convolution of Sobel kernels with the image and use zero-padding to extend the image. The process of computing Gx and Gy using convolution and zero padding is given in the
figure 3 and figure 4. Gradients Gx and Gy, of the image are
shown in the figure 5 and figure 6.
0 0 0 0 0
10 10 10 10 10
10 10 10 10 10
0 0 0 0 0
0 0 0 0 0
Figure 2: Original image pixel values
Figure 3: Computing Gx using convolution steps and zero
padding
Figure 4: Computing Gy using convolution steps and zero
padding
30 40 40 40 30
30 40 40 40 30
-30 -40 -40 -40 -30
-30 -40 -40 -40 -30
0 0 0 0 0
Figure 5: Gradient Gx
30
0X0 0 0 010X 2
10X1 10 10 10
10 10 10 10 10
0 0 0 0 0
0 0 0 0 0
-10
0X -20 0 0
10X0 10X
-1
10 10 10
10 10 10 10 10
0 0 0 0 0
0 0 0 0 0
-2 -1
-1
1 0
0 -1
1
-10 0 0 0 10
-30 0 0 0 30
-30 0 0 0 30
-10 0 0 0 10
0 0 0 0 0
Figure 6: Gradient Gy
3.
SOBEL
EDGE
DETECTION
IMPLEMENTATION
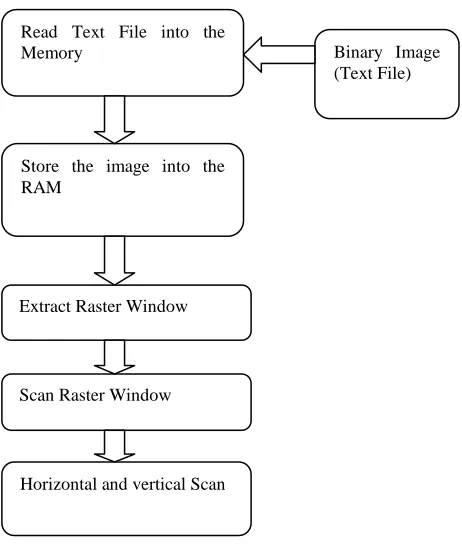
This paper purposed Edge Detection using Sobel Operator in Digital Image Processing and implementation using Verilog HDL. Firstly, a jpg image is inputted and converted into binary image with the help of MATLAB. Acquire a jpg image, which is by default in an RGB color space and convert this RGB image to grey level image. Now convert the grey level image into the binary image. This binary image is very large, so it is resized and written into a text file shown in the figure8.Further implementation is done on the Xilinx ISE 12.4 and Modelsim. The Sobel operator is used commonly in edge detection. The Sobel operator is a classic first order edge detection operator, computing an approximation of the gradient of the image intensity function. At each point in the image, the result of the Sobel operator is the corresponding norm of this gradient vector. The Sobel operator only considers the two orientations which are 0°and 90°convolution kernels. The operator uses the two kernels which are convolved with the original image to calculate approximations of the gradient. As given above, the gradients are calculated along with the magnitude in Verilog HDL (Hardware Description Language) synthesis and then it is simulated and checked out with respect to the design summery and timing analysis. Now with the help of Xilinx ISE 12.4 read the text file generated by the MATLAB into the memory and store it into the RAM, then extract the raster window. Two 3 x 3 windows are shown in figure 7. Next, scan the text file with the window and find out the values of center pixel, north, south, east, west, south east, south west, north east and north west pixel for whole binary image row wise and column wise, this completes the horizontal and vertical scanning. The process of raster scanning is shown in figure 9.
Figure 7: Raster windows
Figure8: Process flow of RGB to binary image conversion
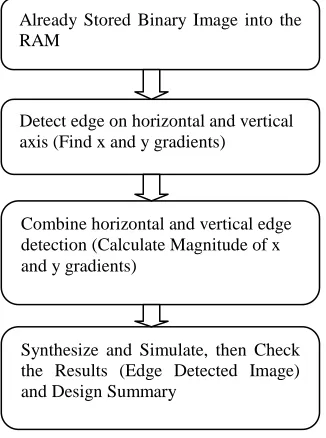
Figure 9: Process flow of raster window scanning Further, two convolution masks are designed to respond maximally to edges running vertically and horizontally relative to the pixel grid, one mask for each of the two perpendicular orientations. The masks can be applied separately to the input image, to produce separate measurements of the vertical and horizontal gradients. These can combined together to find the absolute magnitude of the gradient at each point. Process flow is shown in the figure 10.
neH NH
nwH
EH CH WH
seH SH
swH
neV NV nwV
EV CV
WV
seV SV
swV
Acquire a jpg image
Convert RGB to Grey level Image
Convert Grey Level Image to Binary Image
Write the Binary Image into Text File
Read Text File into the
Memory Binary Image
(Text File)
Store the image into the RAM
Extract Raster Window
Scan Raster Window
Figure 10: Process flow of Edge Detection
4.
RESULTS AND DISSCUSION
All results are represented in this section as per the process flows given in the previous section. Firstly as per shown in the figure 8 process flow of RGB to binary image conversion the acquired RGB color space image is shown in figure 11, resized black and white image shown in figure 12 the generated binary image written into the text file shown in the figure 13.
Figure 11: RGB color space image
Figure 12: Resized black and white image
Figure 13: Binary image as a text file Already Stored Binary Image into the
RAM
Detect edge on horizontal and vertical axis (Find x and y gradients)
Combine horizontal and vertical edge detection (Calculate Magnitude of x and y gradients)
For the FPGA Virtex 4, device XC4VLX200 and package FF1513 the time taken for the sobel operator to calculate the gradients is 400 µs at 200 MHz. The time from Image read to final edge determined image would vary with the image size.
The used image is a binary level image. The utilized FPGA hardware resources are given in table 1.
Table 4.1: Device Utilization Summary
Logic Utilization Used Available Utilization
Number of Slice Flip Flops
836 178,176 1%
Number of 4 input LUTs
3,901 178,176 2%
Logic Distribution
Number of occupied Slices
1,987 89,088 2%
Number of Slices containing only related logic
1,987 1,987 100%
Number of Slices containing only unrelated logic
0 1,987 0%
Total Number of 4 input LUTs
3,901 178,176 2%
Number of bonded IOBs
11 960 1%
Number of
BUFG/BUFGCTRLs
1 32 3%
Number used as BUFGs
1
5.
CONCLUSION AND FUTURE WORK
Sobel edge detection operator is insensitive to noise and the masks of sobel operator is relatively small as compare to the canny edge detection operator thats why soble egde detection operator is used. A parallel architecture of FPGA based Sobel edge detecion operater is presented in this paper. This method reduce the complexity of the design and also reduce the processing time. The future work improvement can be done with Pipeline structure.
6.
REFERENCES
[1] Raman Maini, Dr. Himanshu Aggarwal, “Study and Comparison of Various Image Edge Detection Techniques”, International Journal of Image Processing (IJIP), Volume (3)
[2] Tian Qiu, Yong Yan* FIEEE, Gang Lu SMIEEE, 2011. “A New Edge Detection Algorithm for Flame Image Processing”, IEEE.
[3] R.Maini and J.S.Sohal,2006. “Performance Evaluation of Prewitt Edge Detector for Noisy Images” Vol. 6, pp. 39, 42, GVIP Journal
[4] S.Sarangi and N.PRath, 2007. “Performance Analysis of Fuzzy-based Canny Edge Detector”, pp. 272-274, IEEE Computer Society.
[5] Bovik, 2009. “The Essential Guide to Image Processing”, Academic Press, Elsevier Inc.
[6] Mohamed Nasir Bin Mohamed Shukor, Lo HaiHiung, Patrick Sebastian3, 2007. “Implementation of Real-time Simple Edge Detection on FPGA” pp. 1404-1405,IEEE.
[7] Gonzalez, Rafael C, 2008. “Digital Image Processing”, Pearson Education, Inc., publishing as Prentice Hall.
[8] Zhengyang Guo,Wenbo Xu,Zhilei Chai, 2010. “Image Edge Detection Based on FPGA”, pp 169, IEEE.
[9] Prof. V. B. Baru., Chetan S. Deokar, 2010. “VLSI Implementation of Real-time Image Segmentation”, pp 211, IEEE.
[10]I.Yasri*, N.H.Hamid, V.V.Yap, 2008. “Performance Analysis of FPGA Based Sobel Edge Detection Operator” IEEE.
[11]Gleb V. Tcheslavski, 2008.“Spatial filtering fundamentals” ELEN 4304/5365 DIP, pp. 3-8,spring.
[12]Nick Kanopoulos, Nagesh Vasanthanada, Robert L.Baker, 1988. “Design of an Image Edge Detection Filter Using the Sobel Operator” pp. 359, IEEE.