DOI: http://dx.doi.org/10.26483/ijarcs.v8i9.4899
Volume 8, No. 9, November-December 2017
International Journal of Advanced Research in Computer Science
RESEARCH PAPER
Available Online at www.ijarcs.info
ISSN No. 0976-5697
-ANALYSIS OF RELEVANCY USING RAPID MINER WITH AN
EXPERIMENTAL STUDY ON POPULAR DISCUSSION FORUM
P.Radhika
Research Scholar Rayalaseema UniversityKurnool
Dr P.SureshVarma
Professor of CSE Adikavi Nannaya UniversityRajahmundry M.Santosh
Student VNR VJIET
Hyderabad
Dr.G.V.Rao
CEO, SasankaELearning Pvt Ltd, Hyderabad
K.Kamakshaiah
Asst .Professor, Dept of CSEVNR VJIETHyderabad
Abstract: Massive Open Online Courses (MOOCs) is a model for delivering course content online independent of attendance and place .Online Discussion not only brings opportunities for innovation in education but also shifts focus from traditional educations. MOOCs in Computer Programming can help in attracting students because it personalizing their learning experiences at lower cost. In addition to watching videos, students also engage in discussion forums to share their understanding. On the other hand, online discussion forums provide a platform to ingenious students to share their ideas in a holistic way which is not possible through regular websites, videos, online courses. Both novice and expert users search the web exhaustively for their coding practises to learn gradations behind libraries, programming languages and frameworks.In community-based question-answering communities, where students ask questions there is no guarantee that students get their what they are searching for. This poses an unsatisfactory level in the student. In this paper, we present a machine learning model that predicts the relevancy of answers to the forum questions using historical forum data .The study attempted to identify the relevance criteria that people use when browsing a discussion forum
Keywords: MOOC’s, Engagement, Discussion forums, Prediction, Relevancy.
1. INTRODUCTION
MOOCs have become a popular and significant source of distance-education due to the flexibility of course access and varied topics of courses. Online courses provide a good platform for learning across various places with these benefits ,there are million students who enroll in one or more MOOCs. Since MOOCs typically offer with only video-based lectures with no interactions with professor, students usually lack the opportunity to have interactions with other students and the instructor relative to traditional resident courses.
Anderson [3] discusses the features of successful forums , as well as the capacities and boundaries for online learning. Social network analysis is commonly applied to investigate the interactions on learning forums[4]. Dropout behaviour is identified as related to sentiment of students’ forum posts based on sentiment analysis of MOOC forums discussions[5].Hauang et al.[6] studied the behaviour of users who make great contributions across different MOOC forums.
Technology-based interactions, such as blogs and forums ,are introduced as potential solutions . The Q&A forum like StackOverflow, Stack exchange, quora are the most popular forums [7], [8], but a lot of niche forums exist for every feasible piece of programming technology. In addition, online documentation pages, technical blog posts, and open-source code repository websites often embed discussion
forums at the bottom of each webpage to allow people to discuss that page’s contents.
Research using MOOC Forum
supervised classification algorithm “Decision Tree” on our dataset using Rapid Miner tool.
Prediction Model
The data provided by the discussion forum is used to define various features. By these features, we can provide many inclusive methods to get the predictions right. The data-set formation is based on the binary classification that is to provide the relevant discussion. These features help for the formation of the data-set that help to predict the relevancy. Features include user features and the thread features.
User features:
As on all the discussion forums, the candidates participate in answering different set of questions which help them to understand or clear the doubts of others. These answering to the different set of questions given in a thread that ultimately have an answer accepted or it may be opinion based which hence can be used for training model. These feature also provide further information about the last activity in the forum and the number of viewers visited that forum . In the formation of the data-set the number of accepted answers are considered to provide better and more accurate predictions.
Thread features:
It holds the information about the built-in thread post. Most of the thread post provide information about the answers and the comments that have been already posted.
The questions and the answers are taken from the most of the computer science discussion forums wherein the discussion in these forums are more frequent and the discussion goes on a related pace. The impact of these features are provide the information gain by the number of accepted answers posted by the users, sum of the votes received by an user overall threads ,and number of posted comments by users.
Each extracted feature is then represented into set of distinct values to facilitate better machine learning . For our predication purpose we used RAPID-MINER tool-kit without any other techniques involved to show that our features are sufficient enough to create meaningful predictions.
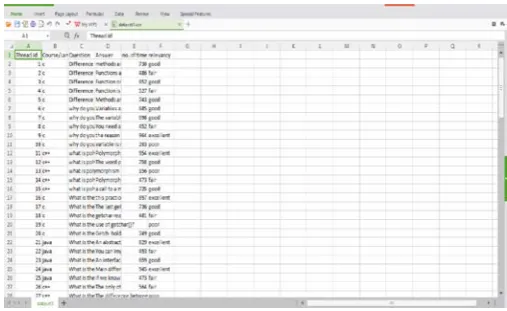
[image:2.595.34.288.604.759.2]The programming languages like c is considered for the formation of the formation of the data-set. These languages are mostly discussed languages when compared to the other as they are the base roots for advanced computer programming languages to learn.
Fig :1 Sample formation of data-set to provide the relevancy.
We used a classification algorithm called “Decision Tree” which supervised learning algorithm (having a pre-defined target variable) that is mostly used in classification problems. It works for both categorical and continuous input and output variables. In this technique, we split the population or sample into two or more homogeneous sets (or sub-populations) based on most significant splitter / differentiator in input variables.
2. EVALUATION
We took a whole set of 1000 questions from different programming languages and we browsed through the discussion forum to our evaluation we got with a total of 950 questions where answered and the rest of 350 questions where unanswered .Approximately about three-fourth of those questions were responded with at-least two to three answers and the rest with the single answers. Since we used historical data for the training of the model , we made sure to use only the the time stamped features and thus only the data was available when each answer was posted.
Evaluation measures
In a machine learning model, the prediction is based on the formation of the data-set . In the data-set the class label or the attribute (number of times accepted) that is to be used plays a vital role . The algorithms are used to provide the a class probability I.e., for the training data-set probabilities are calculated by using both the algorithms .After the comparison of the algorithms ,these calculations estimates the relevancy in the discussion forum. The analysis can provide which discussion forum is best to refer and discuss The attributes like questions ,answers , number of times accepted and relevancy are used .However , the number of times accepted is formally divided and a grading format is assigned to make the better and accurate predictions. The customized grading system was based on the number of times the answer is accepted in the discussion forum and also the up-votes to the answer. The grading system includes four categories they are :
Excellent : the range or the accepted points should be between 750-1000
Good : the range or the accepted points should be between 500-749.
Fair : the fair points are between 230-499
Poor : The range or the accepted points should be between 0-229.
We have use this accepted points to give a proper definition rather than manually giving the grading format tag e.g.,if their is a thread for that class label can be placed manually as it is a implementation based we used the number of times the answer is accepted number suppose the answer is accepted in the range of 750 to 1000 then it is given the grade of “ Excellent ”. Similarly we used this formatting process for the grading in the other attribute’s class label section.
We used many features to get the more accurate predictions while training the model .They are:
Number of times accepted : As we discussed above , the answers of the user that had the most answers accepted is made into grade format and given the specific tag I.e., excellent , good, fair and poor.
Most votes received and most comments : The answers of the users from the discussion forums that have the most up-votes across all the forums and also the most comments respectively is considered.
Further , we trained machine learning models on all the features using “Decision Tree Algorithm” (a branching method to illustrate every possible outcome of a decision)
3. EXPERIMENTAL SETUP
We implemented the whole set-up in the Rapid-miner . Rapid-miner is required to be uploaded with a data-set for further operations .The data-set is manually prepared by using some specific formatting process. The available data-set can be be saved as a CSV file / JSON file or excel file. For our proposed experiment we used a CSV file as shown in Fig.
[image:3.595.316.543.54.258.2]The Rapid-miner provides different platforms to execute your model like Market Based Analysis ,Out-lier detection, Medical fraud detection, Web Analytics etc. We will use a blank process for this experiment and create process model or the design by putting different operators in Fig .2 like retrieve data-set, cross validation rule etc.
Fig.2 Rapid miner with different operators.
Methodology and Result:
The aim of designing in Rapid-miner is to supply the input along with the validation rule to the decision tree operator and see the results. This set-up give the performance evaluation of decision tree classifier. Following steps are to be in followed in Rapid-miner for setting up the process and getting desired result using decision tree classifier.
1. Create new Blank process in Rapid-miner. 2. Load data-set by using Rapid-miner.
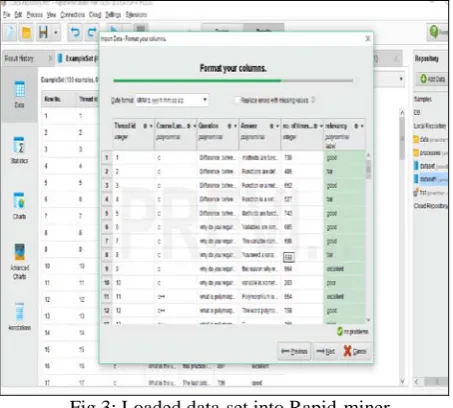
The Rapid miner have different steps while loading the data-set . The data-set should contain a class label and that can be done using change role option that is provided in setting part below the each attribute part .Figure 3 is the loaded data-set into the Rapid-miner for operation.
Fig 3: Loaded data-set into Rapid-miner.
The loaded data is available under ‘Local Repository in Rapid-miner.For plotting of data. A new blank process is added I Rapid-miner.
3. Save the process with the respective file name and 4. Run.
5. When the data-set gets loaded in the Rapid-miner provides some different statistical graphs.
For the proposed experiment we required to design a running model which is done in the designing section of the
Rapid-miner. Following steps are taken in designing the process model.
1) Retrieves the MOOC data-set from the Repository. 2)Cross validation is connected to the data-set and it splits into two subsets. Stratified sampling is used to retain the distribution of label in both training and test stages.j
[image:3.595.40.271.389.548.2]
Fig 4: Process model When we double click on the cross validation we get stages like
A)Training stage and B)Testing stage.
Training stage :
selected and dragged on to the connected link ( from retrieve data-set and mod part ).The connection is established after this process.
Testing stage:
[image:4.595.200.546.36.732.2]This stage is very much important to get the statistical measures where in apply model and performance models are connected and that link is given a final link to the res port in the testing stage. The input for this is taken form the connected port that mod port .
Fig 4: Cross Validation design.
3)Finally, go back to the process model, and make a final connection from cross validation to the res port .
4)Hit on run button.
The statistical measures are provided after the whole process have run successfully.
When the process is run, then the following output is generated in following:
I. Simple Distribution II. Example-set(Apply-Model) III. Performance Vector.
The above three categories have further classification which are
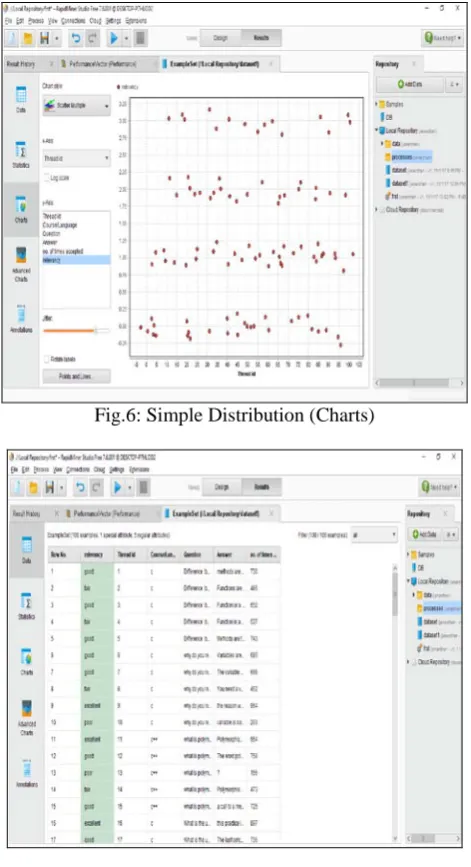
I Simple Distribution a)Description b)Charts(Fig.6) c)Distribution Table
Ii)Example-set(Apply-Model) a)Data(Fig.7)
b)Statistics(Fig.8) c)Charts
d)Advanced Charts
[image:4.595.320.556.53.487.2]III) Performance Vector a)%performance b)Description(Fig.9) c)Annotations.
Fig.6: Simple Distribution (Charts)
Fig.7: Apply model(data)
[image:4.595.38.277.158.347.2]Fig:9 Description
4. CONCLUSION
Discussion forums offer a great platform for students to share their understanding of the subject. However, when it comes to relevancy of answers posted is relatively poor and some are left unanswered. This increases the dropout ratio of the students consistently. Our work presented here shows the analysis of relevancy of the posts to programming subjects of computer science. The relevancy obtained shows fair grade scale that indicates the discussion in the forum is average. This clearly states that by the formation of proper data-set using different discussion forum data we can find the relevancy also.
REFERENCES
[1] J. Brandt, P. J. Guo, J. Lewenstein, M. Dontcheva, and S. R. Klemmer, “Two studies of opportunistic programming: Interleaving web foraging, learning, and writing code,” in Proceedings of the SIGCHI Conference on Human Factors in Computing Systems, ser. CHI ’09. New York, NY, USA: ACM, 2009, pp. 1589–1598.
[2] J. Brandt, M. Dontcheva, M. Weskamp, and S. R. Klemmer, “Examplecentric programming: Integrating web search into
the development environment,” in Proceedings of the SIGCHI Conference on Human Factors in Computing Systems, ser. CHI ’10. New York, NY, USA: ACM, 2010, pp. 513–522.
[3] Smith, M.K., Wood, W.B., Adams, W.K., Wieman, C., Knight, J.K., Guild, N., Su, T.T.: Why peer discussion improves student performance on in-class concept questions. Science 323, 122–124 (2009)
[4] Stephens-Martinez, K., Hearst, M.A., Fox, A.: Monitoring moocs: which information sources do instructors value? In: Proceedings of the First ACM Conference on Learning@ Scale Conference, pp. 79–88. ACM (2014)
[5] Andresen, M.A.: Asynchronous discussion forums: Success factors, outcomes, assessments, and limitations. Educational Technology & Society 12, 249–257 (2009)
[6] Zhu, E.: Interaction and cognitive engagement: An analysis of four asynchronous online discussions. Instructional Science 34, 451–480 (2006)
[7] Wen, M., Yang, D., Rosè, C.P.: Sentiment analysis in MOOC discussion forums: What does it tell us? In: Proceedings of Educational Data Mining (2014)
[8] Huang, J., Dasgupta, A., Ghosh, A., Manning, J., Sanders, M.: Superposter behavior in mooc forums. In: Proceedings of the First ACM Conference on Learning@ Scale Conference, pp. 117–126. ACM (2014)
[9] Anderson, D. Huttenlocher, J. Kleinberg, and J. Leskovec, “Discovering value from community activity on focused question answering sites: A case study of stack overflow,” in Proceedings of the 18th ACM SIGKDD International Conference on Knowledge Discovery and Data Mining, ser. KDD ’12. New York, NY, USA: ACM, 2012, pp. 850–858. [10] L. Mamykina, B. Manoim, M. Mittal, G. Hripcsak, and B.
Hartmann, “Design lessons from the fastest q&a site in the west,” in Proceedings of the SIGCHI Conference on Human Factors in Computing Systems, ser. CHI ’11. New York, NY, USA: ACM, 2011, pp. 2857–2866.
[11] S. L. Emerson, “Usenet: A Bulletin Board for Unix Users,” Byte magazine, vol. 8, no. 10, pp. 219–236, October 1983. [12] H. Rheingold, The virtual community : homesteading on the
electronic frontier. Reading, Massachusetts: Addison Wesley, 1993.