An Area Efficient ECG System for Diagnosis
P. Divya Jeyashree1, S. Padma Priya2
P.G. Student, Department of VLSI DESIGN, Sri Ramakrishna Engineering College, Coimbatore, Tamilnadu, India1
Assistant Professor, Department of VLSI DESIGN, Sri Ramakrishna Engineering College, Coimbatore, Tamilnadu,
India2
ABSTRACT: Electrocardiogram, used as a primary diagnostic tool for cardiovascular diseases. The proposed architecture utilizes the time period of the ECG signals to diagnose the patient. A cleaned ECG signal provides necessary information about the electrical physiology of the heart diseases and ischemic changes that may occur. Noises such as powerline interference, electromyography muscle noise, artifacts due to electrode motion and electrode contact noise are present in an ECG signal. These noises are eliminated using the halfband (HB) filter and the time period of the PQRST wave present in the ECG signal is calculated. This paper presents a new area-efficient Electrocardiogram system with reduced the power consumption and chip area. The ECG system has been synthesized using high level synthesis tool such as XILINX ISE 14.2 and the design flow is made and implemented in SPARTAN 6 to achieve real time operation. The RTL of the design is made to VHDL to integrate the design into SPARTAN 6. The synthesis results yield that the area occupied is only 3%, power utilized to be 0.190 Watts and delay of 42.883ns are measured using XILINX ISE 14.2.
KEYWORDS: Electrocardiogram(ECG), Halfband filter (HB), VHDL language (Very High Speed Integrated Circuit Hardware Description Language)
I. INTRODUCTION
Today in the medical field the electrocardiogram (ECG) is one of the most useful diagnostic tools. It is an easy and inexpensive test that is used for routine assessment of patients with chest pain [1]. To avoid misinterpreting the ECG, the clinician must have a systematic approach [2]. The ECG is affected by large noises such as impulsive noise caused by muscle contraction, power-line interference, motion artifacts and baseline drift due to respiration[1]. Many researchers treated QRS detection as a topic limited to the diagnostic skills of the medical practitioners until the introduction of body area networks (BANs) or body sensor networks (BSNs) [5]. These devices are wearable or implantable devices that are capable of monitoring vital signs continuously. The BSN devices are generally restricted in design by size, power consumption, and computational load. The QRS complex range has a frequency range from about 10 Hz to about 25 Hz [4]. Therefore, QRS detection methods filter the signals prior to the actual detection in order to attenuate other signal components and artifacts, such as P-wave, T-wave, baseline drift, and coupling noise. Whereas the attenuation of the P- and T-wave as well as baseline drift requires high-pass filtering, the suppression of coupling noise is usually accomplished by a low-pass filter. The combination of low and high pass means the application of a bandpass filter, in this case with cut-off frequencies of 10 Hz at the lower end and 25 Hz at the higher end [1]. In many methods, high-and low-pass filtering are carried out separately. Some methods make use only the high-pass filter part. The filtered signals are then used for the generation of a feature signal in which the occurrence of a QRS complex is then detected by comparing the feature against fixed or adaptive thresholds.
II. PHYSIOLOGY OF THE HEART
the ventricles via valves that prevent backflow in a single direction. Blood returned to the right atrium from the body is passed to the right ventricle[6].Then it is passed through the pulmonary artery to the lungs. Here the blood is oxygenated to supply oxygen to the cells present in the human body. The left atrium receives blood from the lungs via the pulmonary vein[7]. The blood is then passed via the mitral valve to the left ventricle and distributed to the body via the aorta artery, thereby completing the blood circulatory pathway in the entire body and through the heart. The cardiovascular system pumps the blood through the systemic system via a network of arteries and veins that carry the blood to and from body tissue[6]. The arteries are blood vessels that carry blood away from the heart to the rest of the body and veins are blood vessels that carry blood to the heart[6].
III. NOISE TYPES ADDED
The following noises are present in the ECG signal that is obtained from the electrodes.
A. EMG INTERFERENCE
EMG interference is the unwanted electrical activity of muscles not related to the movement of the heart that can interfere with the ECG[8]. This can be lessened by reducing movement of the patient. It is typically high in frequency, low in amplitude, and of variable duration.
B. POWERLINE INTERFERENCE NOISE
The ECG signal can be affected by power line interference due to the low output levels of the signal. Induction from neighboring equipment or faulty grounding of equipment can lead to ECG leads picking up 50Hz (or 60Hz depending on country) interference from neighboring power line currents[4]. To reduce or remove this unwanted feature, removal of possible interfering equipment and power cables is an effective approach. It is typically fixed frequency, high in amplitude, and of ongoing duration[9].
C. BASELINE DRIFT
Baseline drift occurs due to respiration and body movement that can produce a low frequency drift from the desired base line of the signal. It is usually low frequency, low in amplitude, and of ongoing duration[9].
D. BASELINE SHIFT
Base line shifts occur abruptly due to sudden movement of the patient. These can be lessened by reducing movement of the patient. They are visible in the signal as a sudden increase or decrease (step change) in the DC offset[4].
E. ELECTRODE CONTACT NOISE
Baseline drift due to variable contact between the electrode and the skin [4].
F. MOTION ARTIFACTS
The baseline shift caused by changes in electrode-skin impedance [6].
G. MUSCLE CONTRACTION
IV. CLINICAL SIGNIFICANCE OF ECG
Electrocardiogram (ECG or EKG) is a record of bio-electric potential variation recorded through time on the body surface that represents heart beats [9]. Every heartbeat cycle is normally characterized by the sequence of waveforms known as a P wave, QRS complex and a T wave. Time intervals between those waveforms as well as their shapes and orientation are representing physiological processes occurring in heart and autonomous nervous system [4]. Although today in medical centres advanced equipment and tools are used for detecting heart-beat arrhythmias and other cardiovascular abnormalities, visual inspection of the multi-channel (lead) ECG record is still the first step taken by cardiologists in diagnosis process. Pre- treatment indicated that there was a significant improvement in patient outcome based on earlytreatment [5]. Pre-hospital ECG is a test that may potentially influence the management of patients with acute myocardial infarction through wider, faster in-hospital utilization of re-perfusion strategies and greater usage of invasive procedures, factors that may possibly reduce short term mortality [5].
Fig. 1.ECG signal complex wave
Medical literature suggests clinical importance of ECG not only in identifying heart problems itself, but also other health issues that leave a trace on ECG as a symptomatic phenomenon like ECG patterns reflecting antidepressant treatment [6].
QRS complex is the most striking waveform within the electrocardiogram (ECG) as it reflects the electrical activity within the heart during the ventricular contraction [5].
The time of occurrence of QRS complex as well as its shape provides much information about the current state of the heart.
Normal QRS width is 70-100 ms (a duration of 110 ms is sometimes observed in healthy subjects).
The QRS width is useful in determining the origin of each QRS complex.
A QRS duration > 120 ms is required for the diagnosis of bundle branch block or ventricular rhythm [6].
The amplitudes of all the QRS complexes in the limb leads are < 5 mm.
V. BASIC ARCHITECTURE OF THE ELECTROCARDIOGRAM SYSTEM
1) Initially the noisy ECG signals are obtained from the electrode.
2) The noises are eliminated using the halfband filter and the noiseless ECG signals are obtained. 3) These signals are then analysed to determine their time period.
4) These signals now may contain unwanted spikes. 5) These spikes are again filtered.
6) The resulting signals are now analysed to find out the QRS complex peak. 7) The QRS complex time period is used to diagnose the patient.
VI.HALFBAND FILTER
A digital halfband filter (HBF) , in its basic form with real-valued coefficients, is a lowpass filter with one passband and one stopband region of unity or zero desired transfer characteristic, respectively, where both specified bands have the same bandwidth[10]. The zero-phase frequency response of a non-recursive (FIR) halfband filter with its symmetric impulse response exhibits an odd symmetry about the quarter sample rate (Ω = π2) and half magnitude point, where Ω = 2π f / fn represents the normalized (radian) frequency and fn = 1/T the sampling rate. The same symmetry holds true for the squared magnitude frequency response of minimum-phase (MP) recursive (IIR) halfband filters. As a result of this symmetry property, the implementation of a real HBF requires only a low computational load since, roughly, every other filter coefficient is identical to zero[2]. Due to their high efficiency, digital halfband filters are widely used as versatile building blocks in digital signal processing applications.
1) A halfband filter is used to filter the incoming ECG signals.
2) The halfband filter is preferred because it utilizes less number of adders and multipliers hence providing the advantage of reduced area.
3) Biomedical devices always have the requirement that the device should have a smaller size and half band filter satisfies this requirement.
4) The ECG signals contain noises such as powerline interference, electro-myographic muscle noise, artifacts due to electrode motion and electrode contact noise.
5) The halfband filter is used to filter the ECG signals based on threshold values.
6) The threshold value is set based on the predefined human ECG signal value.
Fig.3. Architecture of the Halfband filter
7) Order of the filter is N =7. 8) No of taps =8.
9) Coefficients used are 6, 17,33,47.
VII.RULES FOR QRS COMPLEX DETECTION
1) Ignore all peaks that precede or follow larger peaks by less than 196ms (or 306bpm).
2) If a peak occurs check to see whether the raw signal contains both positive and negative slopes. 3) If true, report a peak is being found.
5) If the peak is larger than the detection threshold classify it as QRS complex, otherwise it is identified as noise. 6) If no QRS complex has been detected within 1.5 R-to-R intervals, but there is a peak that was larger than half
the detection threshold, and that peak followed the proceeding detection by atleast 360ms, classify that peak QRS complex.
Figure .4. The QRS complex wave
VIII.TIME PERIOD DETERMINATION
• Time period determination is useful for ECG signal analysis since it provides a new dimension to analyse the ECG signals and provide information for diagnosis.
• The electrodes in the electrocardiogram provide only the voltage information of the body at particular points.
• By determining time period of the signals the depth of a heartbeat can be analysed.
Figure .5. Architecture of the time period determination block
IX.MATLAB ANALYSIS OF THE QRS COMPLEX
1) The Matlab tool is used to accept the incoming noisy ECG signals and display the noiseless ECG signals. 2) The Matlab tool interfaces the Arduino ATMEGA 360 board with the Spartan 6 development board.
3) The Arduino Board is used to convert the analog ECG signals into digital format, hence the ADC module is utilized from the Arduino board.
X. RESULTS AND DISCUSSION
A. SIMULATION AND SYNHESIS RESULTS OF HALFBAND FILTER
(a) (b)
(c) (d)
Figure 6 (a) Simulation result of halfband filter at 10000ns (b) Area Analysis of halfband filter (c) Power Analysis of the halfband filter (d)Timing Analysis of the halfband filter
B. OUTPUT OF SPARTAN 6 FPGA USING MIMASV2 CONFIGURATION TOOL IN MATLAB
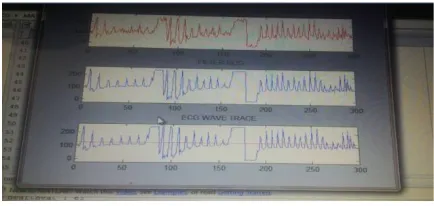
The figure 6 (e) shows the input noisy ECG signal and the filtered ECG signal and the ECG trace.
Figure 6 (e) Output of MATLAB tool
XII. CONCLUSION
The Electrocardiogram system is designed in Spartan 6 fpga development board. The incoming noisy ECG signals are filtered using the halfband filter and is simulated using Xilinx ISE and hardware implemented using Spartan 6. The synthesis results reveal that the area occupied by the design is 183 LUTs, the power analysis shows that 0.027 Watts of power is utilized and the timing analysis reveals that 11.289 ns is consumed.
REFERENCES
[1] Woo Jin Oh and Yong Hoon Lee., “Implementation of Programmable Multiplier less FIR Filters with Powers-of-Two Coefficients” IEEE transactions on circuits and systems-i1 analog anddigital signal processing, vol. 42, no. 8, Aug 2012.
[3] Per Löwenborg, and Håkan Johansson.,” Minimax Design of Adjustable-Bandwidth Linear-Phase FIR Filters” IEEE transactions on circuits and systems-i1: regular papers, vol. 53, no. 2, Feb 2010.
[4] Hwan-Rei Lee, Chein-Wei Jen and Chi-Min Liu.,” A New Hardware-Efficient Architecture for Programmable FIR Filters” IEEE transactions on circuits and systems-11: analog and digital signal processing, vol. 43, no. 9, Sept 2013.
[5] C. Bruser, K. Stadlthanner, A. Brauers and S. Leonhardt, “Applying machine learning to detect individual heart beats in ballistocardiograms”, IEEE EMBC, 2010.
[6] X.L. Aubert and A. Brauers, “Estimation of vital signs in bed from a single unobtrusive mechanical sensor: Algorithm and real-life evaluation”, IEEE EMBC, 2008.
[7] H. Kimura, H. Kobayashi, K. Kawabata and H. F. Van Der Loos, “Development of unobtrusive vital signs detection system using conductive fiber sensors”, IEEE / RSJ Int. Conf. on Intelligence Robotics and Systems, 2004.
[8] Danny Smith, Kristian Solem, Pablo Laguna, Juan Pablo Martinez and Leif Sornmo, “Model-Based detection of heart rate turbulance using mean shape information”, IEEE Transactions on Biomedical Enginering, 2010.
[9] YC Chesnokov, D Nerukh and RC Glen, “Individual Adaptable Automatic QT detector”, IEEE Conference on Computers in Cardiology, 2006.