INVESTIGATION
Dynamic Mutation
–
Selection Balance
as an Evolutionary Attractor
Sidhartha Goyal,* Daniel J. Balick,†Elizabeth R. Jerison,‡Richard A. Neher,§
Boris I. Shraiman,*,†,1and Michael M. Desai‡
*Kavli Institute for Theoretical Physics and†Department of Physics, University of California, Santa Barbara, California 93106,
‡Departments of Organismic and Evolutionary Biology and of Physics, and Faculty of Arts and Sciences Center for Systems
Biology, Harvard University, Cambridge, Massachusetts 02138, and§Max Planck Institute for Developmental Biology, 72076 Tübingen, Germany
ABSTRACTThe vast majority of mutations are deleterious and are eliminated by purifying selection. Yet infinite asexual populations, purifying selection cannot completely prevent the accumulation of deleterious mutations due to Muller’s ratchet: once lost by stochastic drift, the most-fit class of genotypes is lost forever. If deleterious mutations are weakly selected, Muller’s ratchet can lead to a rapid degradation of populationfitness. Evidently, the long-term stability of an asexual population requires an influx of beneficial mutations that continuously compensate for the accumulation of the weakly deleterious ones. Hence any stable evolutionary state of a population in a static environment must involve a dynamic mutation–selection balance, where accumulation of deleterious mutations is on average offset by the influx of beneficial mutations. We argue that such a state can exist for any population sizeNand mutation rateUand calculate the fraction of beneficial mutations,e, that maintains the balanced state. Wefind that a surprisingly lowesuffices to achieve stability, even in small populations in the face of high mutation rates and weak selection, maintaining a well-adapted population in spite of Muller’s ratchet. This may explain the maintenance of mitochondria and other asexual genomes.
P
URIFYING selection maintains well-adapted genotypes in the face of deleterious mutations (Haigh 1978). Yet in asexual populations, random genetic drift in the most-fit class of individuals will occasionally lead to its irreversible extinction, a process known as Muller’s ratchet (Muller 1964; Felsenstein 1974). The repetitive action of the ratchet leads to the accumulation of deleterious mutations, despite the action of purifying selection. This ratchet effect has been extensively analyzed (Gessler 1995; Charlesworth and Charlesworth 1997; Gordo and Charlesworth 2000a,b; Stephan and Kim 2002; Jain 2008) and has been observed in experiments (Chao 1990; Duarte et al.1992; Andersson and Hughes 1996; Zeylet al.2001) and in nature (Rice 1994; Lynch 1996; Howe and Denver 2008). In small populations when deleterious mutation rates are high or selection pres-sures are weak, the ratchet can proceed quickly, causing rapiddegradation of asexual genomes (Gabriel and Burger 1993; Lynch et al. 1993, 1995). Hence Muller’s ratchet has been described as a central problem for the maintenance of asexual populations such as mitochondria (Loewe 2006). Avoiding this mutational catastrophe is thought to be a major ben-efit of sex and recombination (see Barton and Charlesworth 1998 and De Visser and Elena 2007 for reviews).
However, new studies indicate that natural and laboratory asexual populations do not always melt down as predicted. For example, Silander et al.(2007) recently showed that even very small laboratory populations of phage with high muta-tion rates tend towardfitness plateaus. In addition, a recent comparison of human, chimpanzee, and rhesus Y chromo-somes demonstrated that after an initial period of degrada-tion following the halt of recombinadegrada-tion, gene loss in the human Y chromosome effectively stopped (Hughes et al. 2012). Finally, theoretical work by Loewe (2006) has revealed several “genomic decay paradoxes” (i.e., species that persist despite predicted unsustainable genomic decay), including human mitochondria.
These results argue for a reexamination of the assump-tions behind the classic ratchet model. In the absence of Copyright © 2012 by the Genetics Society of America
doi: 10.1534/genetics.112.141291
Manuscript received April 17, 2012; accepted for publication May 24, 2012 Supporting information is available online at http://www.genetics.org/content/ suppl/2012/06/01/genetics.112.141291.DC1.
1Corresponding author: Kavli Institute for Theoretical Physics, University of California,
recombination (Bell 1998) or epistasis (Kondrashov 1994), the only forces that can check the deterioration of fitness due to the accumulation of deleterious mutations are back and compensatory mutations (Schultz and Lynch 1997). These mutations are typically assumed to be rare and are either neglected in models of the ratchet or assumed to only slightly slow its rate (Haigh 1978; Kondrashov 1995; Lande 1998; Bachtrog and Gordo 2004). However, as most re-cently discussed by Charlesworth (2012), it is natural to expect that these back and compensatory mutations become more common as a population declines infitness. At a min-imum, back mutations that revert deleterious point mutations will cause the proportion of available beneficial mutations to increase linearly with the accumulation of these deleterious point mutations. Recent experimental work suggests that the pool of available compensatory mutations in fact increases even faster than this (Silander et al. 2007; Barrick et al. 2010). Hence, based on experimental evidence it is reason-able to assume that the probability that a random mutation is beneficial increases with decreasing absolute fitness (Escarmiset al.1999; Estes and Lynch 2003; Poon and Chao 2005; Poonet al.2005; Schoustraet al.2009). Equivalently, but perhaps more intuitively, one expects the probability that a random mutation is beneficial to decrease with in-creasingfitness.
Provided that beneficial (back and compensatory) muta-tion rates do increase as fitness declines, Muller’s ratchet will eventually come to a halt. Once the fraction of beneficial mutations is high enough to counter the ratchet, the popu-lation will remain in a stable dynamic equilibrium state, as illustrated in Figure 1. Qualitatively, we can see that the state is stable from the following argument: let the critical fraction of beneficial mutations needed to precisely counter the ratchet and maintain the equilibrium be ec. In a poorly adapted population, a higher fraction of mutations will be beneficial, e . ec. This excess of beneficial mutations will push the population toward higherfitness. At the same time, adaptation will deplete the available pool of beneficial muta-tions, untilecis reached, as shown in Figure 1. Conversely, in an“overadapted”population, we expecte,ec, so that del-eterious mutations dominate, reducing population fitness until ecis recovered. Thus we expect the dynamic mutation– selection balance point to be a stable evolutionary“attractor.” Furthermore, since back and compensatory mutations are selectively favored, they can balance deleterious mutations even while they are relatively rare, thereby maintaining a well-adapted population. This mechanism may be respon-sible for the fitness plateaus observed in the natural and laboratory populations mentioned above. Moreover, we ex-pect these“treadmill”dynamics, in which continualfixation of deleterious mutations due to the ratchet is exactly offset by fixation of back and compensatory mutations, to be the generic null state of an asexual population under purifying selection. Characterizing this state is an important step to-ward predicting the patterns of genetic diversity these pop-ulations maintain.
Several earlier studies have considered aspects of these treadmill dynamics in which both beneficial and deleterious mutations accumulate, including simulations by Wagner and Gabriel (1990), Antezana and Hudson (1997), and Schultz and Lynch (1997); experimental work by Silander et al. (2007); and a combination of simulations and analytical work by Rouzine et al.(2003, 2008) and Manrubia et al. (2003). Theoretical work by Poon and Otto (2000) also considered compensatory mutations using Fisher’s geomet-rical model, and analytical work by Lande (1998) described alternatefixation of deleterious and beneficial mutations in small sexual populations. These studies have all shown that finite populations settle tofitness plateaus in the presence of purifying selection. However, the nature of this dynamic equilibrium state remains poorly understood: the critical fraction of beneficial mutations ec, the meanfitness of the population at equilibrium, and the distribution about that mean all have yet to be characterized.
In this article, we present a detailed analytical description of the nature of the dynamic equilibrium mutation–selection balance. Crucially, we decouple the problem of the global stability of the dynamic balance state (which depends on how the rate of compensatory mutations changes with ab-solute fitness) from the properties of the dynamic balance state itself. We accomplish this by treating the probability that a mutation is beneficial as an independent parametere. The dependence ofeon absolutefitness becomes important for the evolutionary dynamics of the population away from the equilibrium point, but not at thefixed point itself. This allows us to identify the dynamic balance conditione=ec and determine how it depends on population size, mutation rate, and strength of selection, independent of any assump-tions regarding the dependence of e on absolute fitness. Figure 1 The relationship between the fraction of mutations that are beneficial,e, and the absolutefitness of the population, v. A poorly adapted population (green) with v,vcande,ecwill adapt toward
We show that even a very modest rate of compensatory mutations is sufficient to forestall Muller’s ratchet. Even for remarkably high mutation rates and small population sizes, dynamic balance can be maintained with most muta-tions being deleterious. Muller’s ratchet notwithstanding, selection enables rare beneficial mutations to compensate for more frequent deleterious mutations and to maintain a well-adapted population.
Materials and Methods
Simulation methods
Our simulations are done using a custom-written Python code available on request. We implement a discrete-time Wright–Fisher model where the population is represented by a vector nkwith elements corresponding to the number
of individuals in fitness class k. Each generation consists of separate selection and mutation steps. To implement se-lection, the vector nk is multiplied byesðk2kÞ2a to obtain a
vector ~nk containing the expected number of offspring in
class k. Hereðk2kÞ is the fitness of classk relative to the population mean, and a¼ ðP nk2NÞ=N maintains an
ap-proximately constant population size aroundN.
Our model is simplified by using beneficial and delete-rious mutation with effect 6s and mutation rate Ue and U(12e), respectively. To implement mutation, we calculate the probabilityP(i,j) of a genome being hit byibeneficial and jdeleterious mutations, which are Poisson distributed. This mutation matrix is then applied ton~k;i.e., the parts of ~
nk are moved up or down according to the net number of
mutations they accrued in this time step. Having constructed the expected number of individuals in fitness class k after selection and mutation, we draw a population sample from each class from a Poisson distribution. If necessary, the pop-ulation is recentered in the discrete vectornk. This prevents
occupied classes from running off the grid due to accumu-lated increase or decrease in their absolutefitness.
The above process is repeated for a specified number of generations. The speed of adaptation, v (i.e., the rate of change of population-averagedfitness), and other features of the dynamics are measured after an equilibration time to remove transient effects from the initial conditions. In the parameter regimes studied, we found that 104generations were generally sufficient for establishing a steady“traveling wave”with velocityvdependent oneand other parameters. To solve for ec(U, N, s), we rerun the simulation while iteratively adjusting eto get vas close to zero as possible. Sincevis afluctuating quantity,eccan be determined only with limited accuracy, but this can be improved by increas-ing the number of generations for each run.
We have also run simulations in which e increases with decreasing fitness (i.e., assuming ek = e0 2 ck, where c is a small constant) to demonstrate that the population indeed evolves toward the values ofksuch that the nose of the dis-tribution is at the appropriateecfor local dynamical balance.
Model
Our analysis is based on the standard discrete-generation Wright–Fisher model with population sizefixed atN. For the bulk of this article, we assume that beneficial and deleteri-ous mutations increase or decreasefitness by the same con-stant amount s (wheres . 0 by convention). In a section below, we use simulations and bounding analysis to show that similar behavior occurs when beneficial and deleterious mutations have differentfitness effects. In our simple model with a singles, each individual can be described by its num-ber, k, of deleterious mutations relative to the perfectly adapted state. We definekto be the mean number of dele-terious mutations per individual, so that an individual withk deleterious mutations has fitness sðk2k Þ relative to the mean, as shown in Figure 2. The population can be charac-terized by the number of individuals nk in each of these
fitness classes. We define U to be the total mutation rate andeto be the fraction of mutations that are beneficial, so that the beneficial mutation rate isUb=Ueand the delete-rious mutation rate isUd=U(12e).
Although mutations and genetic drift are stochastic pro-cesses, in the bulk of the distribution—wherefitness classes contain many individuals—the population dynamics are well captured by a deterministic approximation. On average, the number of individuals infitness classkevolves as
dnk
dt ¼s
k2k
f
nkI
2Unk
f
II
þUdnk2
f
1 IIIþUbnkþ
f
1 IV: (1)
The terms on the right-hand side of this equation describe the different processes acting onfitness classk: (I) the effect of selection relative to the mean fitness, (II) mutational load, (III) deleterious mutations from more-fit individuals, and (IV) beneficial mutations from less-fit individuals. We assume that the selective effect of a single mutation is small,
s1.
Although we expect that the probability a mutation is beneficial will depend on the absolutefitness and hence on k, as discussed in the Introduction, we assume e to be an independent constant parameter. The neglect of the k de-pendence ofeis a reasonable approximation because at any given time there will be only a relatively narrow range ofk present in the population. The kdependence ofebecomes important away from the dynamic-balance point corre-sponding to the stationary solution of Equation 1, since on longer timescales kand hence the population meanfitness begin to increase or decrease significantly. This depen-dence—assuming thate increases with decreasing absolute fitness—ensures the global stability of the dynamic balance point, making it an evolutionary attractor. Yet our approxi-mation that e is locally constant allows us to accurately compute theec, and corresponding distributionnk, at which
of the dynamic equilibrium remains accurate; these simula-tions are described in supporting information, File S1.
We also note that by defining fitness relative to the population mean in Equation 1, as is standard in Wright– Fisher dynamics, we neglect the possible dependence of population size on absolutefitness, an effect that could po-tentially lead to mutational meltdown. We return to this possibility in theDiscussion.
Analysis
In steady state, thefitness distributionnkstays constant on
average: dnk=dt¼0 for all k. Solving Equation 1 for the steady state in the case ofe= 0 leads to the familiar muta-tion–selection balance (Haigh 1978) with a Poisson distri-bution offitness,
nk¼
Ne2l
k! l
k; (2)
wherek= 0 corresponds to the most-fit class. Here we have defined
l¼U
s: (3)
This dimensionless ratio is a key parameter that appears often in the analysis below.
The deterministic approximation (Equation 1) corresponds to an infinite population where Muller’s ratchet (i.e., the stochastic extinction of thefittest genotype) does not oper-ate. In the absence of such stochastic extinction, any ben-eficial mutation from the fittest class would move the distribution toward higher fitness, in conflict with the
steady-state assumption. Hence, in infinite populations, steady state can be achieved only withec= 0. Conversely, in afinite population where thefittest class can be lost due to genetic drift, Muller’s ratchet will eventually lead to a de-crease in fitness if no beneficial mutations are available. Thus we must haveec.0 to be in the dynamic steady state. A correct description of the dynamic equilibrium state therefore requires a suitable treatment of genetic drift. These stochastic effects are particularly important in the most-fit edge of the distribution, which we call the“nose,” where the number of individuals with a particularfitness is small. Our analysis is based on matching a stochastic treat-ment of the nose with a deterministic description of the bulk of thefitness distribution (as governed by Equation 1 with e.0). The stochastic dynamics of the nose are determined by two competing processes: the random extinction of the most-fit classvs. the establishment of a new more-fit class due to a beneficial mutation. At stationarity, the rates of these two processes have to be equal; this condition deter-mines the number of individuals in the nose class. We match this stochastic condition with the number of individuals in the nose class calculated based on the deterministic distri-bution. This determines the critical fraction of beneficial mutationsecas a function of the population parameters.
The Shape of the Fitness Distribution
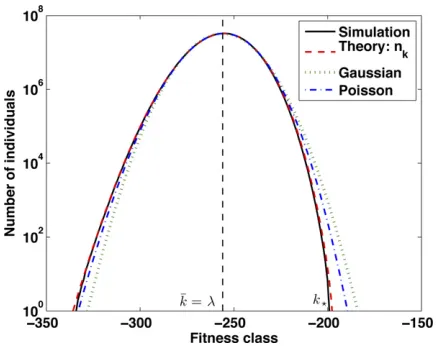
We begin with a deterministic analysis of the shape of the fitness distribution at steady state. Since only relative fitnesses matter, it is convenient to set the origin ofksuch that the mean of thefitness distribution isk¼l. InFile S1, we solve for the steady state of Equation 1, using Fourier analysis. Wefind
Figure 2 (A) Schematic illustration of thefitness distribu-tion within a populadistribu-tion. We refer to the most-fit class as the“nose”of the distribution. (B) A typical realization of the stochastic dynamics at the nose. In the event of ex-tinction of the nose,n1becomes the new nose and relative
nk¼Ne2lð122eÞþk log
ffiffiffiffiffiffiffiffiffiffiffiffiffi
ð12eÞ=e p
Jkð2aÞ; (4)
whereJkdenotes the Bessel function of orderkand we have
defined a[lpffiffiffiffiffiffiffiffiffiffiffiffiffiffiffieð12eÞ. A comparison of this solution to simulation results is shown in Figure 3. Forkin the vicinity of k, this distribution is approximately Gaussian with vari-ance s2
k¼lð122eÞ. While the low-fitness tail of the
distri-bution decays less rapidly than a Gaussian, the high-fitness side decays more rapidly than a Gaussian.
It is important to note that in the deterministic limit there is no true stationary state for arbitrarye.0; this manifests itself in the loss of positivity of the solution given by Equa-tion 4 for high-fitness classes above the position of the nose class. While the position of the nose, which we call k⋆,
requires a more careful treatment, Equation 4 gives a very accurate description of the bulk of the fitness distribution (i.e.,nkfork.k⋆).
To determine the position of the nose,k⋆, we observe that
if classes with k ,k⋆carry no individuals, fitness classk⋆
does not receive an influx of mutations from the more-fit classk⋆21. That is, term III in Equation 1 is absent,
yield-ing ðk2k⋆2lÞnk⋆þlenk⋆þ1¼0. This, along with Equation 4, gives the following equation fork⋆:
k⋆Jk⋆ð2aÞ ¼a Jk⋆þ1ð2aÞ: (5)
This must in general be solved numerically. However, in File S1 we show that
k⋆
l2e for el2 1
2lpffiffiffiffiffiffiffiffiffiffiffiffiffiffiffiffiffieð12eÞ for el2 1: (6)
To gain some intuition into the significance ofk⋆, note that
k⋆= 0 in an infinite population withec= 0. In this case, the fitness distribution is the familiar Poisson distribution and thefittest class contains a fractione2lof all individuals. In afinite population,Ne2l,1 for sufficiently largel=U/s,
which implies that at steady state the mutation-free geno-type is typically absent and therefore k⋆ . 0. This
adjust-ment ofk⋆forfinite population size is reflected in Equation
6, which states that the most-fit class gets closer to the population mean aseincreases.
The Stochastic Matching Condition
We seek to determine thee=ecat which the distribution is stationary for a given finite N. Since the most-fit class is populated by a comparatively small number of individuals, fluctuations due to genetic drift may change its occupancy significantly. In particular, the population at the nose can go extinct, in which case the nextfitness class becomes the new nose. Alternatively, a lucky beneficial mutation can cause the nose to advance by one class. Stationarity can therefore be achieved only in an average sense: the rate of advancing the nose has to equal the rate of extinction of the nose.
Since these two processes depend sensitively on the number of individuals in the nose, requiring the equality of extinction and establishment rates determines the aver-age size of the population of the nose,nk⋆, as a function ofU, s, and e. We match this nk⋆ to the deterministic solution determined above tofindec(N,s,U).
The nature of the dynamics at the nose depends qualita-tively on nk⋆: If nk⋆ is large enough that its dynamics are dominated by selection, it is rarely lost and Muller’s ratchet is slow. Conversely, ifnk⋆ is small, the class turns over neu-trally and is easily lost and reseeded. We begin by considering the slow-ratchet regime, where nk⋆ is relatively large, and then turn to the opposite fast-ratchet regime.
Slow-ratchet regime
In the regime where nk⋆s.1, thefittest class is only rarely lost due to drift. Note that this regime corresponds toel2,1, which implies nk⋆Ne2
l
and k⋆ 0. In this regime the
mean extinction rate for the nose, r2, is due to rare large
fluctuations that overcome the“restoring force”due to selec-tion trying to preserve mutaselec-tion–selection balance. Estimates of this extinction rate have been obtained via diffusion theory (Haigh 1978; Gordo and Charlesworth 2000a; Stephan and Kim 2002; Jain 2008; Neher and Shraiman 2012) and have the form (seeFile S1)r2e2gsnk⋆gs ffiffiffiffiffiffiffiffiffiffiffiffiffiffiffiffiffigsnk
⋆=p
p
;where g is a“phenomenological”parameter characterizing the ef-fective strength of selection on the fittest class, introduced by Haigh (1978) and used in Gordo and Charlesworth (2000a), Stephan and Kim (2002), and Jain (2008) (see below).
To impose our stochastic condition, we must also cal-culate the rate at which a new more-fit class establishes, r+. This is given by the product of the rate at which new beneficial mutants are generated and the probability they establish, rþ¼nk⋆UbPest. Since k⋆ 0 in this regime, we
havePest2s. Equating the two rates yields the stochastic condition
Figure 3 Comparison of thefitness distribution obtained in simulations with the analytic result Equation 4 and a Gaussian with equal mean and variance. The simulation result is the medianfitness distribution observed over 106
ec¼ g2 2U=s
e2gsNe2l
ffiffiffiffiffiffiffiffiffiffiffiffiffiffiffiffi
pgsNel
p : (7)
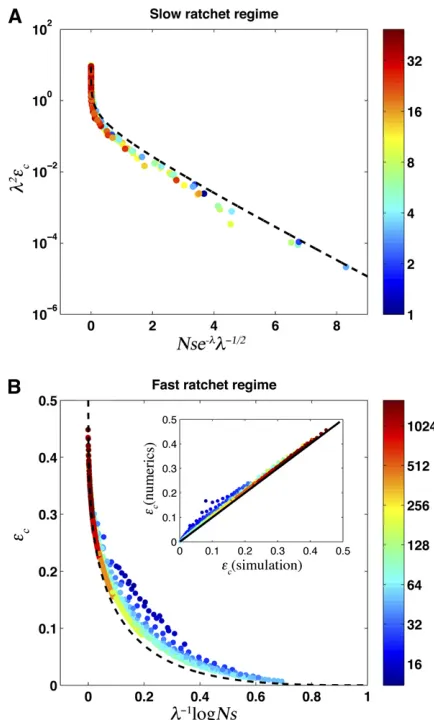
This condition suggests that ec in the slow-ratchet regime is a function of a combination of population parameters: lec(U,N,s)/g2f(gsNe2l). Wefind that contrary to earlier studies (Haigh 1978; Gordo and Charlesworth 2000a), con-stantgis not consistent with simulations. Instead, as shown in Figure 4A, the simulation data in the presented range are well explained byg¼1=pffiffiffil, which for values ofl consid-ered, is a good approximation to the more general expres-sion found in Neher and Shraiman 2012. This empirical dependence is, however, consistent with the approximation g 0.6 used by Gordo and Charlesworth (2000a), within the range of parameters ð0:4&1=pffiffiffil&0:8Þ addressed by their study. Since we consider a much broader range of parameters ð0:1&1=pffiffiffil&1Þ, accounting for the depen-dence ofg onU/s becomes important. Our analytical solu-tion Equasolu-tion 7, shown as a dotted line in Figure 4A, is in good agreement with the simulation data across this wide range of parameters.
In this regime, ec depends exponentially on Nse2l and hence rapidly approaches zero aslbecomes small, approach-ing the infinite population limit where Muller’s ratchet does not operate.
Fast-ratchet regime
For larger mutation rate, smaller population size, or weaker selection, the occupancy of the most-fit class decreases, thereby increasing its rate of extinction. Consequently, a higher rate of beneficial mutations (larger e) is required to match the extinction rate. The resulting rapid turnover of the population at the nose leads to the failure of the quasi-static approximation we used in the slow-ratchet regime.
As the occupancy of the nose decreases, in particular whennk⋆s&1, the dynamics of thefittest class are governed by drift. The rate of extinction, r2, can therefore be
esti-mated from neutral diffusion: r21=ð2nk⋆Þ. The rate at which a new more-fit class is established is given by the same formula as before, rþ¼eUnk⋆Pest. However,Pest now refers to the probability that a new mutant lineage reaches 1=2ðk⋆þ1Þs individuals. At this point, the lineage crosses
over from stochastic to deterministic dynamics, entering the domain described by the deterministic solution Equation 4. ThusPest= 2(k⋆+ 1)s. Equatingr2=r+yields the stochas-tic condition
nk⋆ 1
ffiffiffiffiffiffiffiffiffiffiffiffiffiffiffi
4eUsk⋆
p : (8)
This condition, together with the solution Equation 4 for the distribution, allows us to determineec(N,s,U). As shown in Figure 4, our solution Equation 8 is in excellent agreement with simulations for most of the data. However, our solution overestimates ecfor populations with small population size and smalllthat still satisfynk⋆s&1. A better description in
this regime will require a more careful analysis offl uctua-tions beyond the nose.
Large population size limit
Large populations can maintain a well-adapted genome withec1=2 even for moderately largel. In the limit of large populations and large U/s, with the limit taken so that ecl2 1 while ec1=2, the matching condition reduces to pffiffiffiffieclog ec¼l21 logðNse2lð122ecÞÞ. This equa-tion has the approximate soluequa-tion
ec z
2
log2½z=logðz21Þ; 2z[12 log Ns
l : (9)
This result can be made more precise through iteration (see File S1for derivations and comparisons to simulation data). Figure 4 The critical proportion of beneficial mutations,ec, across both slow- and fast-ratchet regimes for many combinations ofU,s, andNfor the two regimes. Simulation results are shown as points, with color in-dicating l. (A) Slow-ratchet regime. We show ecl2 as a function of
ð1=pffiffiffilÞsNe2lfore
cl2,1. The dashed black line is the analytic solution
given by Equation 7. (B) Fast-ratchet regime. Note thatecis a function of
l21logNsand even in small populations approachese
c1=2 only for
very largel. The dashed black line shows the asymptotic solutionecin the large population size limitðecl21Þ, Equation 9. The inset compares the
Note here thatecdepends only very weakly onNsand onl, in contrast to the slow-ratchet regime where ec declines exponentially withNse2l.
High mutation rate or weak purifying selection
In this limit, the dynamic equilibrium tends toward the state where beneficial and deleterious mutations are equally frequent,e¼1=2. This corresponds to a population that can no longer maintain a well-adapted state. InFile S1, we de-rive an approximate expression forecin the fast-ratchet re-gime in the limit of largel:
ec1 22
3 4llog Ns
1=3
: (10)
From this expression we can immediately determine the point at which the population can no longer maintain a well-adapted state, as defined by a maximum fraction of be-neficial mutations,emax. To haveec,emax, we require
l log Ns#
3 4
1 0:52emax
3
; (11)
valid foremax*0.2. Note that foremax= 1/4, the right-hand side (RHS) of this expression is 48; foremax= 1/3, the RHS is 162. Thus even small populations withNs*1 can main-tain relatively well-adapted genomes in the face of high mutation rates and weak selection (i.e., whenUsso that l1).
Differentfitness effects for beneficial and deleterious mutations
Our analysis to this point has assumed that both beneficial and deleterious mutations have the same fitness effect s. However, compensatory mutations often only partially com-pensate for the cost of a deleterious mutation. Hence bene-ficial mutations may tend to have a smaller effect onfitness than deleterious mutations. The opposite case, where bene-ficial mutations have larger effects than deleterious muta-tions, may also be relevant, as weak-effect deleterious mutations accumulate more rapidly and for some effect dis-tributions may dominate. We now consider the effects of these differences in thefitness effects of beneficial and del-eterious mutations. We denote the effect of a deldel-eterious mutation by sd and the effect of a beneficial mutation by sb, where by convention bothsdandsbare positive.
When sd6¼sb, there still exists a critical value ofe=ec corresponding to a dynamic equilibrium state, which (pro-vided as always thateincreases asfitness decreases) is glob-ally stable. However, the shape of thefitness distribution in this equilibrium will be different from that calculated above, and the criticalecwill also change. Fortunately, our analysis of the single-s model places bounds on this new criticalec that applies forsd6¼sb. To see this, wefirst define theecthat corresponds to a particular single-s model (as calculated above) to beec(s). Now consider the casesb,sd. The critical
ecfor this more complex situation must be less thanec(sb), because stronger-effect deleterious mutations can only de-crease ec(stronger selection against deleterious mutations cannot speed their accumulation). On the other hand, the criticalecmust also be greater thanec(sd), because weaker-effect beneficial mutations can only increase ec. A similar argument leads to analogous bounds for the casesb.sd.
These simple bounding arguments imply that the critical ecis at mostec(sb) orec(sd), whichever is greater. Since we have seen thatecremains small even for remarkably smalls and large U, this can still correspond to a relatively well-adapted state. Provided that deleterious mutations and the corresponding compensatory mutations do not have widely differing fitness effects, these bounding arguments also constrainecto a narrow range. Thus although the quantita-tive details of the stable equilibrium state change whenever sb6¼sd, the main qualitative conclusions of our single-s anal-ysis still apply.
To provide a more precise analysis of how ecdepends on bothsbandsd, we use simulations to compareecforsb= sd/z withz = 0.5, 1, 2 and show that in the slow-ratchet regime ec(z) z2ec(1), demonstrated by the collapse of simulation data for different parameter values onto the same curve, as shown in Figure 5. This behavior in the slow-ratchet regime is quite intuitive, as the rate of forward motion of the nose increases as s2
b. Here one factor of sb arises from the establishment probability and the other from the size of the forward step due to each established beneficial mutation. Hence ifsb/sb/z, the rate of bene-ficial mutations necessary to maintain dynamic balance must increase by z2. Remarkably, this simple scaling ap-proximation holds well into the crossover to the rapid-ratchet regime.
Wefinally note that of course in general not all beneficial mutations will have the same fitness effect sb nor will all deleterious mutations have the same cost sd. Instead, the effect of any individual mutation will be drawn from some distribution of beneficial or deleterious fitness effects. The values of sb andsd then represent some weighted average effect of a beneficial or deleterious mutation. A full analysis of this more complex situation is beyond the scope of this article, but we return to this issue, qualitatively, in the
Dis-cussionbelow.
Discussion
Charlesworth 2000a,b; Stephan and Kim 2002; Bachtrog and Gordo 2004; Etheridge et al. 2009). However, both intuition and experimental data (Silander et al., 2007) strongly suggest that beneficial mutations become more common as a population accumulates deleterious mutations. Silanderet al.(2007) also provided a simple analysis of the possible dynamic balance, but it did not extend beyond the low mutation rate limit in which mutant alleles fix or go extinct within an otherwise clonal population. The dynamics of diverse populations subject to the combined effect of both deleterious and beneficial mutations have remained under-studied (for notable exceptions see Rouzine et al. 2003, 2008 and Pfaffelhuberet al.2011).
We have shown that for any population size, mutation rate, and selection pressure, there exists a proportion of beneficial mutations,ec, which balances the accumulation of deleterious mutations. Because beneficial mutations are fa-vored by natural selection, a small-fraction beneficial muta-tion can suffice to maintain stability, ec 1. We have demonstrated this by explicitly calculatingecas a function of population size, mutation rate, and the strength of selec-tion. There are two qualitatively different regimes forec, as shown in Figure 6. In the slow-ratchet regime, selection stabilizes the fittest subset of the population at the nose of the distribution, soecis small and depends exponentially on the population parameters Ns and l. On the other hand, in the fast-ratchet regime,ecmust be larger to balance rapid accumulation of deleterious alleles, and it depends more weakly on the population parametersNsandl. The bound-ary of the two regimes is approximately given byNse2l= 1. We note that Rouzineet al. (2003, 2008) studied popu-lation dynamics under the combined action of purifying and positive selection in a model similar to ours, finding both
simulation and analytical evidence for the existence of the dynamic balance state. However, their analysis focuses on the rate of the ratchet (witheec) or the rate of adaptation (with eec) and does not apply ase/ec. Our work, by contrast, focuses exclusively on the dynamic equilibrium state and the criticalecrequired to maintain it.
Our analysis treatseas an independent parameter, even though we expect it to depend on absolute fitness v. As discussed above, we expecte(v) to decrease with increas-ing v. In this case the steady state corresponding to dy-namic balance atec(N,l) is stable and is a global attractor point. Fore.ecmeanfitness increases (dv/dt.0), while for e,ecmean fitness decreases (dv/dt ,0), which for de(v)/dv,0 guarantees local stability of thee=ec equi-librium. While our presentation focused on the properties of dynamic equilibrium, our approach also defines the ac-tual rate of change of dv/dt = r+ 2 r2as a function of
instantaneouseandN(note that, as in Rouzineet al.2008, in generalr6themselves become dependent on this“
veloc-ity”). This quantitative understanding of differential dynam-ics, i.e., the rate of change of meanfitness conditional on a given value of e, can be integrated for any given e(v) de-fining the corresponding evolutionary trajectory as a func-tion of time. This considerafunc-tion can be readily generalized (by allowing Nto change along v) to include possible re-duction in the size of the population that may follow reduc-tion of absolutefitness. In particular, it is possible that under some conditions the population will collapse—i.e., “ muta-tional meltdown” will occur—before the stable dynamic equilibrium is reached (Lynchet al. 1993) (seeFile S1 for more extended discussion). The possibility of such a melt-down instability depends critically on precisely how e depends on v and hence on details of the ecology of the specific system. However, given any specific set of assump-tions aboute(v), this effect can be analyzed quantitatively in terms of the dynamics formulated above.
Figure 6 The fraction of beneficial mutationsecnecessary to maintain the dynamic mutation–selection balance in a population with parameters
Nsandl¼U/s. The dashed line separates the slow- and fast-ratchet regimes. Experiments with various model organisms with different pop-ulation parameters are represented as points.
Figure 5 The critical fraction of beneficial mutations,ec, in the slow-ratchet regime forsb=sd/zwithz= 0.5, 1, 2 and many combinations
Our analytic results for ec in the dynamic equilibrium were made possible by the explicit calculation of the shape of thefitness distribution, given in Equation 4 and illustrated in Figure 3. With increasing land decreasing Nthis distri-bution deviates from the Poisson distridistri-bution for the classic mutation–selection balance (Haigh 1978), most notably re-ducing thefitness of the top class,k⋆, relative to the mean.
Examining the properties of the dynamic mutation–selection equilibrium over the full parameter range, shown in Figure 6, has revealed a strong asymmetry between beneficial and deleterious mutations. For example, for a small population Ns103with high mutation ratel8, just 2% beneficial mutations are enough to counteract the effect of deleterious mutations. This indicates that purifying selection is remark-ably effective even for conditions where Muller’s ratchet would proceed extremely quickly in the absence of back and compensatory mutations.
Populations withe.ecshould adapt, while populations with e,ecshould decline infitness. Experimental evolu-tion of model organisms in controlled laboratory environ-ments appears to be consistent with this expectation. In particular, Silander et al. (2007) showed that bacterio-phage uX174 converged to a population-size–dependent fitness plateau, as our model would predict. For their pop-ulation parameters (s0.08,U0.13) our theory predicts ecranging from 2% to 0.2% for their experiments (in which Nranged from 100 to 200), consistent with the beneficial mutation rates they infer. Their experiments with lower population sizes (N& 30) are in the fast-ratchet regime, and estimating ecrequires further analysis of fluctuations beyond the nose.
Other experiments with vesicular stomatitis virus found that large populations adapt while small populations melt, also consistent with our analysis (Moyaet al.2000). Similar results have been observed in yeast (Desaiet al.2007; Lang
et al.2011). In the long-term evolution experiments of
Len-ski and collaborators inEscherichia coli, parameters are such that we expect the criticalecto be very small,ec10210, consistent with their observation of continuous adaptation even after tens of thousands of generations. On the other hand, mutator strains of E. coli(Trindade et al.2010) and yeast (Desaiet al.2007) sometimes show decrease infitness, which could be used to further test the model. In Figure 6, we show approximate estimates for the parameter regimes in which each of these experimental systems lie. For exam-ple, population parameters for human immunodeficiency virus seem to place it close to the boundary between the slow- and fast-ratchet regimes (Figure 6), so that its evolu-tionary dynamics depend sensitively on the strength of selection.
While a global“phase diagram”of population dynamics is highly intriguing, our present attempt to construct it high-lights the challenge of doing so. First, our analysis has as-sumed that all mutations have the same selective effects. In general, however, mutations have a range of selective effects. Mutations with a particular characteristic strength
may tend to dominate the dynamics, if more strongly se-lected mutations are quickly eliminated by selection while more weakly selected mutations are effectively neutral given interference from selection on the other mutations. Thus, ourlparameter must be regarded as an effective parameter corresponding to mutations with effect strength that domi-nate the balance. The possibility of defining such an effective lin the model of Muller’s ratchet with deleterious effects of different size has been discussed by Soderberg and Berg (2007) on the basis of numerical simulations. Yet the gen-eral description of interference within an arbitrary distribu-tion of (deleterious and beneficial) mutational effects that would provide a precise definition of effectiveleffremains an open problem and an important avenue for future work. Second, our analysis has focused on asexual populations and neglected recombination. Since even weak recombination has the potential to significantly slow Muller’s ratchet, it would be interesting to generalize our dynamic balance to include its effects (Bell 1998; Gordo and Campos 2008). Increasing recombination rates would presumably allow the population to maintain better-adapted genotypes in this steady state. Last but not least, better experimental charac-terization of mutation effect distributions for different organisms will be needed to fully achieve the synthesis attempted in Figure 6.
The dynamic balance state has important implications for patterns of molecular evolution. Recent analysis of the effects of purifying selection on the structure of genealogies has suggested that Muller’s ratchet plays a crucial role in determining the structure of genetic variation in asexual populations or on short distance scales in the genomes of sexual organisms (Gordo et al. 2002; Seger et al. 2010). However, these expectations must be revised if populations exist instead in the dynamic state in which both beneficial and deleterious mutations fix, without any continuous net degradation or growth of fitness. This means that even though no change infitness occurs, signatures of both pos-itive and negative selection are likely to be found in patterns of molecular evolution, as has been suggested by earlier studies (Hartl and Taubes 1996; Antezana and Hudson 1997). We argue that this state is the natural null expecta-tion for the effects of mutaexpecta-tions and purifying selecexpecta-tion on patterns of genetic variation; efforts to look for positive se-lection that represent“true”adaptation should look for devi-ations from this situation.
the population and hence are likely to play a key role in patterns of molecular evolution and in understanding the effects of recombination.
Acknowledgments
We thank Pierre Neveu, Adel Dayarian, Aleksandra Walczak, and Paul Sniegowski for many useful discussions. S.G., D.J.B., and B.I.S. were supported by the National Institute of General Medical Sciences GM086793 and the Human Frontier Science Program RFG0045/2010. E.R.J. acknowl-edges support from a National Science Foundation graduate research fellowship. R.A.N. is supported by the European Research Council through grant StG-2010-260686. M.M.D. acknowledges support from the James S. McDonnell Foun-dation, the Alfred P. Sloan FounFoun-dation, and the Harvard Milton Fund.
Literature Cited
Andersson, D., and D. Hughes, 1996 Muller’s ratchet decreases
fitness of a dna-based microbe. Proc. Natl. Acad. Sci. USA 93: 906–907.
Antezana, M., and R. Hudson, 1997 Point-mutations, the ratchet, and the initial success of eukaryotic sex: a simulation study. Evol. Theory Rev. 11: 209–235.
Bachtrog, D., and I. Gordo, 2004 Adaptive evolution of asexual populations under Muller’s ratchet. Evol. Int. J. Org. Evol. 58: 1403–1413.
Barrick, J., M. Kauth, C. Strelioff, and R. Lenski, 2010 Escherichia coli rpob mutants have increased evolvability in proportion to theirfitness defects. Mol. Biol. Evol. 27: 1338–1347.
Barton, N., and B. Charlesworth, 1998 Why sex and recombina-tion? Science 281: 1986–1990.
Bell, G., 1998 Recombination and the immortality of the germ line. J. Evol. Biol. 1: 67–82.
Chao, L., 1990 Fitness of RNA virus decreased by Muller’s ratchet. Nature 348: 454–455.
Charlesworth, B., 2012 The effects of deleterious mutations on evolution at linked sites. Genetics 190: 5–22.
Charlesworth, B., and D. Charlesworth, 1997 Rapid fixation of deleterious alleles can be caused by Muller’s ratchet. Genet. Res. 70: 63–73.
De Visser, J., and S. Elena, 2007 The evolution of sex: empirical insights into the roles of epistasis and drift. Nat. Rev. Genet. 8: 139–149.
Desai, M. M., D. S. Fisher, and A. W. Murray, 2007 The speed of evolution and maintenance of variation in asexual populations. Curr. Biol. 17: 385–394.
Duarte, E., D. Clarke, A. Moya, E. Domingo, and J. Holland, 1992 Rapidfitness loss in mammalian RNA virus clones due to Muller’s ratchet. Proc. Natl. Acad. Sci. USA 89: 6015–6019. Eigen, M., 1971 Self organization of matter and the evolution of
biological macromolecules. Naturwissenschaften 58: 465–523. Escarmis, C., M. Davila, and E. Domingo, 1999 Multiple
molecu-lar pathways forfitness recovery of an RNA virus debilitated by operation of Muller’s ratchet. J. Mol. Biol. 285: 495–505. Estes, S., and M. Lynch, 2003 Rapidfitness recovery in
mutation-ally degraded lines of Caenorhabditis elegans. Evolution 57: 1022–1030.
Etheridge, A., P. Pfaffelhuber, and A. Wakolbinger, 2009 How often does the ratchet click? Facts, heuristics, asymptotics,
pp. 365–390 in Trends in Stochastic Analysis, edited by P. M. Jochen Blath and M. Scheutzow. Cambridge University Press, Cambridge, UK.
Felsenstein, J., 1974 The evolutionary advantage of recombina-tion. Genetics 78: 157–159.
Gabriel, W., and R. Burger, 1993 Muller’s ratchet and mutational meltdowns. Evolution 47: 1744–1757.
Gessler, D., 1995 The constraints offinite size in asexual popula-tions and the rate of the ratchet. Genet. Res. 49: 135–146. Gordo, I., and P. Campos, 2008 Sex and deleterious mutations.
Genetics 179: 621–626.
Gordo, I., and B. Charlesworth, 2000a The degeneration of asex-ual haploid populations and the speed of Muller’s ratchet. Ge-netics 154: 1379–1387.
Gordo, I., and B. Charlesworth, 2000b On the speed of Muller’s ratchet. Genetics 156: 2137–2140.
Gordo, I., A. Navarro, and B. Charlesworth, 2002 Muller’s ratchet and the pattern of variation at a neutral locus. Genetics 161: 835–848.
Haigh, J., 1978 The accumulation of deleterious genes in a pop-ulation. Theor. Popul. Biol. 14: 251–267.
Hartl, D., and C. Taubes, 1996 Compensatory nearly neutral muta-tions: selection without adaptation. J. Theor. Biol. 182: 303–309. Howe, D., and D. Denver, 2008 Muller’s ratchet and compensa-tory mutation in Caenorhabditis briggsae mitochondrial genome evolution. BMC Evol. Biol. 8: 62.
Hughes, J. F., H. Skaletsky, L. G. Brown, T. Pyntikova, T. Graves
et al., 2012 Strict evolutionary conservation followed rapid gene loss on human and rhesus Y chromosomes. Nature 483: 82–86.
Jain, K., 2008 Loss of least-loaded class in asexual populations due to drift and epistasis. Genetics 179(4): 2125–2134. Kondrashov, A., 1994 Muller’s ratchet under epistatic selection.
Proc. Natl. Acad. Sci. USA 136: 1469–1473.
Kondrashov, A., 1995 Contamination of the genome by very slightly deleterious mutations: Why have we not died 100 times over? J. Theor. Biol. 175: 583–594.
Lande, R., 1998 Risk of population extinction from fixation of deleterious and reverse mutations. Genetica 102/103: 21–27. Lang, G. I., D. Botstein, and M. M. Desai, 2011 Genetic variation
and the fate of beneficial mutations in asexual populations. Ge-netics 188: 647–661.
Loewe, L., 2006 Quantifying the genomic decay paradox due to Muller’s ratchet in human mitochondrial DNA. Genet. Res. Camb. 87: 133–159.
Lynch, M., 1996 Mutation accumulation in transfer RNAs: molec-ular evidence for Muller’s ratchet in mitochondrial genomes. Mol. Biol. Evol. 13: 209–220.
Lynch, M., R. Burger, D. Butcher, and W. Gabriel, 1993 The mu-tational meltdown in asexual populations. J. Hered. 84: 339– 344.
Lynch, M., J. Conery, and R. Burger, 1995 Mutation accumulation and the extinction of small populations. Am. Nat. 146: 489–518. Manrubia, S. C., E. Lazaro, and J. Perez-Mercader, 2003 Fitness distributions in exponentially growing asexual populations. Phys. Rev. Lett. 90(18): 188102.
Moya, A., S. F. Elena, A. Bracho, R. Miralles, and E. Barrio, 2000 The evolution of RNA viruses: a population genetics view. Proc. Natl. Acad. Sci. USA 97: 6967–6973.
Muller, H., 1964 The relation of recombination to mutational ad-vance. Mutat. Res. 1: 2–9.
Neher, R. A., and B. I. Shraiman, 2012 Fluctuations of fitness distributions and the rate of Muller’s ratchet. Genetics 191: 1309–1319.
Poon, A., and L. Chao, 2005 The rate of compensatory mutation in the DNA bacteriophagefx174. Genetics 170: 989–999. Poon, A., and S. Otto, 2000 Compensating for our load of
muta-tions: freezing the meltdown of small populations. Evolution 54: 1467–1479.
Poon, A., B. Davis, and L. Chao, 2005 The coupon collector and the suppressor mutation: estimating the number of compensa-tory mutations by maximum likelihood. Genetics 170: 1323– 1332.
Rice, W., 1994 Degeneration of a nonrecombining chromosome. Science 263: 230–232.
Rouzine, I., J. Wakeley, and J. Coffin, 2003 The solitary wave of asexual evolution. Proc. Natl. Acad. Sci. USA 100: 587–592. Rouzine, I., E. Brunet, and C. Wilke, 2008 The traveling-wave
approach to asexual evolution: Muller’s ratchet and speed of adaptation. Theor. Popul. Biol. 73: 24–46.
Schoustra, S., T. Bataillon, D. Gifford, and R. Kassen, 2009 The properties of adaptive walks in evolving populations of fungus. PLoS Biol. 7: e1000250.
Schultz, S., and M. Lynch, 1997 Deleterious mutation and extinc-tion: the role of variable mutational effects, synergistic epistasis, beneficial mutations, and degree of outcrossing. Evolution 51: 1363–1371.
Seger, J., W. A. Smith, J. J. Perry, J. Hunn, Z. A. Kaliszewskaet al., 2010 Gene genealogies strongly distorted by weakly interfer-ing mutations in constant environments. Genetics 184: 529– 545.
Silander, O., O. Tenaillon, and L. Chao, 2007 Understanding the evolutionary fate of finite populations: the dynamics of muta-tional effects. PLoS Biol. 5: e94.
Soderberg, R., and O. Berg, 2007 Mutational interference and the progression of Muller’s ratchet when mutations have a broad range of deleterious effects. Genetics 177: 971–986.
Stephan, W., and Y. Kim, 2002, Recent Applications of Diffusion Theory to Population Genetics. Oxford University Press, Oxford, pp. 72–93.
Trindade, S., L. Perfeito, and I. Gordo, 2010 Rate and effects of spontaneous mutations that affectfitness in mutator Escherichia coli. Philos. Trans. R. Soc. B Biol. Sci. 365: 1177–1186. Wagner, G., and W. Gabriel, 1990 Quantitative variation infinite
parthenogenetic populations: What stops Muller’s ratchet in the absence of recombination? Evolution 44: 715–731.
Zeyl, C., M. Mizesko, and J. de Visser, 2001 Mutational meltdown in laboratory yeast populations. Evolution 55: 909–917.
GENETICS
Supporting Information
http://www.genetics.org/content/suppl/2012/06/01/genetics.112.141291.DC1
Dynamic Mutation
–
Selection Balance
as an Evolutionary Attractor
Sidhartha Goyal, Daniel J. Balick, Elizabeth R. Jerison, Richard A. Neher, Boris I. Shraiman, and Michael M. Desai
Rate of extinction of the fittest genotype in the slow ratchet regime. Stochastic fluctuations of the fittest class can approximately be described by a diffusion equation:
∂tp(x, t) =−∂x[D1(x)p(x, t)] +∂x2[D2(x)p(x, t)] (1)
wherep(x) is the probability distribution of the nose occupancy,x=N−1nk?being defined as the fraction of the population in the ”top bin”k?. Diffusive ”drift” is represented byD2(x) =x(1−x)/2N and effect
of selection acting in the top bin is represented by D1(x) = ˆsx(1−x/x?), where x? = e−U/s is the
equilibrium nose occupancy, , where ˆs = γs and γ is a ”phenomenological” parameter introduced by
Haigh(1978). Both x= 1 (fixation) andx= 0 (extinction) are absorbing boundary conditions (Jain,
2008; Stephan and Kim, 2002). The density function for fixation/extinction time ϕ(t;x) satisfies the backward Kolmogorov equation
∂tϕ(t;x) =D1(x)∂xϕ(t;x) +D2(x)∂x2ϕ(t;x) (2)
where t is the time interval between initial statex and fixation or extinction. The mean time to fixa-tion/extinction starting at x=y att= 0 is given by ¯t(y) =R0∞tϕ(t;y)dt, which satisfies
−1 =D1(y)∂y¯t(y) +D2(y)∂y2¯t(y). (3)
Using the integrating factorϕ(x) =e
Rx
0 dz
D1 (z)
D2 (z), yields for the mean time to extinction of the fittest class:
¯
t(x?) =
Z x?
0
dy 1 ϕ(y)
Z 1
y
dζ ϕ(ζ) D2(ζ)
, (4)
where
ϕ(x) = (1−ζ)2Nsˆ(1x?−x?)e
2Nˆsζ
x? , (5)
The second integral in the limit N s1 can be approximated as
2N
Z 1
y
dζ(1−ζ)
2Nˆs(1−x?)
x? e
2Nˆsζ
x?
ζ(1−ζ) ≈2N
Z 1
y
dζe
2Nˆsx?
2ζ
x?− ζ2 x2
?
ζ (6)
and for smallx,ϕ(x) approximates to
ϕ(x)≈e2Nsxˆ ?
2ζ
x?− ζ2 x2?
(7)
Using the above approximations andα=Nˆsx?, n?=N x?and changing the variables,η =y/x?−1, z=
ζ/x?−1 yields:
¯
t(x?)≈2nk?
Z 0
−1
dηeαη2
Z 1/?−1
η
dze
−αz2
1 +z (8)
Forα1 the integral the second integral can be readily approximated yielding
¯
t(x?)≈2nk?
r
π
4α
Z 0
−1
dηeαη2erf(√αβ)−erf(√αη) (9) whereβ= k1
?−1. Usingη
2= 1
−θ2/αallows the evaluation of the integral in theα1 limit and yields
¯
t(x?)≈nk? √
πα−3/2eα. (10)
Assuming an exponential distribution for time of extinction of the fittest class, the rate of extinction is given byr−= 1/¯t(x?). Replacingα=γsnk? yields:
r− ≈e−γsnk?γs
p
γsnk?/π (11)
which we use to arrive at Eq. (11) of the main text.
This standard calculation of extinction probability has glossed over the non-trivial ”many-body” element of the problem: the fact that the strength of selection acting on the fittest genotype is defined relative to the population mean, which depends on the deviations from the steady state for all other, less-fit, genotypes. The latter in turn depends on the history of the dynamics in the top fitness ”bin”. As in all of the previous work, we deal with this problem here by introducing a phenomenological parameter
γ, known as the ”Haigh factor” (Gordo and Charlesworth, 2000a,b; Haigh, 1978; Stephan and
Kim, 2002). However, unlike earlier work we shall not assume this factor to be a constant and determine
its λ-dependence numerically (see discussion of the slow ratchet regime in the main text). An analytic method for describing the effect of history dependence on the fluctuations of the top bin goes beyond the scope of the present work and will be described in a separate publication (Neher and Shraiman, submitted).
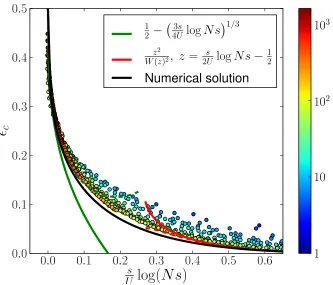
Asymptotic expressions for c The matching condition used to determine c in the fast-ratchet
regime can be rewritten as follows.
1
σ√k?
=N e−λ(1−2λ)+k?2 log
1−
Jk
?(2α). (12)
In the limit of α 1, the zero of the Bessel function is approximately at k?+ 1 ≈ α and the Bessel
function atk? evaluates to roughly∼k
2/3
? (Abramowitz 9.3.33 and 9.1.27). Hence we have
λ(1−2)−λp(1−) log1−
= logN s (13)
where we have neglected powers to the 16 andO(1) factors inside the logarithm. In the limit1 (but
λ21), the matching simplifies to
1−2+√log=λ−1logN s (14)
which simplifies further to
√log
≈λ−1log(N s)−1 =−2z (15)
where we definedz for convenience. This can be solved for:
c=
z2 W(−z)2 ≈
z2
(log(z)−log(−log(z)))2 (16)
where W(x) is the−1 branch of Lambert’s W-function, i.e. the solutions ofW(x)eW(x)=x. The linear correction in Eq. 14 can be incorporated iteratively.
i+1=
(z+i)2
W(−z+i)2
. (17)
This iteration converges for smallC and . At largerC, the branch of the W(x) function is lost. The result 2 obtained after the first iteration, starting with Eq. 16, is also shown in Fig. S1 as dashed red
line.
0
.
0
0
.
1
0
.
2
0
.
3
0
.
4
0
.
5
0
.
6
s
U
log(N s)
0
.
0
0
.
1
0
.
2
0
.
3
0
.
4
0
.
5
c
1 2
−
3s
4U
log
N s
1/3z2
W(z)2
, z
=
2sUlog
N s
−
12Numerical solution
1
10
10
210
3Figure S1. Dynamic mutation-selection balance. The figure shows c for many combinations ofU,s
andN as a function of s
U logN s, while the color codes forcU
2s−2. If
cU2s−21,c is solely a
function of s
UlogN sand is well described by the numerical solution of Eq. 6 in Main text, shown as a
black line. The asymptotic approximations for largec (Eq. 19) and smallc (Eq. 16) are shown as
green and red lines, respectively. The dashed lines correspond to the more accurate version mentioned in the main text.
The other limit that is amenable to analytic calculations is the limit→1/2. To this end, we define
δ=1
2−and expand the right hand side of Eq. 14
1−2−p(1−) log1−
=
4 3δ
3+44
15δ
5+
O(δ7) =λ−1logN s. (18)
From this, we find
≈ 1
2 −
3
4λlog(N s)
1/3
. (19)
This expression is compared to simulation results in Fig. S1. The term proportional toδ5 can again be
included by iteration and the result is shown as the dashed green line in Fig. S1.
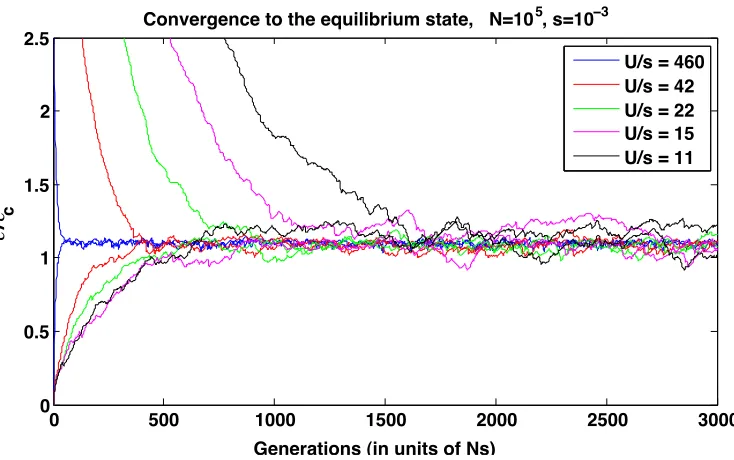
Convergence to the dynamic mutation-selection balance state. In the main text we discuss
the possibility that itself depends on the absolute fitness. As the simplest model of this dependence here we consider the case of (k) =k/Lwhich may be thought of as a ”genome” of length L, that for
0 500 1000 1500 2000 2500 3000 0
0.5 1 1.5 2
2.5 Convergence to the equilibrium state, N=10
5, s=10−3
Generations (in units of Ns)
ε
/
ε
cU/s = 460 U/s = 42 U/s = 22 U/s = 15 U/s = 11
Figure S2. Evolution of the beneficial mutation fraction in the model with(k) =k/L. The figure shows time evolution oftowardsec for populations which start above or below the absolute fitness (i.e.
average number of mutations ¯kper genome) corresponding to the dynamic balance state which is realized when(k) at the nose of the distribution is atc. The rate of convergence depends on the
population parametersN s, λ. Fluctuations aroundc arise from the stochastic nature of the dynamic
balance state.
k = 0 cannot be improved in fitness, but allows for a k/L fraction of compensatory mutations, once
k >0. Dependence of beneficial mutation fraction on absolute fitness is parameterized by Lhere set to 103, so that differences inwithin any population are relatively small asλ/L <<1. Figure S2 presents
the result of numerical simulations for this model, for different values ofλand different population sizes (see Methods section of the main text for the description of the numerical method). We ran simulations starting with populations in the high (k−0) and low (k=L) fitness states and observed the dynamics of population averaged fitness ¯k decrease or increase with time eventually approaching a statistically steady state. This asymptotic state is characterized by average close to c appropriate for the given
population parameters. This convergence is evident in Figure S2 which displays the time dependence of population averaged normalized toc(N, λ). Asymptotic value of the/c(N, λ) deviates slightly from
unity because of the residual variation of within the population in the equilibrium state. The rate of evolution towards dynamic balance slows down as the population approaches itsc, which is expected as
thev→0 as→c.
Mutational Meltdown. While the focus of our analysis has been on understanding the properties of the dynamic balance state, we have in the main text of the paper also discussed the global condition for its stability: the monotonic increase in the beneficial mutation rate (i.e. ) with decreasing absolute fitness. That discussion however assumed constant population size, which may not be a good assumption once the absolute fitness falls below certain threshold. Declining absolute population fitness can lead to a reduction in population size, speeding Muller’s ratchet and leading to further declines in absolute fitness
and eventual extinction, a process is known as “mutational meltdown.” We now consider the conditions under which the dynamic equilibrium state allows a population to avoid this mutational meltdown.
To address this question, we must first specify the relationship between absolute fitness and changes in population size. This depends on the details of the population dynamics, and a variety of different models are plausible. Here we use the framework proposed byLynchet al.(1993), in which the average number of offspring of an individual isRw, whereRis the average fecundity of a mutation-free individual and wis its absolute fitness. In our model an individual with` deleterious mutations hasw= (1−s)`.
The population then melts down when the average individual produces less than one offspring, which occurs when
R(1−s)¯`<1. (20)
To connect this condition to our analysis of the dynamic equilibrium state, we next need to specify the relationship betweenand absolute fitness. This depends on the specific model of back and compensatory mutations. Here we assume that increases linearly with the number of deleterious mutations,
= c`
L, (21)
where c represents the average number of back or compensatory mutations available per deleterious mutation and Lrepresents the total number of potentially deleterious sites.
Given these assumptions, our dynamic equilibrium state must satisfy
c<
c L
lnR
ln(1−s)−1 ≈
clnR
sL (22)
in order to avoid mutational meltdown. We can simply apply our analysis as described above to compute
c; if the resulting value is greater than this critical value given the relevant values of R, s, and L, the
dynamic equilibrium will not be stable due to reductions in population size, and meltdown will occur. We note however that since c is bounded above by 12, meltdown can only occur for sufficiently strong
selection, sL > 2 lnR. At the same time, stronger selection tends to reduce c. Thus meltdown will
typically be a concern only for a specific range of intermediate selection strengths.
The assumptions we made about population dynamics and the linear relationship between and absolute fitness are of course arbitrary. Recent work bySilanderet al.(2007) has argued that in fact
increases faster than linearly with`. In this case, mutational meltdown will be less likely than we have suggested above (i.e. larger c is required for meltdown). The alternative scenario where increases
less than linearly with ` is also possible in principle, in which case mutational meltdown becomes more probable, though this scenario seems implausible given that back-mutation rates should increase linearly with`.
References
Gordo, I., and B. Charlesworth, 2000a The degeneration of asexual haploid populations and the
speed of muller’s ratchet. Genetics154: 1379–1387.
Gordo, I., andB. Charlesworth, 2000b On the speed of muller’s ratchet. Genetics156: 2137–2140.
Haigh, J., 1978 The accumulation of deleterious genes in a population. Theor. Popul. Biol.14: 251–26.
Jain, K., 2008 Loss of least-loaded class in asexual populations due to drift and epistasis. Genetics
179(4): 2125–34.
Lynch, M., R. Burger, D. Butcher, and W. Gabriel, 1993 The mutational meltdown in asexual
populations. J. Hered. 84: 339–344.
Silander, O., O. Tenaillon, and L. Chao, 2007 Understanding the evolutionary fate of finite
popu-lations: the dynamics of mutational effects. PLoS Biol.5: e94.
Stephan, W., and Y. Kim, 2002 Recent Applications of Diffusion Theory to Population Genetics.
Oxford University Press, Oxford, UK, 72–93.