5
IX
September 2017
Performance Analysis of Four Stroke Compression
Ignition Engine Using Biodiesel Blended Diesel
Shree Dewangan1, Saurabh Kumar2
1
(MTech, Thermal engineering scholar, Mechanical engineering department, Raipur institute of technology, Raipur, India)
2
(Assistant Professor, Mechanical engineering department, Raipur institute of technology, Raipur, India)
Abstract: With increase in demand of alternative fuel to conserve non-renewable source of fuel a research has been carried out to reduce the diesel usage by adding biodiesel which increase thermal efficiency of the engine. This research shows that use of increase in brake thermal efficiency has been obtained in one litre of solution with biodiesel blended diesel gives maximum efficiency. Regression analysis also has been carried out to find out correct amount of biodiesel which can be used for blending in petrodiesel.
Keywords:Petrodiesel, biodiesel, brake thermal efficiency, fuel consumption, brake power
I. INTRODUCTION
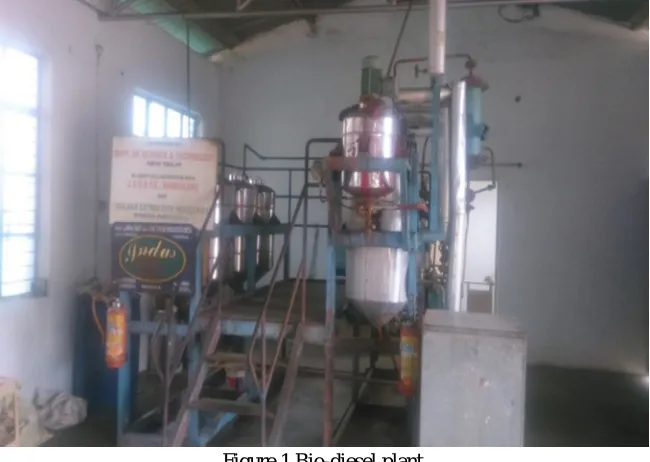
[image:2.612.145.470.441.672.2]India is very big vast and developing country. Population is also growing day by day as a result of this many people are using diesel vehicle on daily basis. More than 50% of vehicle is passenger vehicle or utility vehicle [1] and as above mentioned vehicles are compression ignition engine system diesel is main fuel and we all know that diesel has been produce from non-renewable source of energy. Non-renewable sources of energy are very limited and it is very necessary to conserve it so alternative fuel is required. Second reason for searching alternative fuel is that by using diesel as a fuel environment is affecting badly. According to a report pollution level in India is increasing by percent every due to use of compression ignition engine vehicles or diesel vehicles. Biodiesel can use as alternative fuel in place of diesel or by mixing with diesel. It fulfil both requirement of alternative fuel as we can conserve non-renewable source and by using biodiesel level of pollution will also decrease this is due to process of preparation of biodiesel [2]. Biodiesel is prepared from natural plant namely palm and Jatropha. In this research Jatropha plant is used for preparation of biodiesel [3].
Figure 1 Bio-diesel plant
II. EXPERIMENTALSETUP
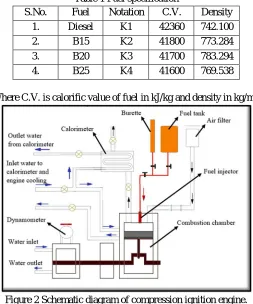
Experimental setup consists of four stroke single cylinder C.I. engine having speed of 1500RPM. Bore and stroke of engine are 85mm and 110mm respectively. Cooling system of engine is water cooled and loading device is hydraulic dynamometer with weighing attachment. Figure 2 shows the schematic arrangement of compression ignition engine.
Table 1 Fuel specification
S.No. Fuel Notation C.V. Density 1. Diesel K1 42360 742.100 2. B15 K2 41800 773.284 3. B20 K3 41700 783.294 4. B25 K4 41600 769.538
[image:3.612.180.433.138.442.2]Where C.V. is calorific value of fuel in kJ/kg and density in kg/m3.
Figure 2 Schematic diagram of compression ignition engine.
III.METHODOLOGY
First of all three different fuels has been made K2, K3 and K4. K2 consist of 15% of biodiesel and 85% of diesel in one litre of solution. K3 consist of 20% of biodiesel and 80% of diesel in one litre of solution. K4 consist of 25% biodiesel and 75% diesel in one litre of solution. The performance of these three different type of solution is compared with fuel K1 that is diesel.
Plug in the switch of thermocouple and start it which shows temperature T1, T2, T3, T4 and T5 indicates the reading of temperature
of water inlet to engine and calorimeter, temperature of water exit from calorimeter, temperature of water exit from cooling jacket, exhaust gas temperature before calorimeter, temperature of exhaust gas from engine after calorimeter respectively.
Pour the diesel into the engine set the dynamometer to 0kg load and note down the fuel consume within 5 minute also note down all temperature. Time taken for water outlet from cooling jacket and water outlet from calorimeter has been also recorded. Repeat this process for fuel K2, K3 and K4.
Pre-test has been done for engine parameters to check the condition of the engine. Pre-test is required in every experiment as it gives the conditions of the setup. In this regard some experimental parameters have been found which are as follows:
Table 2 Range of parameter in the experiment
S.No Parameters Minimum Limit Maximum Limit
1 Mass flow rate of fuel 0.6189 kg/hr 0.642955 kg/hr
2 Load 0 kg(no load) 4kg
3 Brake Power 0 kW 2.05017 kW 4 B.S.F.C. 0.3161 kg/kWhr 1.222 kg/kWhr
IV.RESULTSANDDISCUSSION
A. Result In Tables
TABLE 3PERFORMANCE VALUES OF K1 Load (W) BP (kW) mf (kg/hr) BSFC (kg/kW-h) BTE (%)
0 0 0.61891 - 0
1 0.5084 0.62158 1.222446 6.9521
2 1.0169 0.62336 0.612975 13.864
3 1.5254 0.62959 0.412736 20.590
4 2.0338 0.64295 0.31612 26.884
TABLE 4PERFORMANCE VALUES OF K2
Load (kg) BP (kW) mf (kg/hr) BSFC
(kg/kW-h) BTE (%)
0 0 0.4129 - 0
1 0.5084 0.4185 0.823056 10.4639
2 1.0162 0.4259 0.419107 20.5495
3 1.5233 0.4287 0.281419 30.6036
4 2.0298 0.4370 0.215319 39.9984
TABLE 5PERFORMANCE VALUES OF K3 Load (kg) BP (kW) mf (kg/hr) BSFC (kg/kW-h) BTE (%)
0 0 0.3618 - 0
1 0.5149 0.3712 0.72105 11.9729
2 1.0284 0.4135 0.40213 21.4685
3 1.5406 0.4276 0.27759 31.1
4 2.0501 0.4399 0.21457 40.235
TABLE 6PERFORMANCE VALUES OF K4 Load (kg) BP (kW) mf (kg/hr) BSFC (kg/kW-h) BTE (%)
0 0 0.4368 - 0
1 0.5135 0.4387 0.854299 10.129
2 1.0264 0.4243 0.413463 20.930
3 1.5376 0.4454 0.289683 29.873
B. Graphical Analysiz
Figure 2 Graph between Brake power and load for all fuels
[image:5.612.149.466.327.498.2]From above figure it is clearly visible that load is directly proportional to brake power. As we increase load brake power will also increase. In all cases for fuel K1 to K4. Negligible fluctuations were obtained between fuels that is due to change in engine speed but individually the variation between brake power and load is constant.
Figure 3 Variation between fuel consumption and load
From figure 3 it can be seen that as load increases from 0kg to 4kg fuel consumption also increases this due to requirement of fuel increases as we increases the load. If at some load consumption of fuel decreases that is due to engine fluctuation at 3kg load.
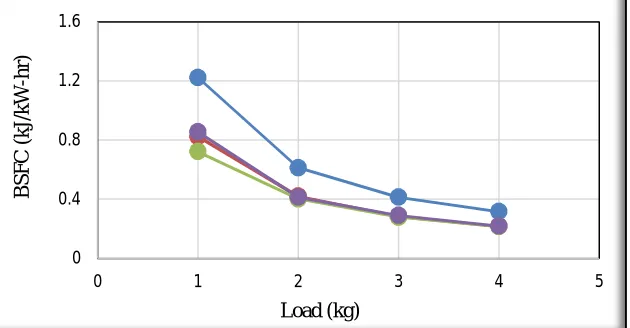
Figure 4 Variation between BSFC and load
0 0.5 1 1.5 2 2.5
0 1 2 3 4 5
Br ak e P o w er ( kW ) Load (kg) 0 0.2 0.4 0.6 0.8
0 1 2 3 4 5
F ue l co n sum pt io n (kg/ h r) Load (kg) 0 0.4 0.8 1.2 1.6
0 1 2 3 4 5
[image:5.612.150.465.551.715.2]From figure 4 it be seen that as load increases from 0kg to 4kg load value of brake specific fuel consumption decreases. This is due to reason that at high speed process of combustion improved due to high cylinder temperature which improve fuel atomization and also improve fuel mixing process.
Figure 5 Variation between Brake thermal efficiency and load
From figure 5 it can be seen that as load increases brake thermal efficiency also increases. This is due to ratio of friction to brake power goes down.
V. REGRESSIONANALYSIS
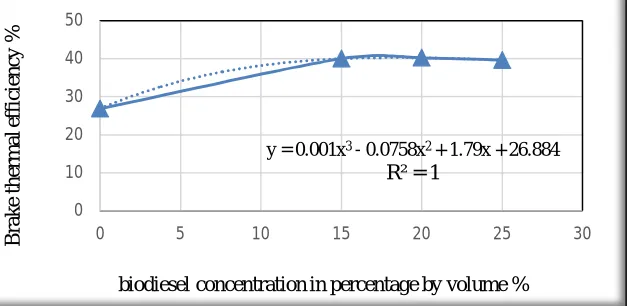
Regression analysis is a statistical technique for investigating and modelling the relationship between variables. Application of regression analysis is numerous and occurs in every field, including engineering and many other fields. Using regression analysis, the brake thermal efficiency has been related with percentage of biodiesel in diesel by volume. From figure 4.5 result shows the following polynomial equation of curve of best fit
= 0.001C3 – 0.0758C2 + 1.79C +26.884 Where C is concentration of nanoparticle
The above model has value of R2 as 1 so it is 100 % fit. For, Maximum brake thermal efficiency
Figure No. 6 Variation in Brake thermal efficiency with biodiesel concentration in percentage volume
d ɳ
dC = 0
or, 0.003C2 – 0.1516C + 1.79 = 0 therefore on solving we get,
C1 = 31.7271
C2 = 18.8061
Again differentiating
d ɳ
dC = 0
0 10 20 30 40 50
0 1 2 3 4 5
B ra ke t h er m a l ef fi ci en cy (%) Load (kg)
y = 0.001x3 - 0.0758x2 + 1.79x + 26.884
R² = 1
0 10 20 30 40 50
0 5 10 15 20 25 30
B ra ke t h er m a l ef fi ci en cy %
[image:6.612.150.465.446.599.2]or, 0.006C - 0.1516 = 0
d ɳ
dC at C = 0.03876
d ɳ
dC at C =−0.0387634
So the biodiesel concentration in percentage with water by volume which will give maximum efficiency is 18.8061%.
VI.CONCLUSION
From the above result it can be concluded that
A. B15 gives 39.99% thermal efficiency. B. B20 gives 40.23% thermal efficiency. C. B25 gives 39.63% thermal efficiency.
D. So best performance we will get is from B20 that is 80% diesel and 20% biodiesel.
E. By regression analysis it has been found that best result we will get from 18.80% biodiesel in one liter of solution. F. In compare to diesel B20 gives 33.18% better performance.
REFERENCE
[1] P. Doval, “50% of passenger cars now sold run on diesel,” Times of India, 2012. [Online]. Available: http://timesofindia.indiatimes.com/business/india-business/50-of-passenger-cars-now-sold-run-on-diesel/articleshow/12408287.cms. [Accessed: 26-Mar-2012].
[2] S. nehar A. Kumar, “Biodiesel: As an alternative fuel,” in Environmental protection, 1st ed., Daya Publishing House, 2007, pp. 32–37.
[3] M. BinLiang, HoufangLu., YingyingLiu., HuiZhou., YingYang., “Production of biodiesel from Jatropha curcas L. oil,” Comput. Chem. Eng., vol. 33, no. 5, pp. 1091–1096, 2008.
[4] A hull, I Golubkov, B Kronberg, J Van Stam, “No Title,” Int. J. Engine Res., vol. 7, no. 1, pp. 51–63, 2006.
[5] Ayush Kumar Raghuvanshi, C P Singh, “Extraction of biodiesel from Jatropha oil and performance study of diesel engine with biodiesel fuels,” Int. J. Sci. Res. Publ., vol. 4, no. 10, pp. 1–4, 2014
[6] S. A. Monisha J, Harish A, Sushma R, Krishna Murthy T P, Blessy Mathew, “Biodiesel: A Review,” Int. J. Eng. Res. Appl., vol. 3, no. 6, pp. 902–912, 2013. [7] Wail M Adailesh, Khaled S Alqdah, “Performance of Diesel Engine Fuelled by a Biodiesel Extracted From A Waste Cocking Oil,” Energy Procedia, vol. 18,
pp. 1317–1334, 2012.
[8] K Srithar, K Arun Balasubramanian, V Pavendan, B Ashok Kumar, “Experimental investigations on mixing of two biodiesels blended with diesel as alternative fuel for diesel engines,” J. King Saud Univ. – Eng. Sci., vol. 29, pp. 50–56, 2014.