M E T H O D
Open Access
FOCS: a novel method for analyzing
enhancer and gene activity patterns infers
an extensive enhancer
–
promoter map
Tom Aharon Hait
1,3, David Amar
1,2, Ron Shamir
1*†and Ran Elkon
3,4*†Abstract
Recent sequencing technologies enable joint quantification of promoters and their enhancer regions, allowing inference of enhancer–promoter links. We show that current enhancer–promoter inference methods produce a high rate of false positive links. We introduce FOCS, a new inference method, and by benchmarking against ChIA-PET, HiChIP, and eQTL data show that it results in lower false discovery rates and at the same time higher inference power. By applying FOCS to 2630 samples taken from ENCODE, Roadmap Epigenomics, FANTOM5, and a new compendium of GRO-seq samples, we provide extensive enhancer–promotor maps (http://acgt.cs.tau.ac.il/focs). We illustrate the usability of our maps for deriving biological hypotheses.
Keywords:Enhancers, Promoters, Gene regulation, ENCODE, Roadmap, FANTOM5, GRO-seq, eRNA, ChIA-PET, eQTL
Background
Deciphering the regulatory role of the noncoding part of the human genome is a major challenge. With the com-pletion of the sequencing of the genome, efforts have shifted over the past decade towards understanding the epigenome. These efforts aim at understanding regula-tory mechanisms outside the protein-coding sequences that allow the production of thousands of different cell types from the same DNA blueprint. Enhancer elements that distally control the activity of target promoters play critical roles in this process. Consequently, large-scale epigenomic projects set out to identify all thecis -regula-tory elements that are encoded in the genome.
Promin-ent among them is the ENCODE consortium [1, 2],
which applied a variety of epigenomics techniques to a large panel of human cell lines. Profiling epigenetic marks of regulatory activity (including DHS-seq profiling of DNase I hypersensitive sites (DHSs), which is ac-cepted as a common feature of all active elements), EN-CODE collectively identified hundreds of thousands of
putative regulatory elements in the genome [2]. As EN-CODE analyses were mainly applied to cancer cell lines, a follow-up project, the Roadmap Epigenomics, applied similar analyses to a large collection of human primary cells and tissues, in order to establish more physiological maps of common and cell type-specific putative regula-tory elements [3]. Given the plethora of candidate en-hancer regions called by these projects, the next pressing challenge is to identify which of them is actually functional and map them to the genes they regulate. A naïve approach that is still widely used in genomic stud-ies links enhancers to their nearest genes. Yet, emerging indications suggest that up to 50% of enhancers cross over their most proximal gene and control a more distal one [4]. A common approach that improves this naïve enhancer–promoter (E–P) mapping is based on pairwise correlation between activity patterns of promoters (P) and putative enhancers (E), and identifies E–P pairs, lo-cated within a distance limit, that show highly correlated patterns across many samples [2, 3]. However, this ap-proach does not take into account interactions among multiple enhancers that control the same target pro-moter. Furthermore, Pearson correlation, which is typic-ally applied for this task, is highly sensitive to outliers and thus prone to false positives.
* Correspondence:[email protected];[email protected]
†Equal contributors 1
Blavatnik School of Computer Science, Tel Aviv University, 69978 Tel Aviv, Israel
3Department of Human Molecular Genetics & Biochemistry, Sackler School of
Medicine, Tel Aviv University, 69978 Tel Aviv, Israel
Full list of author information is available at the end of the article
Improved detection of functional enhancers is offered by a recently discovered class of non-coding transcripts, named enhancer RNAs (eRNAs) [5]. eRNAs are mostly transcribed bi-directionally from regions of enhancers that are actively engaged in transcriptional regulation [5] (reviewed in [6, 7]), and, importantly, changes in eRNA expression at specific enhancer regions in response to different stimuli correlate both with changes in the amount of epigenetic marks at these enhancers and with the expression of their target genes [8–11]. Most eRNAs are not polyadenylated and are typically expressed at low levels due to their instability (reviewed in [12]). Therefore, eRNAs are not readily detected by standard RNA-seq protocols, but can be effectively measured by global run-on sequencing (GRO-seq), a technique that measures production rates of all nascent RNAs in a cell [8–10, 13, 14], or by cap-analysis of gene expression (CAGE) followed by sequencing [4, 15, 16]. Utilizing eRNA expression as a mark of enhancer activity, the FANTOM5 consortium recently generated an atlas of predicted enhancers in a large panel of human cancer and primary cell lines and tissues [4]. This study too used pairwise correlation (in this case, calculated be-tween expression levels of an eRNA and a gene whose transcription start site (TSS) is within a distance limit from it) to infer E–P links. Regression analysis was ap-plied to characterize the configuration of promoter regu-lation by enhancers [4]. However, since all samples were used for training the regression models, this analysis is prone to over-fitting and thus the predictive power of the derived models on new samples is unclear.
Here, we present FOCS (FDR-corrected OLS with
Cross-validation and Shrinkage), a novel procedure for inference of E–P links based on correlated activity pat-terns across many samples from heterogeneous sources. FOCS uses a cross-validation scheme in which regres-sion models are learnt on a training set of samples and then evaluated on left-out samples from other cell types. The models are subjected to a new statistical validation scheme that is tailored for zero-inflated data. Finally, validated models are optimally reduced to de-rive the most important E–P links. We applied FOCS on massive genomic datasets recorded by ENCODE, Roadmap Epigenomics, and FANTOM5, and on a large compendium of eRNA and gene expression profiles that we compiled from publicly available GRO-seq datasets. We demonstrate that FOCS outperforms ex-tant methods in terms of concordance with E–P inter-actions identified by ChIA-PET, HiChIP, and eQTL data. Collectively, applying FOCS to these four data re-sources, we inferred ~ 300,000 cross-validated E–P in-teractions spanning ~ 16,000 known genes. FOCS and our predicted E–P maps are publicly available athttp:// acgt.cs.tau.ac.il/focs.
Results
The FOCS procedure for predicting E–P links
We set out to develop an improved statistical framework for prediction of E–P links based on their correlated ac-tivity patterns measured over many cell types. As a test case, we first focused on ENCODE’s DHS profiles [2], which constitute 208 samples measured in 106 different cell lines (“Methods”) [2]. This rich resource was previously used to infer E–P links based on pairwise correlation between DHS patterns of promoters and en-hancers located within a distance of ±500 kbp. Out of ~ 42 million (M) pairwise comparisons, ~ 1.6 M pairs showed Pearson’s correlation > 0.7 and were regarded as putatively functional E–P links [2]. However, Pearson’s correlation is sensitive to outliers and thus may be prone to high rates of false positive predictions. This is espe-cially exacerbated in cases of sparse data (zero inflation), which are prevalent in enhancer activity patterns, as many of the enhancers are active only in a limited set of conditions. In addition, the combinatorial nature of tran-scriptional regulation in which a promoter is regulated by multiple enhancers is not considered by such a pair-wise approach.
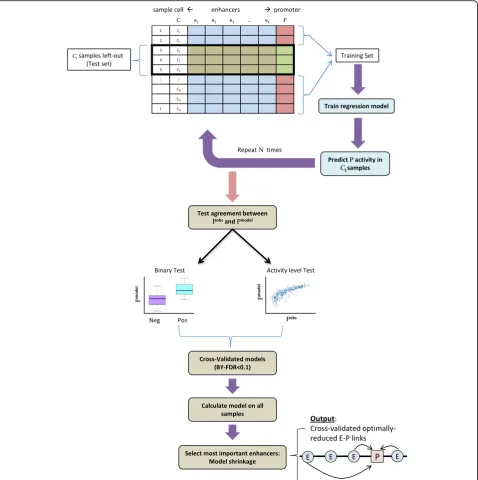
To address these points we developed a novel statisti-cally controlled regression analysis scheme for E–P map-ping, which we dubbed FOCS. Specifically, FOCS uses regression analysis to learn predictive models for pro-moter’s activity from the activity levels of itskclosest en-hancers, located within a window of ±500 kb around the gene’s TSS. (Throughout our analyses we usedk= 10.) Im-portantly, to avoid over-fitting of the regression models to the training samples, FOCS implements a leave-cell-type-out cross-validation (LCTO CV) procedure, as follows. In a dataset that contains samples fromCdifferent cell types, for each promoter FOCS performsCiterations of model learning. In each iteration, all samples belonging to one cell type are left out and the model is trained on the remaining samples. The trained model is then used to pre-dict promoter activity in the left-out samples (Fig.1).
samples. The first test is a“binary test”in which samples are divided into two sets, positive and negative, contain-ing the samples in which the promoter was active or
not, respectively, based on their measured signal (we used a signal threshold of 1.0 RPKM for this classifica-tion). Then, the Wilcoxon signed-rank test is used to Fig. 1FOCS statistical procedure for inference of E–P links. In a dataset with samples from N different cell types, FOCS starts by performing N cycles of leave-cell-type-out cross-validation (LCTO CV). In cyclej, the set of samples from cell typeCjis left out as a test set, and a regression
model is trained, based on the remaining samples, to estimate the level of the promoter P (the independent variable) from the levels of itsk
closest enhancers (the dependent variables). The model is then used to predict promoter activity in the test set samples. After the N cycles, FOCS tests the agreement between the predicted (Pmodel) and observed (Pobs) promoter activities using two non-parametric tests. In the
binary test, samples are divided into positive (Pobs
[image:3.595.60.539.88.569.2]compare the predicted promoter activities between these two sets (Fig. 1). The second test is an “activity level
test”, which examines the agreement between the
predicted and observed promoter’s activities using Spearman’s correlation. In this test, only the positive samples (that is, samples in which the measured
pro-moter signal is ≥1.0 RPKM) are considered. Gene
models with good predictive power should discriminate well between positive and negative samples (the binary test) and preserve the original activity ranks of the posi-tive samples (the activity level test), and models that pass these tests are regarded as statistically cross-validated. Of note, these two validation tests evaluate each pro-moter model non-parametrically without assuming any underlying distribution on the data when inferring sig-nificance. Next, FOCS corrects the pvalues obtained by these tests for multiple testing using the Benjamini– Yekutieli (BY) FDR procedure [19] with q-value < 0.1. The BY FDR procedure takes into account possible posi-tive dependencies between tests while the more fre-quently used Benjamini–Hochberg (BH) FDR procedure [20] assumes the tests are independent.
FOCS results for ENCODE DHS epigenomic data
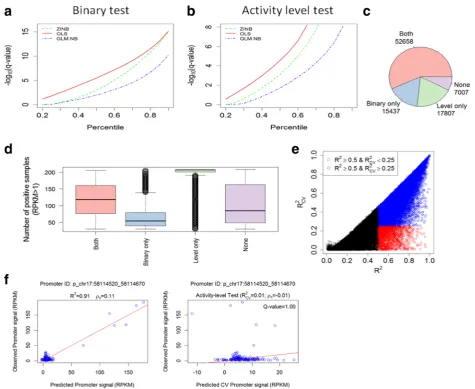
Applying FOCS to the ENCODE DHS dataset, we only considered promoters and enhancers that were active (that is, with signal > 1.0 RPKM) in at least 30 out of the 208 samples (This preprocessing step filtered out from the analysis 828 genes whose expression was most cell type-specific.) Overall, this dataset contained 92,909 and 408,802 active promoters and enhancers, respectively (“Methods”). We first evaluated the performance of the three alternative regression methods in terms of the number of validated models each of them yielded. We found that the OLS method consistently produced more validated models that passed both the binary and activity level tests (Fig. 2a, b; Additional file1: Table S1). Using OLS, out of the 92,909 analyzed promoters, 52,658 had models that passed both tests (q-value ≤0.1), while for 7007 promoters models passed none of these two tests (Fig. 2c). As expected, promoters with models that passed only the activity level test were active in a very high number of samples while those with models that passed only the binary test were active in a much lower number of samples (Fig. 2d; see Additional file 1: Figure S1 for examples of promoters in different validation categories). To examine the effect of the leave-cell-type-out cross-validation (CV) procedure we
compared R2 values obtained by OLS models
generated without CV to the values obtained when CV was applied (Fig. 2e). The results indicate that without CV, many models are over-fitted to the train-ing samples and have low predictive power on new ones. This problem is more severe in other datasets
that we analyzed, as shown in the subsequent section.
Fig. 2f shows an example of a promoter model with
low predictive power on new samples, and demon-strates the high sensitivity of Pearson’s correlation (or equivalently, of R2) to outliers. Such promoter models do not pass our CV tests and are considered to have low confidence.
The configuration of promoter regulation by enhancers
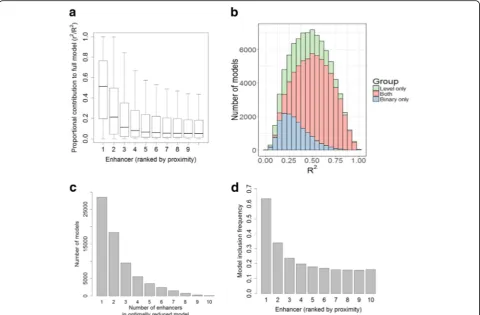
Next, we sought to characterize the configuration of promoter regulation by its enhancers, in terms of the number of regulating enhancers and their relative con-tribution. For each promoter that passed the validation tests, we now calculated a final model, this time consid-ering all samples (Fig.1), and estimated the relative con-tribution of each of its k enhancers to this full model. As in [4], per model, we measured the proportional contri-bution of each enhancer by calculating the ratio r2/R2
where ris the pairwise Pearson correlation between the enhancer and promoter activity patterns and R2 is the coefficient of determination of the entire promoter’s model. In the analysis of the ENCODE DHS data, we included in this step the 70,465 promoters that passed the activity level test (or both tests). In agreement with previous observation [4], the closest enhancers make significantly higher contributions than the distal ones (Fig.3a). However, the proportional contribution quickly reaches a plateau, indicating that, above a certain threshold, distance to promoter is no longer an
important factor, and enhancers 6–10 (ordered
according to their distance from the promoter)
contribute similarly to promoter activity (Fig. 3a). Second, we examined the distribution of R2 values of these statistically validated models: 54% of the models (37,716 out of 70,465) had R2≥0.5 (Fig.3b); 61% of the 52,658 models that passed both tests had R2≥0.5, compared to 32% of the 17,807 models that passed only the activity level test (in contrast, only 13% of 15,437 models that passed only the binary test had R2≥0.5). We note that models that passed the CV tests but have low R2 do contain confident and predictive information
on E–P links, though the low R2 suggests that
additional, missing regulatory elements play important roles in the regulation of the target promoter.
Ridge regularizations, since in cases of highly correlated variables (i.e., the enhancers), Lasso tends to select a sin-gle variable while Ridge gives them more equal coeffi-cients (“Methods”). In this analysis too, we included the 70,465 models that passed the activity level test. Figure 3c shows the distribution of the number of enhancers that were included in the enet-reduced models. On aver-age, each promoter was linked to 2.4 enhancers. Inclu-sion frequency decreased with E–P distance: the most proximal enhancer was included in 63% of the models
while the tenth enhancer was included in only 16% of them (Fig. 3d). Here too, the graph reaches a plateau and enhancers 6–10 show very similar inclusion fre-quencies. Additional file 1: Figure S2A, B show the dis-tribution of the actual E–P distance for the enhancers considered by FOCS and Additional file 1: Figure S2C shows the inclusion frequency as a function of this dis-tance. Regulatory elements located less than 5 kb from their target promoter have markedly higher inclusion frequency. To estimate false positive rate among Fig. 2Performance of three alternative regression methods for inferring E–P models.aPerformance of ordinary least squares (OLS), generalized linear model with negative binomial distribution (GLM.NB), and zero-inflated negative binomial (ZINB) regression using the binary test. Point (x,y) on a plot indicates that a fraction x of the models had−log10[q-value] < y computed by Wilcoxon rank sum test. OLS yields a higher fraction of validated models at any q-value cutoff.bSame asabut using the activity level validation test, withpvalues computed by the Spearman correlation test. Here too, OLS yields a higher fraction of validated models than the other methods.cNumber of promoters whose OLS models passed (at q < 0.1) each of the tests (or none).dThe distribution of the number of positive samples (samples in which the promoter is active, i.e., has RPKM≥1) for promoters in each category.eComparison between theR2values with and without cross-validation (CV). Eachdotis a promoter model.Blue dots
denote models withR2≥0.5 andR2
CV≥0:25.Red dotsdenote models with andR
2 > 0.5
andR2CV<0:25 corresponding to over-fitted models with low predictive power on novel samples.fA promoter whose model as computed without CV has a very highR2(left plot) but when CV is applied a lowR2
CVis obtained (right plot). This example demonstrates the sensitivity ofR
2(and Pearson
[image:5.595.60.536.90.479.2]enhancers included in our final enet-reduced models, we randomly selected 10,000 promoter models from the 70,465 models that passed the CV step, and added to each one of them an additional 11th enhancer randomly selected from a different chromosome. We then applied enet on these 10,000 models. Notably, the random enhan-cer was retained in only seven out of the 10,000 models, which is significantly lower than the inclusion frequency we observed for any E–P distance bin (Additional file1: Figure S2C), indicating a low false positive rate also among the long distance E–P links inferred by FOCS.
Comparison of performance of FOCS and extant methods using external validation resources
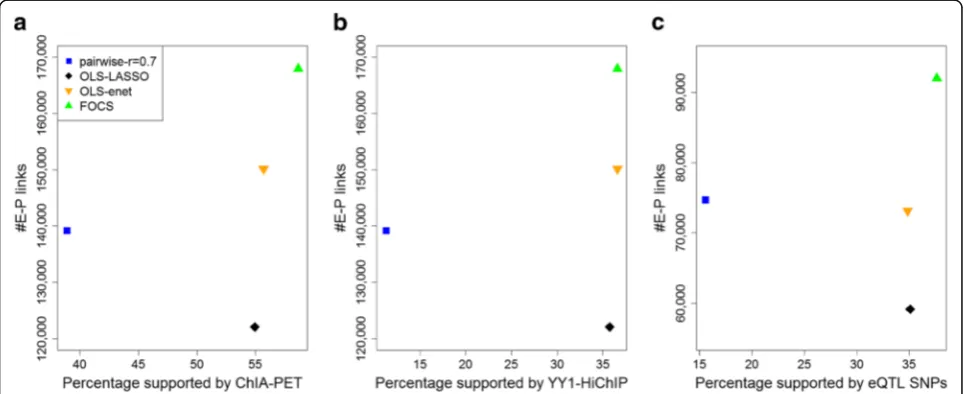
After optimally reducing the promoter models, FOCS predicted in the ENCODE DHS dataset a total of 167,988 E–P links covering 70,465 promoters and 92,603 distinct enhancers (http://acgt.cs.tau.ac.il/focs/ data/encode_interactions.txt). Next, we compared the performance of FOCS and three alternative methods for E–P mapping. (1)Pairwise: pairwise Pearson correlation
> 0.7 between E–P pairs located within ±500 kbp, and accounting for multiple testing using BH (FDR < 10−5; this was the main method used in [4], and also in [2] without multiple testing correction). (2) OLS + LASSO: models are derived by OLS analysis using all samples without CV, selected based on R2≥0.5 and reduced using LASSO shrinkage (“Methods”; this method was also applied in [4]). (3)OLS + enet: same as (2) but with enet shrinkage in place of LASSO. Table 1 summarizes the number of E–P links obtained by each method. FOCS yielded ~ 75% more models than the other methods.
To evaluate the validity of E–P mappings predicted by each method, we used three external omics resources: physical E–P interactions derived from RNAPII ChIA-PET data, physical E–P interactions derived from YY1 HiChIP experiments, and functional E–P links indicated by eQTL analysis (“Methods”). For physical E–P interac-tions derived from RNAPII ChIA-PET we used data re-corded in MCF7, HCT-116, K562, and HelaS3 cell lines
(a total of 922,997 interactions). Physical E–P
Fig. 3Configuration of promoter regulation by enhancers.aThe proportional contributions of the ten most proximal enhancers (within ±500 kb of the target promoter) to models predicting promoter activity. The x-axis indicates the order of the enhancers by their relative distance from the promoter, with 1 being the closest.bR2values of the models that passed one or both CV tests.cDistribution of the number of enhancers included in the validated, optimally reduced models (i.e., after elastic net shrinkage). Most shrunken models contain one to three enhancers.
[image:6.595.58.539.88.403.2]interactions inferred from HiChIP for YY1 (recently sug-gested to act as a general structural regulator of E–P links) were downloaded from [21] (911,190 interactions, measured in HCT-116, Jurkat, and K562 cell lines).
While 3C-based methods are generally not well
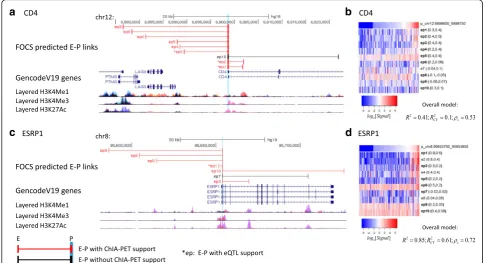
equipped to identify DNA loops below 25 kb, we inter-sected our results with the best available loop calls for these data ranges. eQTL data were downloaded from the GTEx project (2,283,827 unique significant eQTL–gene pairs) [22]. We defined a 1-kbp interval for each pro-moter and enhancer and calculated the fraction of E–P links that were supported by either ChIA-PET, HiChIP, or eQTL data (“Methods”). Notably, FOCS not only yielded many more E–P links (15,000–40,000 more), but also outperformed the alternative methods in terms of the fraction of predictions supported by either RNAPII ChIA-PET (Fig.4a), YY1 HiChIP (Fig.4b), or eQTL data (Fig. 4c). Figure 5 shows two FOCS-derived promoter models that are supported by ChIA-PET and eQTLs. Note that for the promoter model of CD4 (Fig. 5b) the
R2CV value was low (~ 0.1) while the Spearman
correl-ation (ρs) was 0.53 after CV. This demonstrates that FOCS can capture promoter models that exhibit non-linear relationships between the promoter and enhancer activities.
FOCS performance on additional large-scale datasets
[image:7.595.56.540.99.168.2]Having demonstrated FOCS proficiency in predicting E– P links on the ENCODE DHS data, we next wished to expand the scope of our E–P mapping. We therefore ap-plied FOCS to three additional large-scale genomic data-sets: (1) DHS profiles measured by the Roadmap Epigenomics project, consisting of 350 samples from 73 different cell types and tissues; and (2) FANTOM5 CAGE data that measured expression profiles in 1827 samples from 600 human cell lines and primary cells. The analysis of FANTOM5 data uses eRNA and TSS ex-pression levels for estimating the activity of enhancers and promoters, respectively (“Methods”). (3) A GRO-seq compendium that we compiled. Building on eRNAs as
Table 1Number of inferred promoter models obtained by four alternative methods on the ENCODE DHS dataset
Method type Number of promoter models Number of E–P links Number of unique enhancers
Pairwise (r≥0.7)+ FDR 39,372 139,170 53,950
OLS-LASSO (R2≥0.5)a 39,368 122,064 74,104
OLS-enet (R2≥0.5)a 39,407 150,158 85,926
FOCS 70,465 167,988 92,603
a
The number of OLS models (R2
≥0.5) was 39,892 before LASSO/enet shrinkage. These methods eliminate models in which no enhancer passed the shrinkage
Fig. 4Comparison of the performance of different methods for predicting E–P links using ChIA-PET and eQTL data as external validation. The y-axis shows the total number of predicted E–P links. The x-axis shows the percentage supported by the external source.aPol-II ChIA-PET.bYY1 HiChIP.
[image:7.595.57.541.477.674.2]quantitative markers of enhancer activity and the effect-iveness of the GRO-seq technique in detecting eRNA ex-pression [23], we compiled a large compendium of eRNA and gene expression profiles from publicly avail-able GRO-seq datasets, spanning a total of 245 samples measured on 23 different human cell lines (“Methods”).
We applied to these datasets the same procedure that we applied above to the ENCODE data. In the analysis of these datasets, OLS yielded more validated models than the other regression methods on the Roadmap Epigenomics and GRO-seq datasets (as was the case in the ENCODE DHS data (Fig.2a, b)), while GLM.NB and ZINB produced more models on FANTOM5 (Additional file 1: Figure S3A-C and Table S1). The performance of GLM.NB and ZINB on the FANTOM5 dataset is prob-ably due to the high fraction of zero entries in the count matrix of this dataset (~ 54%) compared to ENCODE, Roadmap, and GRO-seq data matrices (8, 4, and 19%, re-spectively). As OLS performed better on most datasets, all the results reported below are based on OLS. The numbers of promoter models that passed each validation test in each dataset are provided in Additional file 1:
Figure S4A–C. The effect of CV is presented in
Additional file 1: Figure S5A–C. In these datasets too,
many of the models with a high coefficient of determin-ation (R2≥0.5) when trained on all samples had low
predictive power on novel samples ( R2
CV <0:25 )
(Empirical FDR 16, 20, and 22% in Roadmap,
FANTOM5, and GRO-seq, respectively; Additional file 1: Figure S5), demonstrating the utility of CV in alleviat-ing over-fittalleviat-ing and thus reducalleviat-ing false positive models.
We next examined the relative contribution of each of the ten participating enhancers to the validated models, and in these datasets too, the most proximal enhancers had the highest role, but more distal ones made very similar contributions (Additional file 1: Figure S6A). In terms of explained fraction of the observed variability in promoter activity, 41 and 84% of the models that passed both tests in the Roadmap Epigenomics and GRO-seq datasets, respectively, had R2≥0.5, but only 11% of the validated models reached this performance in the
FANTOM5 dataset (Additional file 1: Figure S6B),
probably due to its exceptionally sparse data matrix. Last, FOCS applied enet model shrinkage to the models that passed the validation tests (the number of validated models and E–P links derived by FOCS on each dataset is summarized in Additional file 1: Table S2). In the optimally reduced models, each promoter was linked, on
a
b
c
d
Fig. 5Examples of FOCS-predicted E–P links supported by ChIA-PET/eQTL data.a,bCD4.c,dESRP1. TSS location is highlighted inlight blue.
b,dHeatmaps (log2[RPKM Signal]) for the activity patterns of CD4/ESRP1 promoters and their ten nearest enhancers. Enhancers included in the shrunken model are denoted by‘ep’and those that are not are denoted by‘e’. For each enhancer, its Pearson and Spearman correlations with the promoter are reported (leftandrightvalues in theparentheses). For each model, theR2;R2
[image:8.595.55.539.89.352.2]average, to 3.2, 2.8, and 3.6 enhancers in the Roadmap,
FANTOM5, and GRO-seq datasets, respectively
(Additional file 1: Figure S7A), and inclusion frequency decreased with E–P distance (Additional file 1: Figures S7B and S8). Finally, benchmarking against RNAPII ChIA-PET, YY1 HiChIP, and eQTL data, for most com-parisons, FOCS outperformed the alternative methods for E–P mapping by yielding many more E–P predic-tions at similar external validation rates (Additional file 1: Figure S9 and Table S3). Collectively, we provide a rich resource of predicted E–P mapping that covers 16,349 known genes, 113,653 promoters, 181,236 en-hancers, and 302,050 cross-validated E–P links.
Discussion
In this study we present FOCS, a novel statistical frame-work for predicting E–P interactions based on activity patterns derived from large-scale omic datasets. Apply-ing FOCS to four different genomic data sources, we de-rived an extensive resource of statistically cross-validated E–P links. Our E–P mapping resource further illumi-nates different facets of transcriptional regulation. First, a common naïve practice is to map enhancers to their nearest promoters. In FOCS predicted E–P links, ~ 26% of the enhancers are mapped to a promoter that is not the closest one (Additional file 1: Figure S10). Second, intronic enhancers are very common; 70% of the predicted E–P links involve an intronic enhancer
(Additional file 1: Table S2). Third, while in the
shrunken models each promoter was linked to, on aver-age, ~ 3 enhancers, many promoters were linked to a
single dominant enhancer and some were linked to a very high number of enhancers (8–10).
As an initial step in exploring relationships between the configuration of E–P interactions and gene function, we examined the set of housekeeping genes taken from [24]. These genes are ubiquitously expressed across dif-ferent cell types, suggesting that they are likely to have a simple regulation logic. Indeed, the promoters of these genes were involved in a significantly lower number of E–P links compared to all other genes (pvalue < 0.001 in all data types; Additional file 1: Figure S11). To fur-ther explore a possible relationship between the breadth of gene expression across tissues and the complexity of transcriptional regulation, we calculated the Shannon entropy for each gene promoter (higher entropy indi-cates larger expression breadth). Interestingly, we ob-served a strong negative relationship where promoters with more restricted activity profiles (that is, lower en-tropy) are associated with a larger number of enhancers (Fig. 6, Additional file1: Figure S12). As a set, the genes associated with higher numbers of enhancers were enriched for Gene Ontology (GO) categories related to cell adhesion, signal transduction, and differentiation (Additional file2).
We also observed that while the vast majority (~ 90%) of enhancers in FOCS-derived models had positive Pear-son and Spearman correlation with the activity pattern of their target promoters, the models also included cases of negative correlation, suggesting that the regulatory element functions as a repressor (Additional file 1: Fig-ure S13). Finally, the activity level test in FOCS,
computed using the Spearman correlation, can also ac-count for promoter models where the relationship be-tween the enhancer and promoter activity patterns is not linear, perhaps explaining the R2< 0.5 values observed in the majority of FANTOM5 and Roadmap models (Additional file1: Figure S6B).
An aspect that we did not consider in our analysis is the constraints imposed on transcriptional regulation by the 3D organization of the genome. Recent findings indicate that most E–P interactions are limited by chromosomal territories called topologically associated domains [25,26]. Further research is needed to better elucidate this connec-tion between 3D organizaconnec-tion and E–P links and to better understand to what extent such constraints are universally or differentially imposed in different cell types.
Biological interpretation of our analysis of DHS data (ENCODE and Roadmap Epigenomics datasets) impli-citly assumes that transcription rate at promoters is positively related with promoter DHS signal. We there-fore examined DHS–expression correlations in cell lines for which both DHS and RNA-seq data were available in the ENCODE project (17 cell lines in total). In all cases, we observed high Spearman but low Pearson correla-tions (Additional file 1: Figure S14), indicating a strong monotonic but non-linear relationship.
The leave-cell-type-out scheme applied by FOCS is con-servative and ensures that the inferred models have pre-dictive power in diverse cellular contexts. However, it will not infer models for genes whose expression is strictly cell type-specific. Analyzing larger numbers of diverse cell types containing related cell types, we expect a lower chance of missing gene models that are cell type-specific.
While our manuscript was under review another novel method for inference of E–P interactions, called JEME, was introduced [27]. Unlike FOCS, JEME (and the previ-ously published TargetFinder [28]) makes cell type-specific predictions and combines different omic data types within the same model.
Our broad compendium of E–P interactions can greatly assist the functional interpretation of genetic variants that are associated with disease susceptibility, as the majority (~ 90%) of the variants detected by genome-wide associ-ation studies are located in noncoding sequences [29]. Similarly, it can help in the interpretation of recurrent noncoding somatic mutations (SMs) in cancer genomes. SM hotspots in regulatory regions are detected at an ac-celerated pace with the rapid accumulation of
whole-genome sequencing (WGS) of tumor samples [30, 31].
Additionally, the predicted E–P links can be integrated into and boost bioinformatics pipelines that seek DNA motifs in regulatory elements that putatively regulate sets of co-expressed genes. Overall, the FOCS method and the compendium we provide hold promise for advancing our understanding of the noncoding regulatory genome.
Conclusions
FOCS predicts ~ 1.5-fold more E–P links (n= 302,050) compared to the standard pairwise method with Pearson coefficientr> 0.7 (n= 204,276). On average over all datasets, FOCS E–P links show a higher support rate by external validation resources compared to the commonly used pairwise method (r > 0.7). These results demonstrate the improved prediction power and control of false positive E–P links.
FOCS uses two non-parametric tests to examine the robustness of each promoter model. Using these tests we can correct for multiple promoter models and use them when it is suspected that there is no linear relationship between the E–P activity patterns. Previous methods used the Pearson correlation test (or, equivalentlyR2values) assuming linearity between enhancer and promoter activity patterns.
FOCS is capable of detecting repressor–promoter (R-P) links, which result from negative Spearman correlation between R–P activity patterns. R–P links are less known and are also of high interest.
We provide a new compendium of eRNA and gene expression patterns based on 245 GRO-seq profiles from 23 different cell types. This compendium can be used as a genome-wide resource of enhancer activity in a diverse panel of cell lines.
Methods
ENCODE DHS data preprocessing
DHS peak locations of enhancers and promoters were taken from a master list of 2,890,742 unique, non-overlapping DHS segments [2] (ftp://ftp.ebi.ac.uk/pub/data bases/ensembl/encode/integration_data_jan2011/byDataTy pe/openchrom/jan2011/combined_peaks/multi-tissue.mast er.ntypes.simple.hg19.bed).
We extracted from the master list the set of known
(n= 68,762) and novel (n= 44,853) promoter–DHS
peaks taken from ftp://ftp.ebi.ac.uk/pub/databases/ ensembl/encode/integration_data_jan2011/byDataType/ openchrom/jan2011/promoter_predictions.
The remaining (n= 2,777,127) non-promoter–DHS
peaks in the master list were considered as putative regulatory elements, collectively referred to here as en-hancer elements. To create enen-hancer/promoter signal matrices, we used the BAM files of 208 UW DNase-seq samples (106 cell types) from the Gene Expression
Omnibus (GEO) dataset GSE29692 [2, 29, 32]. The
resulting in 92,909 promoters and 408,802 putative enhancers.
We defined for each promoter the set of k = 10 candidate enhancers located within a window of 1 Mb (±500 kb up-stream/downstream of the promoter’s center position). We mapped promoters to annotated genes using GencodeV10 TSS annotations (ftp://genome.crg.es/pub/Encode/data_ analysis/TSS/Gencodev10_TSS_May2012.gff.gz); 54,650 promoters (out of 92,909) were linked to annotated TSSs.
Roadmap epigenomic DHS data preprocessing
DHS peak positions for 474,004 putative enhancer and 33,086 promoter non-overlapping DHS segments [3] were taken from:
https://personal.broadinstitute.org/meuleman/ reg2map/HoneyBadger2-intersect_release/DNase/ p10/prom/25/state_calls.RData
https://personal.broadinstitute.org/meuleman/ reg2map/HoneyBadger2-intersect_release/DNase/ p10/enh/25/state_calls.RData
To create enhancer/promoter signal matrices, we used the aligned reads (BED files) of 350 UW
DNase-seq samples (73 cell types) from GEO dataset
GSE18927 [29, 32, 34–36]. The number of reads
mapped within each DHS peak was counted using the BEDTools utilities [33]. We focused only on pro-moters/enhancers with signal ≥1 RPKM in at least one sample, resulting in 32,629 promoters and 470,549 pu-tative enhancers.
We defined for each promoter the set of k = 10 candi-date enhancers located within a window of ±500 kb. We mapped promoters to annotated genes using Genco-deV10 TSS annotations (ftp://genome.crg.es/pub/Enco de/data_analysis/TSS/Gencodev10_TSS_May2012.gff.gz) [37]; 17,941 (out of 32,629) promoters were linked to an-notated TSSs.
FANTOM5 data preprocessing
Promoter (CAGE tags peak phase 1 and 2) and enhancer (human permissive enhancers phase 1 and 2;n= 65,423) expression matrices (counts and normalized) covering 1827 samples (600 cell types) were downloaded from FANTOM5 DB (http://fantom.gsc.riken.jp/). As in the FANTOM5 paper [4] we focused on promoters with ex-pression≥1 TPM (tags per million) in at least one sam-ple, resulting in 56,290 promoters annotated with 26,489 RefSeq TSSs within ±500 bp. We defined for each pro-moter the set of k = 10 candidate enhancers located within a window of ±250 kb from the promoter’s TSS. The choice of smaller window here was done for consistency with the FANTOM5 choices.
GRO-seq data preprocessing
We downloaded raw sequence data of 245 GRO-seq sam-ples from the Gene Expression Omnibus (GEO) database (Additional file3: Table S5). See Additional file1: Supple-mental Methods for further processing details. We defined for each gene the set of k = 10 candidate enhancers located within a window of ±500 kb from its TSS.
FOCS model implementation
The input to FOCS is two activity matrices, one for en-hancers (Me) and the other for promoters (Mp), mea-sured across the same samples. Activity is meamea-sured by DHS signal in ENCODE and Roadmap data, and by ex-pression level in FANTOM5 and GRO-seq data. Samples were labeled with a cell-type label out of C cell types. The output of FOCS is predicted E–P links.
First, FOCS builds for each promoter an OLS regres-sion model based on thekenhancers whose center posi-tions are closest to the promoter’s center position (in ENCODE, Roadmap, and FANTOM5) or TSS (in GRO-seq). Formally, let yp be the promoterp normalized ac-tivity pattern (measured in counts per million (CPM);yp is a row from Mp) and letXpbe the normalized activity matrix of the corresponding k enhancers (CPM; k rows fromMe). We build an OLS linear regression model yp = Xpβp+εp, whereεpis a vector that denotes the errors of the model and βp is the (k+ 1) x 1 vector of coeffi-cients (including the intercept) to be estimated.
Second, FOCS performs leave-cell-type-out cross-validation (LCTO CV) by training the promoter model based on samples from C−1 cell types and testing the predicted promoter activity of the samples from the left-out cell type. This step is repeatedCtimes. The result is a vector of predicted activity values ymodel
p for all
samples.
FOCS tests the predicted activity values using two val-idation tests. (1) Thebinary testexamines whetherymodelp
discriminates between the samples in whichpwas active (observed activity yp≥1 RPKM) and the samples in which p was inactive (yp< 1 RPKM). (2) The activity
level test calculates, for the active samples, the signifi-cance of the Spearman correlation between ymodel
p and yp. Spearman correlation compares the ranks of the ori-ginal and predicted activities. We obtain two vectors of
p values, one for each test, of length n (the number of promoter models).
Third, to correct for multiple testing, FOCS applies on each p value vector the Benjamini–Yekutieli (BY)
file1: Figure S6B). For promoters that passed these CV tests final models are trained again using all samples.
FOCS next selects informative enhancers for each final promoter model. The enhancer selection step is de-scribed in Additional file1: Supplemental Methods.
Alternative regression methods
We compared the performance of the OLS method with GLM.NB and ZINB regression methods. We repeated the FOCS steps but in the first step, instead of OLS we applied the GLM.NB or ZINB method (see Additional file1: Supplemental Methods for details).
FANTOM5 E–P linking using OLS regression was followed by Lasso shrinkage (defined as OLS-LASSO) as described in [4] (see Additional file 1: Supplemental Methods for details).
GO enrichment analysis
GO enrichments were calculated using topGO R pack-age [38] (algorithm =“classic”, statistic =“fisher”, mini-mum GO set size = 10). We split the genes into target and background sets using their enhancer bin sets. Genes belonging to bins with 1–3/1–4/4–10/5–10 en-hancers were considered as the target set and compared to all genes from all bins as the background set. Correc-tion for multiple testing was performed using the BH procedure [20].
External validation of predicted E–P links
We used three external data resources for validating FOCS E–P link predictions: (1) RNAPII ChIA–PET inter-actions; (2) YY1-HiChIP interinter-actions; and (3) eQTL SNPs.
We downloaded 922,997 ChIA-PET interactions
(assayed with RNAPІІ, on four cell lines: MCF7, HCT-116, K562, and HelaS3) from the Chromatin–Chromatin Spatial Interaction (CCSI) database [39] (GEO accession numbers of the original ChIA-PET samples are provided in Additional file3: Table S6). We used the liftOver tool (from Kent utils package provided by UCSC) to trans-form the genomic coordinates of the interactions from hg38 to hg19. HiChIP interactions mediated by YY1 TF (HCT116, Jurkat, and K562 cell types) were taken from [21] (GEO accession id GSE99521). As done in [21], we retained 911,190 YY1-HiChIP high-confidence interac-tions (Origami probability> 0.9). For eQTL SNPs, we used the significant SNP–gene pairs from GTEx analysis V6 and V6p builds; 2,283,827 unique eQTL SNPs cover-ing 44 different tissues were downloaded from the GTEx portal [22].
We used 1-kbp intervals (±500 bp upstream/down-stream) for the promoters (relative to the center position in ENCODE/Roadmap/FNATOM5 or to the TSS pos-ition in GRO-seq) and the enhancers (±500 bp from the enhancer center). An E–P pair is considered supported
by a particular capture interaction if both the promoter and enhancer intervals overlap different anchors of an interaction. An E–P pair is considered supported by an eQTL SNP if the SNP is located within the enhancer’s interval and is associated with the expression of the pro-moter’s gene. For each predicted E–P pair we checked if the promoter and enhancer intervals are supported by capture interactions and eQTL data. We then measured the fraction of E–P pairs supported by these data re-sources. See Additional file1: Supplemental Methods for the significance calculation of the empiricalpvalue.
Statistical tests, visualization, and tools used
All computational analyses and visualizations were done in the R statistical language environment [40]. We used the two-sided Wilcoxon rank-sum test implemented in wilcox.test() function to compute the significance of the binary test. We used the cor.test() function to compute the significance of the Spearman correlation in the activ-ity level test. Spearman/Pearson correlations were com-puted using the cor() function. To correct for multiple testing we used the p.adjust() function (method =‘BY’). We used the GenomicRanges package [41] for finding overlaps between genomic positions. We used rtrack-layer [42] and GenomicInteractions [43] packages to im-port/export genomic positions. Counting reads in genomic positions was calculated using BEDTools [33]. OLS models were created using the lm() function in the stat package [40]. GLM.NB models were created using the glm.nb() function in the MASS package [44]. ZINB models were created using the zeroinfl() function in the pscl package [45]. Graphs were made using graphics [40], ggplot2 [46], gplots [47], and the UCSC genome browser (https://genome.ucsc.edu/).
Additional files
Additional file 1:Figures S1–S14, Tables S1–S3, and Supplemental Methods. (PDF 3127 kb)
Additional file 2:Table S4 GO enrichment analyses. (XLSX 29 kb)
Additional file 3:Tables S5–S6 GRO-seq and ChIA-PET samples. (XLSX 25 kb) Additional file 4:Review history. (DOCX 473 kb)
Funding
T.A.H. and D.A. were supported in part by fellowships from the Edmond J. Safra Center for Bioinformatics at Tel Aviv University. R.S. is supported by the Israeli Science Foundation (Grant 317/13) and the Bella Walter Memorial Fund of the Israel Cancer Association. R.E. is supported by the Israeli Cancer Association, with the generous assistance of the ICA Netherlands friends. R.E. is a Faculty Fellow of the Edmond J. Safra Center for Bioinformatics at Tel Aviv University.
Availability of data and materials
Materials (code and data) are available athttp://acgt.cs.tau.ac.il/focs. The code for reproducing FOCS output and figures is available at
or“Revised”license) and athttps://doi.org/10.5281/zenodo.1165278 (under BSD 3-Clause“New”or“Revised”license).
The database of FOCS is available athttp://acgt.cs.tau.ac.il/focs/ download.html.
ENCODE DNase-seq samples (106 cell types) were downloaded from GEO dataset GSE29692 [2,29,32].
Roadmap Epigenomics DNase-seq samples (73 cell types) were downloaded from GEO dataset GSE18927 [29,32,34–36]. FANTOM5 CAGE data were downloaded fromhttp://
fantom.gsc.riken.jp/[4].
GEO accession numbers of the analyzed GRO-seq datasets are listed in Additional file3: Table S5.
Review history
The review history of this article is available in Additional file4.
Authors’contributions
TAH, RE, and RS designed the research. TAH and DA developed the computational method. TAH performed the analyses, parsed the ENCODE, Roadmap, and FANTOM5 data, and assembled the GRO-seq compendium. All authors analyzed the data and wrote the manuscript. All authors read and approved the final manuscript.
Competing interests
The authors declare that they have no competing interests.
Author details
1Blavatnik School of Computer Science, Tel Aviv University, 69978 Tel Aviv,
Israel.2Stanford Center for Inherited Cardiovascular Disease, Stanford University, Stanford, CA 94305, USA.3Department of Human Molecular Genetics & Biochemistry, Sackler School of Medicine, Tel Aviv University, 69978 Tel Aviv, Israel.4Sagol School of Neuroscience, Tel Aviv University, Tel Aviv, Israel.
Received: 23 October 2017 Accepted: 13 April 2018
References
1. Consortium EP, et al. An integrated encyclopedia of DNA elements in the human genome. Nature. 2012;489:57–74.
2. Thurman RE, Rynes E, Humbert R, Vierstra J, Maurano MT, Haugen E, et al. The accessible chromatin landscape of the human genome. Nature. 2012; 489:75–82.
3. Consortium RE, Kundaje A, Meuleman W, Ernst J, Bilenky M, Yen A, et al. Integrative analysis of 111 reference human epigenomes. Nature. 2015;518: 317–30. Available from:http://www.ncbi.nlm.nih.gov/pubmed/25693563
4. Andersson R, Gebhard C, Miguel-Escalada I, Hoof I, Bornholdt J, Boyd M, et al. An atlas of active enhancers across human cell types and tissues. Nature. 2014;507:455–61.
5. Kim T-K, Hemberg M, Gray JM, Costa AM, Bear DM, Wu J, et al. Widespread transcription at neuronal activity-regulated enhancers. Nature. 2010;465:182–7. 6. Shlyueva D, Stampfel G, Stark A. Transcriptional enhancers: from properties
to genome-wide predictions. Nat Rev Genet. 2014;15:272–86. Available from:http://www.ncbi.nlm.nih.gov/pubmed/24614317
7. Elkon R, Agami R. Characterization of noncoding regulatory DNA in the human genome. Nat Biotechnol. 2017;35:732.
8. Hah N, Danko CG, Core L, Waterfall JJ, Siepel A, Lis JT. A rapid, extensive, and transient transcriptional response to estrogen signaling in breast cancer cells. Cell. 2011;145:622–34. Available from: http://dx.doi.org/10.1016/j.cell. 2011.03.042.
9. Hah N, Murakami S, Nagari A, Danko CG, Kraus WL. Enhancer transcripts mark active estrogen receptor binding sites. 2013;1210–1223. 10. Li W, Notani D, Ma Q, Tanasa B, Nunez E, Chen AY, et al. Functional
importance of eRNAs for estrogen-dependent transcriptional activation events. Nature. 2013;498:516.
11. Melo CA, Drost J, Wijchers PJ, van de Werken H, de Wit E, Vrielink JAFO, et al. eRNAs are required for p53-dependent enhancer activity and gene transcription. Mol Cell. 2013;49:524–35.
12. Andersson R, Sandelin A, Danko CG. A unified architecture of transcriptional regulatory elements. Trends Genet. 2015;31:426–33.
13. Léveillé N, Melo CA, Rooijers K, Diaz-Lagares A, Melo SA, Korkmaz G, et al. Genome-wide profiling of p53-regulated enhancer RNAs uncovers a subset of enhancers controlled by a lncRNA. Nat Commun. 2015;6
14. Core LJ, Waterfall JJ, Lis JT. Nascent RNA sequencing reveals widespread pausing and divergent initiation at human promoters. Science. 2008;322: 1845–8.
15. Shiraki T, Kondo S, Katayama S, Waki K, Kasukawa T, Kawaji H, et al. Cap analysis gene expression for high-throughput analysis of transcriptional starting point and identification of promoter usage. Proc Natl Acad Sci. 2003;100:15776–81.
16. Wu H, Nord AS, Akiyama JA, Shoukry M, Afzal V, Rubin EM, et al. Tissue-specific RNA expression marks distant-acting developmental enhancers. PLoS Genet. 2014;10:e1004610.
17. Lawless JF. Negative binomial and mixed Poisson regression. Can J Stat. 1987;15:209–25.
18. Greene WH. Accounting for excess zeros and sample selection in Poisson and negative binomial regression models. 1994;
19. Benjamini Y, Yekutieli D. The control of the false discovery rate in multiple testing under dependency. Ann Stat. 2001:1165–88.
20. Benjamini Y, Hochberg Y. Controlling the false discovery rate: a practical and powerful approach to multiple testing. J R Stat Soc Ser B. 1995:289–300. 21. Weintraub AS, Li CH, Zamudio AV, Sigova AA, Hannett NM, Day DS, et al.
YY1 is a structural regulator of enhancer-promoter loops. Cell. 2017;171: 1573–1579.e28.
22. GTEx Consortium. The Genotype-Tissue Expression (GTEx) pilot analysis: Multitissue gene regulation in humans. Science. 2015;348:648–60. 23. Danko CG, Hyland SL, Core LJ, Martins AL, Waters CT, Lee HW, et al.
Identification of active transcriptional regulatory elements from GRO-seq data. Nat Methods. 2015;12:433–8.
24. Eisenberg E, Levanon EY. Human housekeeping genes , revisited. Trends Genet. 2013;29:569–74. Available from: http://dx.doi.org/10.1016/j.tig.2013.05.010 25. Rao SSP, Huntley MH, Durand NC, Stamenova EK, Bochkov ID, Robinson JT,
et al. A 3D map of the human genome at kilobase resolution reveals principles of chromatin looping. Cell. 2014;159:1665–80.
26. Tang Z, Luo OJ, Li X, Zheng M, Zhu JJ, Szalaj P, et al. CTCF-mediated human 3D genome architecture reveals chromatin topology for transcription. Cell. 2015;163:1611–27.
27. Cao Q, Anyansi C, Hu X, Xu L, Xiong L, Tang W, et al. Reconstruction of enhancer–target networks in 935 samples of human primary cells , tissues and cell lines. 2017;
28. Whalen S, Truty RM, Pollard KS. Enhancer–promoter interactions are encoded by complex genomic signatures on looping chromatin. 2016;48 29. Maurano MT, Humbert R, Rynes E, Thurman RE, Haugen E, Wang H, et al.
Systematic localization of common disease-associated variation in regulatory DNA. Science. 2012;337:1190–5.
30. Melton C, Reuter JA, Spacek DV, Snyder M. Recurrent somatic mutations in regulatory regions of human cancer genomes. Nat Genet. 2015;47:710–6. 31. Weinhold N, Jacobsen A, Schultz N, Sander C, Lee W. Genome-wide analysis
of noncoding regulatory mutations in cancer. Nat Genet. 2014;46:1160–5. 32. Polak P, Lawrence MS, Haugen E, Stoletzki N, Stojanov P, Thurman RE, et al.
Reduced local mutation density in regulatory DNA of cancer genomes is linked to DNA repair. Nat Biotechnol. 2014;32:71.
33. Quinlan AR, Hall IM. BEDTools : a flexible suite of utilities for comparing genomic features. 2010;26:841–2.
34. Bernstein BE, Stamatoyannopoulos JA, Costello JF, Ren B, Milosavljevic A, Meissner A, et al. The NIH roadmap epigenomics mapping consortium. Nat Biotechnol. 2010;28:1045–8.
35. Neph S, Vierstra J, Stergachis AB, Reynolds AP, Haugen E, Vernot B, et al. An expansive human regulatory lexicon encoded in transcription factor footprints. Nature. 2012;489:83–90.
36. Schultz MD, He Y, Whitaker JW, Hariharan M, Mukamel EA, Leung D, et al. Human body epigenome maps reveal noncanonical DNA methylation variation. Nature. 2015;523:212.
37. Harrow J, Frankish A, Gonzalez JM, Tapanari E, Diekhans M, Kokocinski F, et al. GENCODE: the reference human genome annotation for The ENCODE Project. Genome Res. 2012;22:1760–74.
38. Alexa A, Rahnenfuhrer J. topGO: Enrichment Analysis for Gene Ontology. R package version 2.28.0; 2016.
40. R Core Team. R: A Language and Environment for Statistical Computing. Vienna; 2017. Available from:https://www.r-project.org/
41. Aboyoun P, Carlson M, Lawrence M, Huber W, Gentleman R, Morgan MT, et al. Software for computing and annotating genomic ranges. 2013;9:1–10. 42. Lawrence M, Gentleman R, Carey V. rtracklayer: an R package for interfacing
with genome browsers. Bioinformatics. 2009;25:1841–2.
43. Harmston, N., Ing-Simmons, E., Perry, M., et al. GenomicInteractions: R package for handling genomic interaction data.. 2015. Available from:https://github. com/ComputationalRegulatoryGenomicsICL/GenomicInteractions/. 44. Venables WN, Ripley BD. Modern applied statistics with S. 4th ed. New York;
2002.
45. Zeileis A, Kleiber C, Jackman S. Regression models for count data in R. J Stat Softw. 2008;27:1–25.
46. Wickham H. ggplot2: elegant graphics for data analysis. New York: Springer-Verlag; 2009. Available from:http://ggplot2.org
47. Warnes GR, Bolker B, Bonebakker L, Gentleman R, Liaw WHA, Lumley T, et al. gplots: various R programming tools for plotting data. 2016. Available from: