ARTIGO ORIGINAL
RESUMO
Introdução: A percentagem de utentes inscritos em unidades da rede de cuidados de saúde primários sem médico de família atribuí-do atingiu 16,6% em 2011. O Ministro da Saúde atribuí-do XIX Governo Constitucional, então em funções, aatribuí-dotou em 2012 um conjunto de medidas com vista a que, no final de 2014, toda a população tivesse acesso a médico de família. Neste artigo avaliamos a evolução das desigualdades socioeconómicas na atribuição de médicos de família em Portugal entre 2009 e 2014.
Material e Métodos: Utilizamos dados anuais relativos ao número de utentes com e sem médico de família em cada unidade de prestação de cuidados de saúde primários, bem como ao poder de compra médio da população servida por cada unidade. A análise é realizada com recurso a medidas de concentração.
Resultados: A maior concentração da proporção de utentes sem acesso a médico de família encontra-se em unidades que servem populações economicamente mais favorecidas, embora a magnitude da mesma se tenha vindo a reduzir ao longo dos anos analisa-dos. Entre as unidades que servem populações mais desfavorecidas, verifica-se uma situação próxima da igualdade.
Discussão: Os resultados obtidos podem refletir o facto de populações economicamente mais favorecidas estarem localizadas em zonas urbanas com maior escassez de médicos de família, mas também o facto de estas optarem por não ter médico de família, recorrendo a prestadores privados.
Conclusão: Os resultados apontam para uma diminuição das desigualdades socioeconómicas ao longo dos anos em análise, nomea-damente entre as populações em que estas desigualdades eram mais expressivas.
Palavras-chave: Cuidados de Saúde Primários; Disparidades nos Níveis de Saúde; Factores Socioeconómicos; Medicina Familiar; Portugal; Prestação de Cuidados de Saúde
Are Socioeconomic Inequalities in the Process of
Registration with Family Physicians Decreasing in
Portugal?
As Desigualdades Socioeconómicas na Atribuição de
Médicos de Família em Portugal estão a Diminuir?
1. CentER. Tilburg University. Tilburg. Holanda.
2. NOVA School of Business and Economics. Universidade Nova de Lisboa. Lisboa. Portugal. 3. Center for Economic Policy Research - CEPR. London. United Kingdom.
Autor correspondente: Ana Moura. [email protected]
Recebido: 30 de outubro de 2017 - Aceite: 29 de agosto de 2018 | Copyright © Ordem dos Médicos 2018
Ana MOURA1, Pedro Pita BARROS2,3
Acta Med Port 2018 Dec;31(12):730-737 ▪ https://doi.org/10.20344/amp.9873 ABSTRACT
Introduction: The percentage of citizens who were not registered with a family physician in Portugal reached 16.6% in 2011. In 2012 the Ministry of Health implemented several measures aiming at improving access to family physicians. One clear objective was that all individuals would be registered with a family physician by 2014. We evaluate the evolution of the socioeconomic inequalities regarding registration with family physicians in Portugal between 2009 and 2014.
Material and Methods: We use data at the primary health care unit level on the number of individuals who are not registered with a family physician and the purchasing power of the population served by each unit. The analysis is done using concentration measures.
Results: We find a higher concentration of individuals not registered with a family physician among units serving populations with higher socioeconomic status, although this has been decreasing over the years analyzed. Amongst units serving the most disadvantaged populations, we find a situation close to perfect equality.
Discussion: Our results may reflect the fact that populations with higher economic status live in urban areas where there is greater shortage of family physicians. Alternatively, it may be that these populations choose not to have a family physician within the public system, thus relying on private providers.
Conclusion: Our findings convey a reduction in existing socioeconomic inequalities in terms of registration with a primary care physician, during the period under analysis. This reduction took place among the populations which experienced more inequality.
Keywords: Delivery of Health Care; Family Practice; Health Status Disparities; Portugal; Primary Health Care; Socioeconomic Factors
INTRODUCTION
Portuguese primary healthcare [cuidados de saúde primários (CSP)] are widely known as the mainstay of the Portuguese National Health System [Serviço Nacional de Saúde (SNS)] involving the prevention and delivery of healthcare in illness, health promotion, healthcare continu
-ity and the link with other healthcare services.
The initial contact point of healthcare users with the SNS would ideally be provided by CSP and general prac
-titioners/family physicians (GPs) have a crucial role not
only in the management of the first contact with the SNS of healthcare users as well as in the follow-up of acute and chronic health problems and also in the link with specialty healthcare through medical referral.1
In 2011, 16.6% of registered users within the CSP net
ARTIGO ORIGINAL Emergency Department at an hospital rather than attending
a CSP unit, namely in case of an acute disease.3 Overuse of emergency care has led to an increasing waste of resourc
-es and avoidable costs to the SNS. Even though a registra
-tion with a permanent GP is not a necessary condi-tion for having access to primary care, this is certainly a facilitating factor.
Access to healthcare and particularly the rate of users not having been registered with a permanent GP is obvi
-ously a concern in terms of health policies. The aim to ‘al
-locate a family physician/GP to each Portuguese citizen by the end of 2014’ was established by the Minister of Health of the XIX Portuguese Constitutional Government in June 2011.4 A slightly different objective was established in the Plan of the Portuguese XIX Constitutional Government by “ensuring the universal coverage with primary healthcare and the access to a family physician to most citizens, reduc
-ing current inequalities in access…”.5
A set of measures previously agreed with representa
-tives of the two medical syndicates was adopted in 2012 in order to meet the proposed objective of the Plan of the XIX Constitutional Government. An increase from 1,550 to 1,900 in the number of users registered with a permanent GP was the major measure.6 The allocation of 700,000 ad -ditional users to a permanent GP was expected by the Min
-istry of Health at an initial stage, with the aim of reaching one million users over the medium term. At the same time, the working schedule of physicians was extended from 35 to 40 weekly hours. Both measures came into force by the 1st January 2013.6
Other measures aimed to increase the number of GPs working in the public sector (opening of call for tenders and new vacancies for consultants, retaining physicians in de
-prived areas,7 hiring of outpatient services from social & charitable organisations, as well as recruitment of foreign8 and retired9 physicians), were adopted throughout the man -date of the XIX Constitutional Government, in addition to an increased medical productivity [opening of new healthcare units (unidades de saúde familiar)(USF) and the shift from model-A to model-B USF-type CSP units10 – both complying with what had been settled within the Memorandum of Un
-derstanding signed within the international financial bailout for Portugal].11
A regular publication by the ACSS (Administração Cen-tral do Sistema de Saúde – Central Administration of the Health System) of a report on the access to CSP has been implemented, as a contribution to a widespread knowledge of the conditions of access to healthcare. Initially, nation
-wide aggregated information was made available by the ACSS regarding the trend in the rate of users with no ac
-cess to a permanent GP.2 Recently, more detailed disaggre -gated information regarding the access to primary care was made available by the institution.12,13
Even though concerns regarding inequalities and asym
-metries in access have been frequently shown by both the policy and legislation, the information disclosed by the ACSS do not allow for any conclusions regarding this subject. This
information predominantly regards the number and rate of users having not been registered with a permanent GP and the distribution of these aggregates within different regions, with different socioeconomic realities, has been ignored. Physician inflows and outflows within the SNS by spe
-cialty, including family physicians has been carried out by the University of Coimbra for the Portuguese Medical As
-sociation (Ordem dos Médicos). Inflows are delivered by pre- and postgraduate training and outflows by physician retirement. Apart from the global physician inflows and out
-flows, the presence of inequalities regarding the nationwide geographical distribution is recognised by the study. How
-ever, these inequalities have not been quantified.14
This study was aimed at filling this void, through the analysis of the trend between 2009 and 2014 in the ine
-qualities between CSP units in terms of rate and number of users having not been registered with a permanent GP in different regions and therefore serving communities from different socioeconomic statuses. Different measures aimed at reducing the percentage of users not registered with a permanent GP were implemented during this period of time, including the increase in the number of registered users within the patients list of each GP in 2012. A quantifi
-cation of any possible impact on the inequalities that were analysed goes beyond the scope of this study.
MATERIAL AND METHODS Statistical analysis
A brief descriptive analysis of the trend in the rate of registered users within CSP units and not registered with a permanent GP throughout 2009 - 2014 has been obtained. In addition, measures of inequality regarding the distri
-bution of the rate of users with no access to a permanent GP have been calculated and this analysis was carried out at the level of each CSP unit by the use of concentration curves and indices.15-19
Two variables were crucial for obtaining the concentra
-tion curves: one variable reflecting the relevance which, in our case, corresponds to the rate of registered users within CSP units and not registered with a permanent GP and one variable reflecting the average purchasing power of the population served by the CSP unit, by using the purchasing power indicator, which is more detailed below.
The CSP units were sorted according to the purchasing power of the municipalities where the registered users are originally from, by an increasing order (horizontal axis), for each year of the study. The concentration is the measure of the rate of users not registered with a permanent GP in each CSP unit (vertical axis). In graphic terms, the reading of the concentration curves can be established according to a 45-degree line starting from the origin, representing an equality situation, considering that the rate of users not registered with a permanent GP is the same in any CSP unit, regardless of the socioeconomic status of the popula
-tion it serves, i.e. a certain percentage of CSP units serv
ARTIGO ORIGINAL percentage of users not registered with a permanent GP. In case that the concentration curves do not coincide with the line of perfect equality, the difference between both curves shows whether the users not registered with a per
-manent GP are more or less concentrated in units serving populations with lower purchasing power.
This study was aimed at the quantification of a) the rate of users not registered with a permanent GP in Portugal in the top 10% of the CSP units serving a more disadvan
-taged population in terms of purchasing power; b) the rate of users not registered with a permanent GP in the top 10% of the CSP units serving a population with higher purchas
-ing power. The trend in the inequalities of access to CSP over the years has also been assessed, as the analysis was made separately for each year of the study.
The score of concentration is just a way of quantifica
-tion of inequality shown by the concentra-tion curves and is defined as the double of the area between the concentra
-tion curve and the line of perfect equality, ranging between -1 and 1. In a perfect equality situation, the score of con
-centration is zero. By convention, the con-centration index assumes negative values when the concentration curve is above the line of perfect equality, corresponding to a dis
-proportional concentration of units with a high rate of users not registered with a permanent GP in more disadvantaged regions.
The Stata software was used for the statistical analysis, namely regarding the concentration index and these were calculated by the use of the Stata command conindex.20 The concentration index and curves are simple ways of getting information on the socioeconomic inequalities in terms of rate of users not registered with a permanent GP, considering the CSP unit as the observational unit. How
-ever, similar CSP units in terms of equality can be found when these have a similar rate of users not registered with a permanent GP, corresponding to a situation of inequality in terms of access to a permanent GP in CSP units, which is worth mentioning. Therefore, the analysis has been com
-plemented with information regarding the total number of registered users within each CSP unit registered or not with a permanent GP, allowing for the analysis of the trend in so
-cioeconomic inequalities between CSP units, in terms of the absolute number of users not registered with a permanent GP.
Data
Annual data regarding each CSP unit have been used and were made available by the ACSS in 8 Jun 2015. This is a panel database in which the observational units (CSP units) are looked at throughout the period of time analysed and initially consisted of 4,789 different observations. This is a non-balanced panel as both the development of new CSP units and the removal of existing units have occurred during the study time.
A total of 109 initial observations were excluded from the study, corresponding to situations in which the CSP unit had a rate of registered users not registered with a perma
-nent GP above 90%. These were units that were about to change its status or were about to be merged with other units, suggesting a data registration issue due to the transi
-tion. No clarification made available by the ACSS regarding this issue and therefore we chose to exclude these obser
-vations and therefore the final database consisted of a total of 4,680 observations.
Information regarding the municipality of residence of the registered users in each CSP unit is available from the database, apart from data regarding the absolute number and rate of users not registered with a permanent GP, al
-lowing for the cross-linking with a purchasing power index at the level of each municipality obtained by Marktest – the sales index.21 The sales index is set in parts per thousand and allows for the quantification of the relevance of each municipality regarding one variable (or set of variables) within the national total, corresponding to 1,000 in each year, i.e. for each year, sales index consists of a ranking of municipalities in terms of purchasing power and the sum of the sales indices of the municipalities from mainland Portu
-gal totals 1,000. This index is frequently used as a measure of the purchasing power of each municipality, due to the ab
-sence of alternative statistics at the municipal level.22,23 As the users of each CSP unit came from different municipali
-ties, a weighting has been developed for each municipality in the total of registered users in each unit, allowing for the calculation of a weighted average of the purchasing power da mean of a user of each CSP unit.
RESULTS
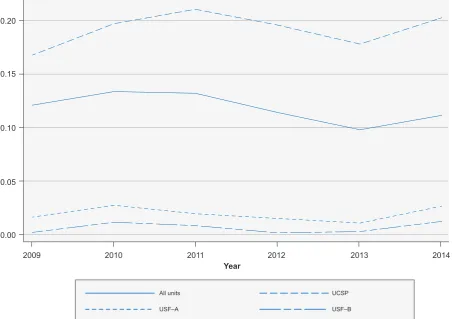
The trend in the mean rate of users not registered with a permanent GP between 2009 and 2014 is shown in Fig. 1, regarding the whole CSP units, as well by unit type ( Uni-dade de Cuidados de Saúde Personalizados, UCSP; Uni-dade de Saúde Familiar de modelo A, USF-A and Unidade de Saúde Familiar de modelo B, USF-B). On average, an 11.6% rate of users not registered with a permanent GP among the whole CSP units has been found throughout the study period. A decline in the rate of users not registered with a permanent GP has been globally found before 2013 and this tendency has been reversed in 2014. In addition, it has been found that the rate of users not registered with a permanent GP is much higher in UCSP than in USF, which may be explained by the own commitments of the USF when these were within their development as, by definition, the USF cannot serve users not registered with a perma
-nent GP. Therefore, users not registered with a perma-nent GP are usually registered in UCSP. The fact that a positive rate of users not registered with a permanent GP can be found in Fig.1 in the whole set of USF may be related to transitional situations due to the registration of users with physicians, to physician mobility between different UCSP or to the placement of new physicians.
The major results regarding the calculation of the con
-centration curves are shown in Fig. 2.
ARTIGO ORIGINAL
more advantaged are those with a higher concentration of the rate of users not registered with a permanent GP, as the estimated concentration curve is below the line of perfect equality, according to the Fig. 2. In the case of units serving populations with lower purchasing power, a situation close to equality can be found; in fact, the 2009 estimated con
-centration curve coincides with the line of perfect equality line for the CSP units with a population within the first quin
-tile of average purchasing power.
Between 2009 and 2014, the concentration curve of us
-ers not registered with a permanent GP has come closer to the situation of perfect equality, showing a positive ten
-dency. The concentration curves are very close to the line of perfect equality in 2013 and 2014, which is worth mention
-ing.
The value of the concentration index for each study year is shown in Table 1, in order to make the analysis of the trend over the years easier. Values have confirmed the abovementioned conclusions and values statistically indis
-tinguishable from zero have been found in 2013 and 2014, not allowing to reject the hypothesis of perfect equality be
-tween CSP units regarding the rate of users not registered with a permanent GP.
However, it is worth mentioning that the concentration index only gives information regarding the whole distribu
-tion. The assessment on whether or not a similar trend oc
-curred throughout the whole distribution was made avail
-able by the major percentiles of the estimated concentration curves (shown in Fig. 2) which are shown in Table 2 for the years 2009 and 2014. In general, no significant changes in the lowest percentiles of the distribution have been found and the situation has remained unchanged. However, a positive trend has been found above the 25th percentile to -wards a decline in inequalities.
In fact, a 9.9% accumulated rate of users not registered with a permanent GP has been found in the decile of the CSP units serving more disadvantaged populations, in
-creasing to 10.6% in 2014 (remaining almost unchanged). As regards the decile of the units serving populations more advantaged (90th percentile and above), a 15.2% ac -cumulated rate of users not registered with a permanent GP have been found in 2009 [= (1 - 0,848)*100] and 13% in 2014 [= (1 - 0,870)*100].
Finally, we have estimated similar concentration curves to those presented above, by calculating the concentra
-tion based on the number of users registered or not with a
Figure 1 – Trend in the rate of registered users not registered with a permanent GP within CSP units. A total of 4,680 observations have
been used in this figure, corresponding to CSP units that were observed throughout 2009-2014. From the total number of observations, 2,731 corresponded to UCSP-type units, while 1.056 and 893 corresponded to USF-model A and B, respectively. Each line represents the average rate of users not registered with a permanent GP, for each CSP unit type.
Source: own elaboration.
Rate of users not registered with a permanent GP
Year
0.00
2009 2010 2011 2012 2013 2014
All units
USF–A USF–B
UCSP
ARTIGO ORIGINAL
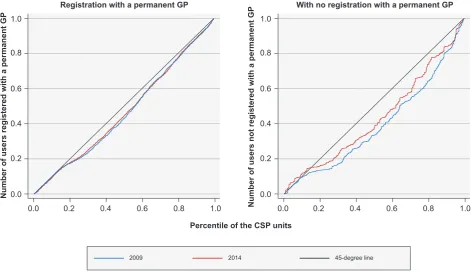
permanent GP (instead of the concentration based on the rate) and the results of this analysis are shown in Fig 3. An improved access to CSP in absolute terms can be found in Fig. 3, confirming that the results presented above are not due to a reduced access in units with a lower rate of users not registered with a permanent GP. While the dis
-tribution of the number of registered users registered with a permanent GP has remained unchanged between 2009
and 2014, a positive trend towards a decline in the exist
-ing inequalities has been found. The same conclusions are supported by the concentration index: values of 0.072 and
Figure 2 – Concentration curves of the rate of users not registered with a permanent GP. The percentile of the CSP units in terms of the
purchasing power of the population they serve is represented in the horizontal axis. The concentration (vertical axis) is calculated sepa-rately to each year within the rate of users within each CSP unit and not registered with a permanent GP. The perfect equality between CSP units is represented by the 45-degree line, starting from the origin. The fact that the concentration curve has come closer to the line of perfect equality corresponds to a decline in the inequalities between CSP units as regards the rate of users not registered with a permanent GP.
Source: own elaboration.
2009
2012
2010
2013
2011
2014
Rate of users not registered with a permanent GP
Percentile of the CSP units
0.0
0.0
0.0
0.0
0.0
0.0 0.0
0.0
0.0
0.0
0.0
0.0 0.2
0.2
0.2
0.2
0.2
0.2 0.4
0.4
0.4
0.4
0.4
0.4 0.6
0.6
0.6
0.6
0.6
0.6 0.8
0.8
0.8
0.8
0.8
0.8 1.0
1.0
1.0
1.0
1.0
1.0 0.2
0.2
0.2
0.2
0.2
0.2 0.4
0.4
0.4
0.4
0.4
0.4 0.6
0.6
0.6
0.6
0.6
0.6 0.8
0.8
0.8
0.8
0.8
0.8 1.0
1.0
1.0
1.0
1.0
1.0
Table 1 – Concentration index, 2009-2014. The concentration was
obtained separately for each year, within the rate of users not regis-tered with a permanent GP within each CSP unit.
Year Concentration index Standard error observationsNumber of
2009 0.115 0.028 717
2010 0.109 0.027 748
2011 0.153 0.029 786
2012 0.074 0.032 792
2013 0.010 0.035 815
2014 0.035 0.032 822
Source: own elaboration.
Table 2 – Percentiles of the estimated concentration curves, 2009
and 2014, referred to the percentiles of the CSP units in terms of purchasing power of the populations they serve. The concentration was obtained separately for 2009 and 2014, within the rate of users not registered with a permanent GP within each CSP unit.
Percentile 2009 2014
1% 0.012 0.014
5% 0.050 0.051
10% 0.099 0.106
25% 0.186 0.221
50% 0.427 0.471
75% 0.655 0.740
90% 0.848 0.870
95% 0.924 0.924
99% 0.982 0.987
ARTIGO ORIGINAL
0.065 have been found for the distribution of the number of users not registered with a permanent GP in 2009 and 2014, respectively, while values of 0.221 and 0.137 have been found regarding the distribution of the number of us
-ers not registered with a permanent GP in 2009 and 2014, respectively.
DISCUSSION
A decline in socioeconomic inequalities regarding the rate of users not registered with a permanent GP during the period between 2009 and 2014 and is the major result of the analysis. This decline has mainly occurred in units serving a population above the first decile in terms of distribution of purchasing power and a similar situation could already been found in 2009 in units serving more disadvantaged populations, which has remained unchanged during the study period.
The result should be carefully considered as, on one hand, it may show, on one hand, the fact that more advan
-taged populations are located in urban areas, with lower number of GPs working within the public sector and, on the other hand, the fact that more advantaged populations may simply choose not to register with a permanent GP within the SNS. The former corresponds to the shortage of supply of healthcare services, while the latter may just show the
preferences of a specific population group, with an action towards the demand for healthcare. A distinction between both effects was not possible within our analysis and this is an issue that should be worth being included in further stud
-ies.
The option of choosing whether or not being registered with a permanent GP is also worth mentioning. The number of users within each CSP unit not registered with a perma
-nent GP was the common denominator in our analysis, sug
-gesting that all users wished to register with a GP within the SNS. However, a part of the users may choose not to regis
-ter with a permanent GP and this option may be particularly relevant in more advantaged populations mostly attending private healthcare services. Information regarding this is
-sue was disclosed by the ACSS in Feb and in May 2015.4,5 According to this information, a 0.3% rate of users having specifically chosen not to register with a permanent GP has been found and the trend regarding this aggregate was not analysed as no further information has been disclosed by the ACSS. However, the opting out from the system was not one of the determinants of the recent decline in the rate of users not registered with a permanent GP, as suggested by the small dimension of these cases found in 2015.
In addition, our analysis was mainly focused on the ac
-cess to healthcare, expressed in terms of registration with a permanent GP. The effective use of CSP and waiting times
Figure 3 – Concentration curves of the number of users registered and not registered with a permanent GP. The percentile of the CSP units
in terms of the purchasing power of the population they serve is shown in the horizontal axis in each chart. The concentration (vertical axis) is calculated separately for 2009 and 2014 within the number of users registered and not registered with a permanent GP (left and right panel, respectively) in each CSP unit. Perfect equality between CSP units is represented by the 45-degree line starting from the origin. The fact that the concentration curves are below the line of perfect equality shows a disproportional concentration of users not registered with a permanent GP in the units serving more advantaged populations. The decline in the inequalities between units has mainly occurred in the number of users not registered with a permanent GP.
Source: own elaboration.
0.0 0.0
0.0 0.2 0.4 0.6 0.8 1.0 0.0 0.2 0.4 0.6 0.8 1.0
0.2 0.2
0.4 0.4
0.6 0.6
0.8 0.8
1.0 1.0
Registration with a permanent GP With no registration with a permanent GP
Percentile of the CSP units
2009 2014 45-degree line
Number of users registered with a permanent GP
ARTIGO ORIGINAL for the access to CSP were other relevant variables within this context, as being registered with a permanent GP does not imply the use of this healthcare service. Given the una
-vailability of information regarding the use and waiting times for medical appointments within CSP units, our analysis was not focused on these subjects.
The decline in socioeconomic inequalities between CSP units has mainly occurred in 2013 and 2014, corresponding to the period upon an increase in the number of users regis
-tered with a permanent GP (a mainly administrative meas
-ure, capable of producing immediate effects). Even though quite suggestive, this result did not allow for a definition of a causal relationship between that measure and the decline in the socioeconomic inequalities in terms of registration with a permanent GP.
Finally, the nature of data that were used is a limitation of the study that is worth mentioning. As the CSP unit was used as the observational unit for our study, similar CSP units may exist with inequalities regarding the population that they serve, which has not been captured in the present analysis.
CONCLUSION
The trend in socioeconomic inequalities in terms of the rate of users within CSP units not registered with a perma
-nent GP was analysed in this study, regarding a time period in which different measures have been adopted in order to extend the coverage with a GP to the general population. The aim of the Ministry of Health was initially clear: all the Portuguese would have been able to register with a per
-manent GP by the end of 2014; when considered in these terms, this was not met, regardless of the adopted meas
-ures.
However, another aim of the Ministry of Health was the
reduction in the access asymmetries. These were not par
-ticularly severe, when measured in terms of the rate of us
-ers not registered with a permanent GP. The CSP units with a higher rate of users not registered to a permanent GP are not disproportionally located in municipalities with a more disadvantaged population, based on the results of the con
-centration measures. On the contrary, the con-centration of CSP units with a higher rate of users not registered with a permanent GP has been found in areas where populations with higher purchasing power live. An improvement regard
-ing the socioeconomic inequalities has been found through
-out the study years. In fact, the estimated concentration curves are getting closer to the line of perfect equality, both in absolute values as in the rate of users not registered with a permanent GP.
HUMAN AND ANIMAL PROTECTION
The authors declare that the followed procedures were according to regulations established by the Ethics and Clini
-cal Research Committee and according to the Helsinki Dec
-laration of the World Medical Association.
DATA CONFIDENTIALITY
The authors declare that they have followed the proto
-cols of their work centre on the publication of patient data. CONFLICTS OF INTEREST
The authors declare that there were no conflicts of inter
-est in writing this manuscript.
FINANCIAL SUPPORT
The authors declare that this manuscript was in part fi
-nanced by the Ministry of Health of the Portuguese Repub
-lic.
REFERENCES
1. Allen J, Gay B, Crebolder H, Heyrman J, Svab I, Ram P, et al. A definição europeia de medicina geral e familiar. Rev Port Clin Geral. 2005;21:511-6.
2. Administração Central do Sistema de Saúde, IP. Relatório anual sobre o acesso a cuidados de saúde nos estabelecimentos do SNS e entidades convencionadas 2014. Lisboa: ACSS; 2015.
3. Simões J, Augusto GF, Fronteira I, Hernández-Quevedo C. Portugal: health system review. Health Syst Transit. 2017;19:1–184.
4. RTP Noticias. Ministro da Saúde promete médico de família para todos os Portugueses. Notícia datada de 11 de Janeiro de 2012. [consultado 2018 mai 21]. Disponível em: http://www.rtp.pt/noticias/saude/ministro-da-saude-promete-medico-de-familia-para-todos-os-portugueses_ v517190.
5. Presidência do Conselho de Ministros. Programa do XIX Governo Constitucional, 2011-2015. [consultado 2018 mai 21]. Disponível em: https://www.portugal.gov.pt/media/130538/programa_gc19.pdf. 6. Portugal. Ministério da Saúde. Decreto-Lei nº 266-D/2012. 31 de
Dezembro de 2012.
7. Portugal. Ministério da Saúde. Despacho nº 8056-C/2013. 20 de Junho de 2013.
8. Público. Nova vaga de médicos de Cuba a caminho de Portugal, notícia datada de 9 de Fevereiro de 2012. [consultado 2018 mai 21]. Disponível
em: https://www.publico.pt/2012/02/09/jornal/nova-vaga-de-medicos-de-cuba-a-caminho-de-portugal-23952364.
9. Ministério da Saúde. Despacho nº 9532-A/2013. 19 de Julho de 2013. 10. Ministérios das Finanças e da Saúde. Despacho n. 4586-A/2013. 1 de
Abril de 2013.
11. Portugal: memorandum of understanding on specific economic policy conditionality. 17 May 2011. [consultado 2018 mai 21]. Disponível em: http://ec.europa.eu/economy_finance/eu_borrower/mou/2011-05-18-mou-portugal_en.pdf.
12. Administração Central do Sistema de Saúde, IP. 1ª publicação periódica sobre o número de utentes inscritos nos cuidados de saúde primários. Lisboa: ACSS; 2015.
13. Administração Central do Sistema de Saúde, IP. 2ª publicação periódica sobre o número de utentes inscritos nos cuidados de saúde primários. Lisboa: ACSS; 2015.
14. Santana P, Peixoto H, Loureiro A, Costa C, Nunes C, Duarte N. Estudo de evolução prospectiva de médicos no Sistema Nacional de Saúde. Lisboa: OM; 2013.
15. Wagstaff A, Paci P, van Doorslaer E. On the measurement of inequalities in health. Social Sci Med. 1991;33:545-57.
ARTIGO ORIGINAL
17. Kakwani NC. Income inequality and poverty: methods of estimation and policy applica- tions. NY: Oxford University Press; 1980.
18. O’Donnell O, van Doorslaer E, Wagstaff A, Lindelow M. Analyzing health equity using survey data: a guide to techniques and their implementation. Washington: The World Bank; 2008.
19. Kakwani NC, Wagstaff A, van Doorslaer E. Socioeconomic inequalities in health: measurement, computation and statistical inference. J Econometrics. 1997;77:87-104.
20. O’Donnell O, O’Neill S, Van Ourti T, Walsh B. Conindex: estimation of
concentration indices. Stata J. 2016;1:112-38.
21. Marktest. Sales index (variável ID_DESENV.ID61). 2009-2014. Lisboa: Marktest; 2009.
22. Pereira AM, Pereira RM, Santos JP. For whom the bell tolls: road safety effects of tolls on uncongested SCUT highways in Portugal. GEE Papers 0074. Lisboa: Gabinete de Estratégia e Estudos, Ministério da Economia; 2017.